
Australia Facial Care Market Size, Share, Trends and Forecast by Product Type, Ingredient, Gender, Distribution Channel, and Region, 2026-2034
Australia Facial Care Market Size, Share, Trends & Forecast (2026-2034)
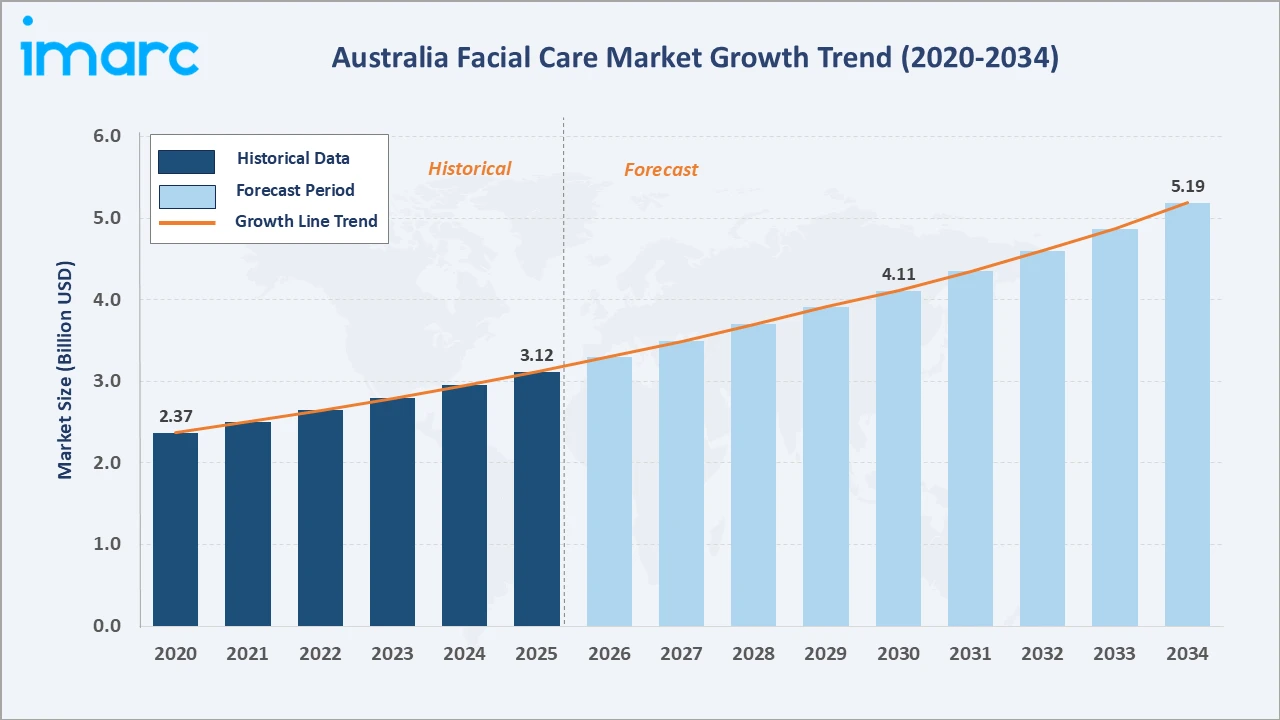
The Australia facial care market reached USD 3.12 Billion in 2025 and is projected to reach USD 5.19 Billion by 2034, growing at a CAGR of 5.66% during 2026-2034. The Australia facial care market growth is driven by the country’s exceptionally high ultraviolet exposure, rising consumer preference for natural and locally sourced formulations, and expanding digital and social-commerce discovery channels. According to the Australian Radiation Protection and Nuclear Safety Agency (ARPANSA), Australia records some of the highest ambient UV levels in the world, with roughly two in three Australians developing skin cancer by age 70, a public-health reality that keeps daily facial sun protection central to skincare routines. Facial cleansers lead product-type demand at 29.8%, chemical-based formulations dominate ingredients at 67.4%, and New South Wales commands 34.8% of the national market on the strength of its dense retail and healthcare infrastructure.
Market Snapshot
|
Metric |
Value |
|
Market Size (2025) |
USD 3.12 Billion |
|
Forecast Market Size (2034) |
USD 5.19 Billion |
|
CAGR (2026-2034) |
5.66% |
|
Base Year |
2025 |
|
Historical Period |
2020-2025 |
|
Forecast Period |
2026-2034 |
|
Dominant Product Type |
Facial Cleansers (29.8%, 2025) |
|
Dominant Ingredient |
Chemical (67.4%, 2025) |
|
Leading Region |
New South Wales (34.8%, 2025) |
Australia’s facial care market expanded from USD 2.37 Billion in 2020 to USD 3.12 Billion in 2025, is anchored at USD 4.11 Billion in 2030, and is forecast to reach USD 5.19 Billion by 2034. The pandemic years accelerated a durable shift toward online skincare discovery and purchasing, while the 2022-2025 recovery phase coincided with rising household disposable income that broadened demand for premium, multi-step facial regimens across Australian cities and regional centres.
To get more information on this market, Request Sample
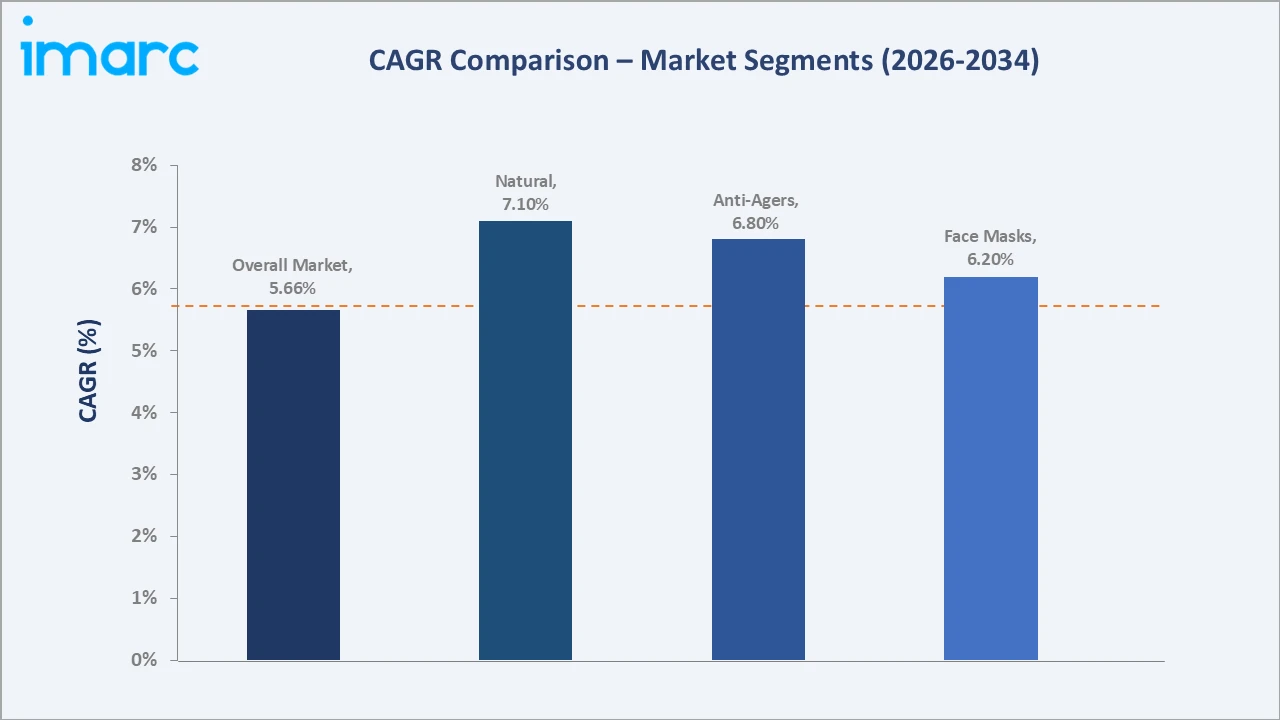
Natural-ingredient formulations grow fastest at an estimated ~7.1% CAGR as clean-label and indigenous-botanical positioning gains traction, while anti-agers grow at ~6.8% CAGR on the back of premiumization and rising consumer willingness to pay for visible-result actives. Facial cleansers and moisturizers sustain the largest revenue base, while face masks and skincare sets post above-market growth as occasion-based and gifting purchase behaviour strengthens across retail and online channels.
Executive Summary
Australia’s facial care market reached USD 3.12 Billion in 2025, representing one of the most UV-exposed and skin-health-conscious consumer markets in the Asia-Pacific region. Facial care products, cleansers, moisturizers, anti-agers, skincare sets, face masks, toners, and serums, are formulated to protect, hydrate, and repair skin against Australia’s harsh climatic conditions while addressing evolving consumer demand for natural, ethically sourced ingredients. The market is projected to reach USD 5.19 Billion by 2034.
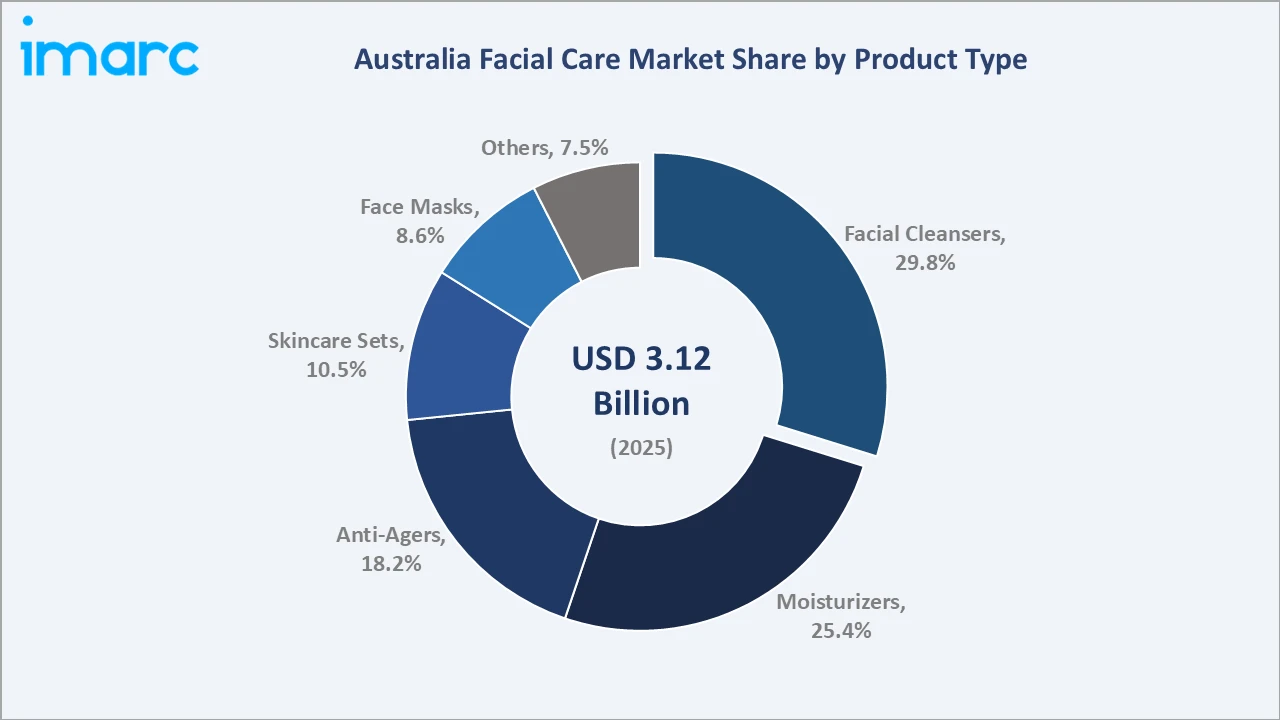
Facial cleansers lead product-type demand at 29.8% share in 2025, reflecting their role as a daily-routine staple across all skin types, followed by moisturizers at 25.4% and anti-agers at 18.2%. Chemical-based formulations account for 67.4% of ingredient demand due to proven efficacy and lower cost, though natural formulations are scaling quickly on sustainability and toxin-free positioning. New South Wales leads regionally at 34.8%, supported by its concentration of retail infrastructure, dermatology clinics, and affluent metropolitan consumers in Sydney.
Looking ahead, the Australia facial care market outlook remains positive as digital personalization, SPF-infused daily skincare, and indigenous-botanical product innovation reshape category growth. Facial care market trends through 2034 point toward deeper integration of AI-driven skin diagnostics, subscription-based replenishment, and continued expansion of premium and natural sub-segments ahead of the broader mass market.
Key Market Insights
|
Insight |
Data |
|
Dominant Product Type |
Facial Cleansers - 29.8% share (2025) |
|
Dominant Ingredient |
Chemical - 67.4% market share (2025) |
|
Leading Region |
New South Wales - 34.8% market share (2025) |
|
Fastest-Growing Segment |
Natural - ~7.1% CAGR (2026-2034) |
|
Market Opportunity |
Indigenous-botanical skincare; SPF-infused daily moisturizers; AI-personalized regimens; male grooming expansion; subscription and refill models |
Key Analytical Observations Supporting the Above Data:
- Facial Cleansers at 29.8%: Cleansers lead because they anchor every skincare routine regardless of skin type, age, or gender, and their broad price accessibility across supermarkets and pharmacy channels sustains the highest repeat-purchase frequency of any product type.
- Chemical Ingredients at 67.4%: Chemical formulations dominate due to established efficacy in exfoliation, anti-aging, and UV filtering, backed by decades of dermatological research and lower manufacturing costs relative to natural extraction processes.
- New South Wales at 34.8%: NSW leads regionally due to Sydney’s dense concentration of pharmacy chains, department-store beauty halls, dermatology clinics, and the state’s largest population base among Australian jurisdictions.
- Natural Ingredients Growing Fastest: Consumer preference for parabens-free, sulfate-free, and indigenous-botanical formulations, such as Kakadu plum and macadamia oil, is pulling natural-ingredient demand ahead of the category average.
- Anti-Agers Premiumizing: Rising disposable income is shifting spend toward higher-priced, clinically positioned anti-aging serums and creams, lifting average transaction values across department and specialty retail.
Australia Facial Care Market Overview
Australia’s facial care market encompasses the formulation, manufacturing, distribution, and retail sale of cleansers, moisturizers, anti-agers, skincare sets, face masks, and related facial skincare products to male, female, and unisex consumers nationwide.
To evaluate market opportunities, Request Sample
The facial care ecosystem integrates ingredient and raw-material suppliers, contract formulators and manufacturers, global and local brand owners, pharmacy and retail distribution networks, and e-commerce platforms. Macroeconomic factors shaping the industry include rising household disposable income, sustained population growth in metropolitan corridors, and Australia’s uniquely high ultraviolet exposure, which keeps sun-protective facial care a year-round essential rather than a seasonal purchase.
Market Dynamics
Market Drivers
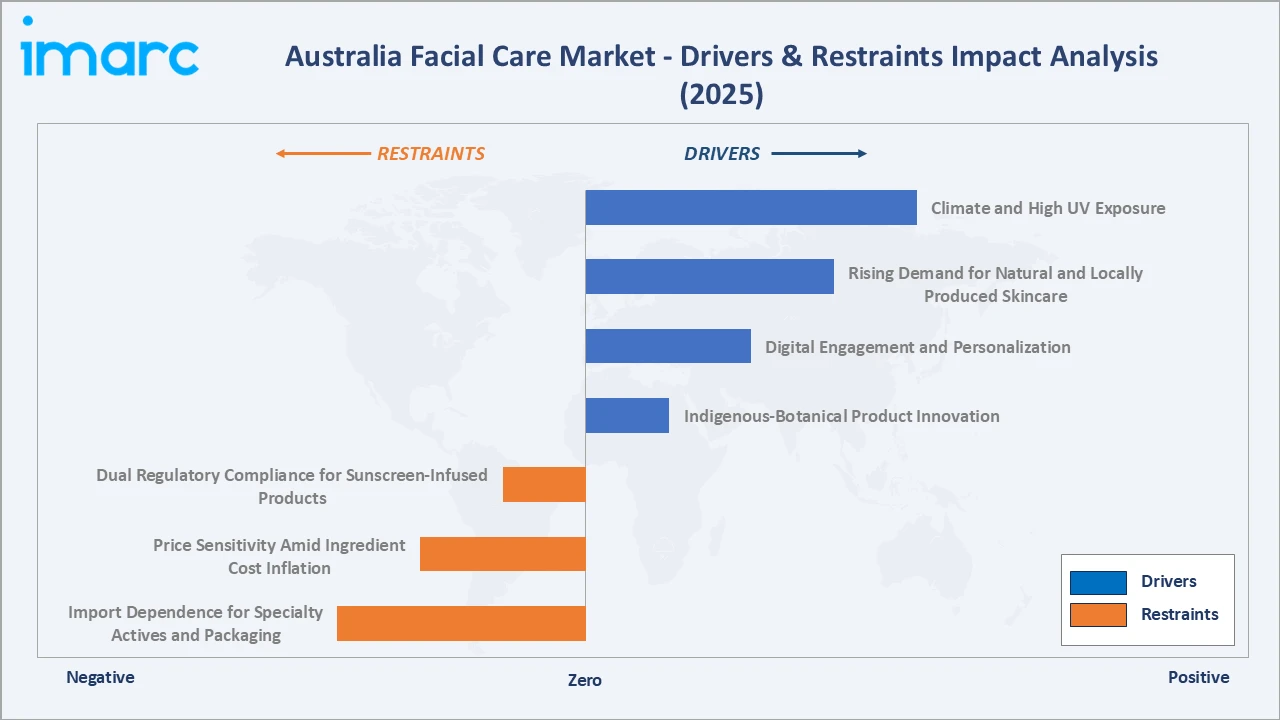
- Climate and High UV Exposure: Australia’s harsh sun exposure significantly drives facial care growth. ARPANSA data shows Australia has among the highest UV radiation levels globally, with around two in three Australians developing skin cancer by age 70, and roughly 95% of melanoma cases attributable to UV exposure. This sustains strong daily demand for SPF-infused moisturizers, after-sun repair creams, and anti-pigmentation formulations across every Australian state.
- Rising Demand for Natural and Locally Produced Skincare: A strong cultural preference for wellness and sustainability is pushing consumers toward organic, plant-based, and cruelty-free facial care. Indigenous botanicals such as finger lime, quandong, and macadamia oil are becoming signature ingredients as local brands emphasize sustainable sourcing and clean-label transparency.
- Digital Engagement and Personalization: Growing use of social media, beauty influencers, and e-commerce is enabling niche brands to build loyal online communities. Skin quizzes, AI-based analysis, and virtual consultations are expanding personalized product recommendations, particularly among tech-savvy younger consumers.
- Growing Household Disposable Income: Increasing average household income is allowing Australian consumers to allocate more spend toward premium, multi-step facial regimens that promise superior formulation quality and ethical sourcing credentials.
Market Restraints
- Dual Regulatory Compliance for Sunscreen-Infused Products: The Therapeutic Goods Administration (TGA) regulates primary and many secondary sunscreens as listed therapeutic goods requiring an AUST L number, while the Australian Industrial Chemicals Introduction Scheme (AICIS) separately governs cosmetic-sunscreen ingredient introduction. This dual framework raises compliance costs and time-to-market for SPF-infused facial care launches.
- Price Sensitivity Amid Ingredient Cost Inflation: Rising costs of premium and natural actives can pressure margins for mass-market brands, limiting the pace at which lower-income consumer segments trade up to premium facial care formulations.
Market Opportunities
- Indigenous-Botanical Product Innovation: Australia’s unique flora offers a differentiated ingredient story that local and international brands can leverage for both domestic growth and export positioning.
- Male Grooming and Unisex Facial Care Expansion: Growing acceptance of male skincare routines is opening a fast-growing adjacent consumer base for cleansers, moisturizers, and anti-aging products.
Market Challenges
- Import Dependence for Specialty Actives and Packaging: Many advanced actives, functional ingredients, and premium packaging components rely on overseas suppliers, exposing brands to shipping delays and currency-driven cost volatility.
- Retail Channel Fragmentation: Balancing presence across pharmacy chains, department stores, salons, and fast-growing online marketplaces increases distribution complexity for both global and local facial care brands.
Emerging Market Trends
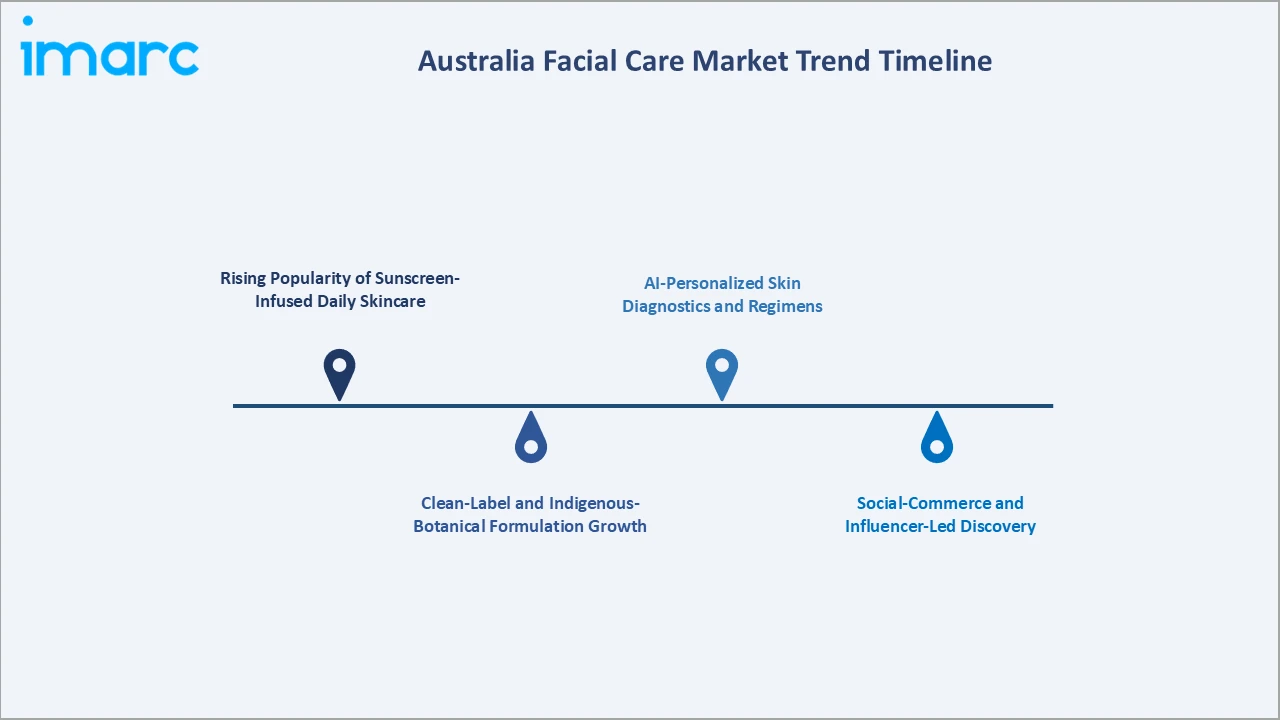
1. Rising Popularity of Sunscreen-Infused Daily Skincare
Sunscreen-infused moisturizers and daily-wear products are becoming mainstream as Australians seek to combine hydration with year-round UV protection in a single step, streamlining routines while addressing the country’s exceptionally high ambient UV levels.
2. Clean-Label and Indigenous-Botanical Formulation Growth
Brands are increasingly formulating with native Australian botanicals and transparent, minimally processed ingredient lists to meet rising consumer scrutiny of product safety and environmental impact.
3. AI-Personalized Skin Diagnostics and Regimens
Retailers and brands are deploying AI-based skin-analysis tools and virtual consultations to recommend tailored facial care regimens, improving conversion and building direct-to-consumer relationships.
4. Social-Commerce and Influencer-Led Discovery
Short-form video content and influencer partnerships are increasingly driving product discovery and trial, particularly for niche and indie facial care brands competing against established multinational portfolios.
5. Subscription and Refill-Based Replenishment Models
Subscription boxes and refillable packaging formats are gaining traction as brands seek to lock in recurring revenue while addressing consumer sustainability expectations around packaging waste.
Industry Value Chain Analysis
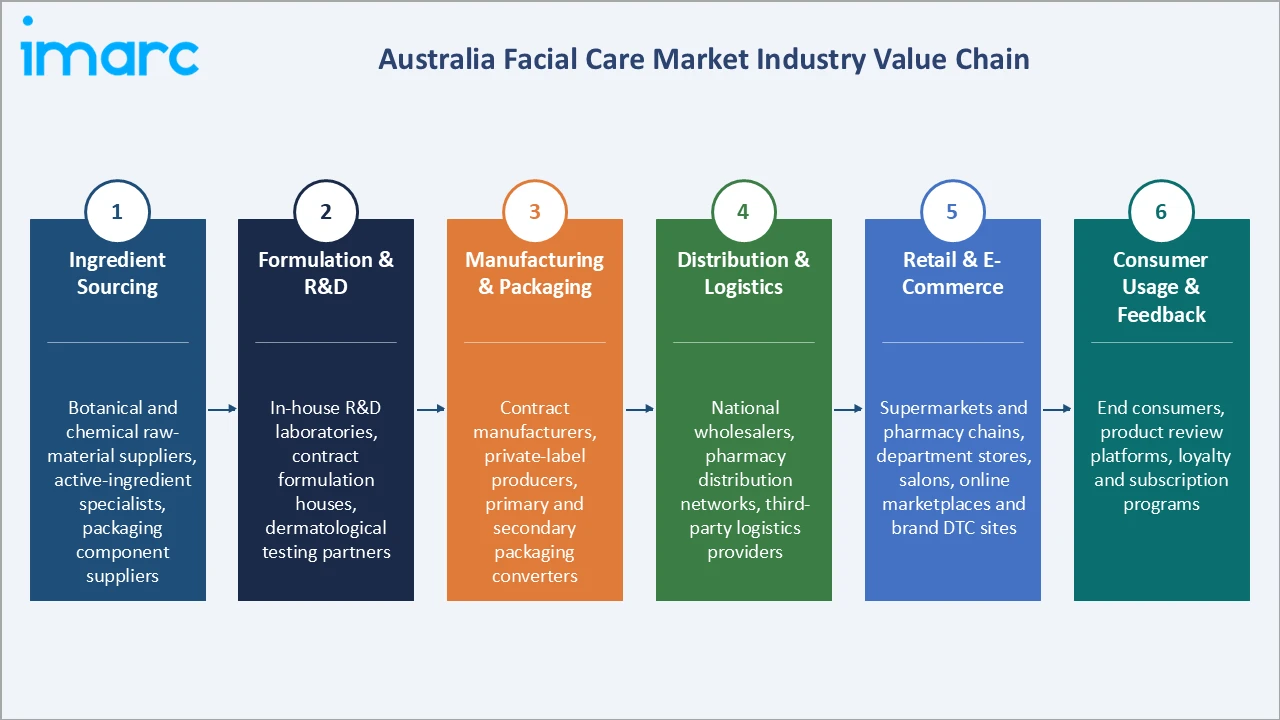
Australia’s facial care value chain integrates ingredient sourcing, formulation and R&D, manufacturing and packaging, distribution and logistics, retail and e-commerce, and post-purchase consumer engagement.
|
Stage |
Key Participants |
|
Ingredient Sourcing |
Botanical and chemical raw-material suppliers, active-ingredient specialists, packaging component suppliers |
|
Formulation & R&D |
In-house R&D laboratories, contract formulation houses, dermatological testing partners |
|
Manufacturing & Packaging |
Contract manufacturers, private-label producers, primary and secondary packaging converters |
|
Distribution & Logistics |
National wholesalers, pharmacy distribution networks, third-party logistics providers |
|
Retail & E-Commerce |
Supermarkets and pharmacy chains, department stores, salons, online marketplaces and brand DTC sites |
|
Consumer Usage & Feedback |
End consumers, product review platforms, loyalty and subscription programs |
The retail and e-commerce stage is Australia’s facial care value chain’s most commercially differentiated phase, given the rapid shift of consumer discovery and purchasing toward digital and social-commerce channels. Ingredient sourcing is the value chain’s fastest-evolving stage as demand for indigenous-botanical and clean-label inputs accelerates.
Technology Landscape in the Australia Facial Care Industry
Advanced Formulation Science
Breakthrough active ingredients, such as epigenetic and barrier-repair actives, are increasingly cascading from premium dermo-cosmetic brands into mass-market facial care, improving efficacy claims around anti-aging and skin-barrier repair across price tiers.
Natural and Clean-Label Sourcing Technology
Advances in cold-extraction and biotechnology-based ingredient production are enabling brands to scale indigenous-botanical formulations without compromising shelf stability or sensory performance, supporting Australia’s growing natural-ingredient segment.
Digital Personalization and AI Diagnostics
AI-powered skin-analysis apps, virtual try-on tools, and data-driven regimen builders are helping brands convert online browsers into buyers while generating first-party data for product development.
Sustainable Packaging Technology
Refillable formats, recycled-content packaging, and reduced-plastic dispensers are becoming standard across both premium and mass facial care lines as brands respond to consumer and regulatory sustainability expectations.
Market Segmentation Analysis
The report covers the following segments:
|
Segment Category |
Leading Segment |
Market Share |
Year |
|
Product Type |
Facial Cleansers |
29.8% |
2025 |
|
Ingredient |
Chemical |
67.4% |
2025 |
|
Gender |
🔒 |
🔒 |
2025 |
|
Distribution Channel |
🔒 |
🔒 |
2025 |
|
Region |
New South Wales |
34.8% |
2025 |

By Product Type
Facial cleansers lead at 29.8% (2025). The cleansers segment serves as the entry point of nearly every skincare routine across all skin types, ages, and genders, sustaining the highest repeat-purchase frequency of any facial care product type. Facial cleansers grow at an estimated ~5.0% CAGR, reflecting steady, routine-driven demand.
To access detailed market analysis, Request Sample
Moisturizers at 25.4% are anchored by daily hydration and SPF-combination formats. Anti-agers at 18.2% grow fastest among product types at ~6.8% CAGR through rising premiumization. Skincare sets at 10.5% benefit from gifting occasions, while face masks at 8.6% grow at ~6.2% CAGR through weekly self-care ritual adoption. Others at 7.5% encompass toners, exfoliators, and facial oils.
By Ingredient
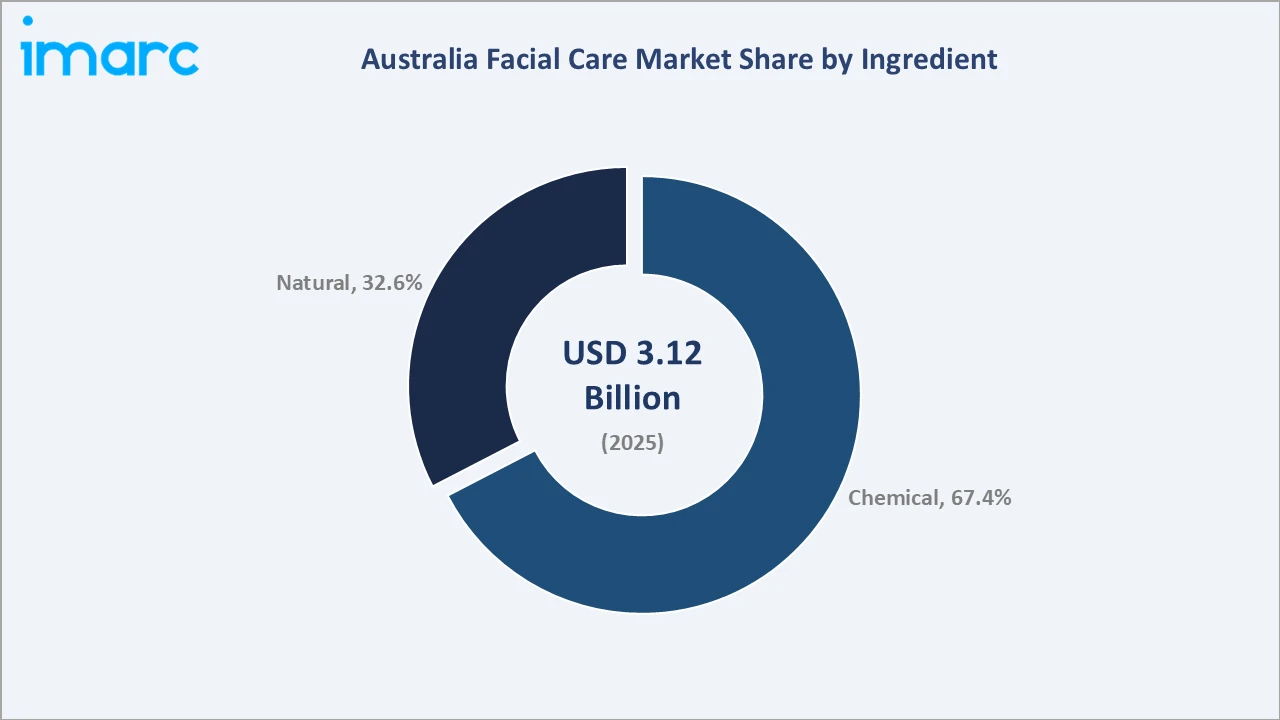
Chemical formulations lead at 67.4% (2025), supported by proven efficacy, established dermatological research, and lower manufacturing costs relative to natural extraction. Natural ingredients account for 32.6% but grow fastest across the market at an estimated ~7.1% CAGR, driven by clean-label demand and indigenous-botanical positioning.
Regional Market Insights
|
Region |
Share (2025) |
Key Australia Facial Care Market Drivers & Characteristics |
|
New South Wales |
34.8% |
Supported by Sydney’s dense pharmacy and department-store retail network, a large concentration of dermatology clinics, and a high-income metropolitan consumer base. |
|
Victoria |
25.2% |
Driven by Melbourne’s strong beauty-retail culture, a large multicultural population, and growing demand for both premium and natural facial care formulations. |
|
Queensland |
18.7% |
Benefits from a sub-tropical to tropical climate with elevated year-round UV exposure, reinforcing consistent demand for sun-protective daily facial care. |
|
Western Australia |
11.4% |
Supported by strong household income levels in Perth and growing e-commerce penetration extending reach into remote and regional communities. |
|
Rest of Australia |
9.9% |
Encompasses Tasmania, South Australia, the Northern Territory, and the Australian Capital Territory, supported by expanding online retail access and rising rural facial care awareness. |
New South Wales’ 34.8% market leadership reflects its position as Australia’s most populous and retail-dense state, providing the commercial depth that sustains the largest single regional facial care market. Victoria’s 25.2% share is reinforced by Melbourne’s strong beauty-retail culture and multicultural consumer base.
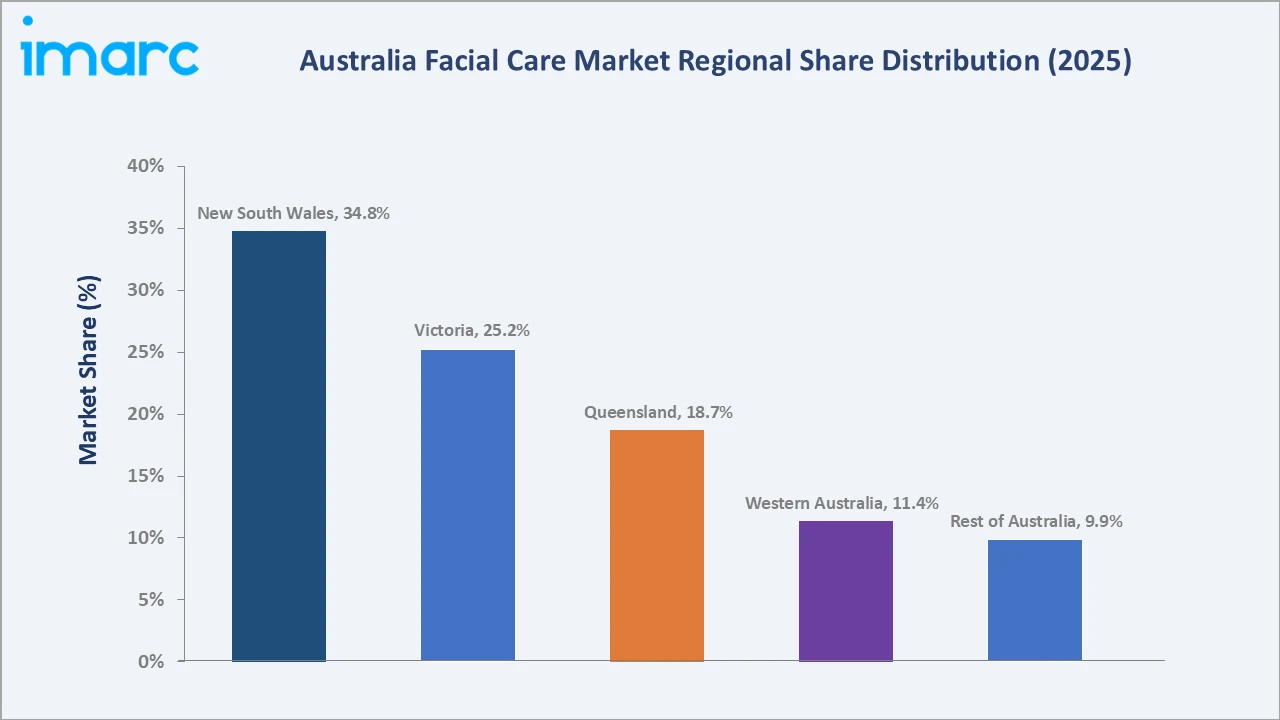
Queensland, at 18.7%, benefits from elevated year-round UV exposure that sustains consistent sun-protective facial care demand. Western Australia’s 11.4% and the Rest of Australia’s combined 9.9% are increasingly supported by expanding e-commerce access that narrows the retail-availability gap with metropolitan centres.
Competitive Landscape
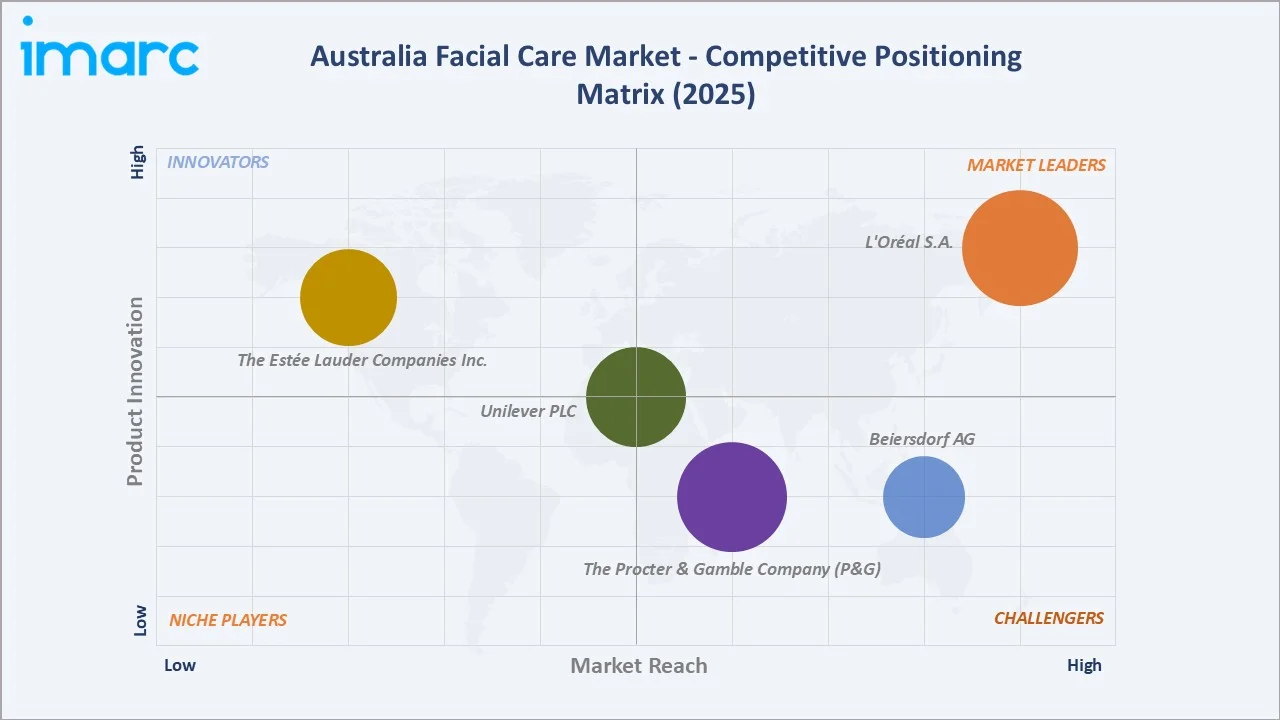
Australia’s facial care market competitive landscape is moderately fragmented, combining global personal-care conglomerates with local and indie natural-skincare brands competing on ingredient authenticity and digital engagement.
|
Company Name |
Brand Names |
Market Position |
Core Strength |
|
L'Oréal S.A. |
L'Oréal Paris, La Roche-Posay, Kiehl's, Garnier |
Market Leader |
A diverse multi-tier brand portfolio, science-backed dermatological innovation, and strategic luxury expansion. |
|
Beiersdorf AG |
NIVEA, La Prairie, Eucerin |
Strong Challenger |
Mass-market brand trust, science-backed product breakthroughs, and localized portfolio adaptability. |
|
The Procter & Gamble Company (P&G) |
Olay |
Strong Challenger |
Science-backed product innovation, powerful heritage brand equity, and strong mass-to-premium retail execution. |
|
Unilever PLC |
Dermalogica, Paula's Choice, Dove, Simple |
Established Player |
Trusted everyday household brands, and mass-market retail penetration. |
|
The Estée Lauder Companies Inc. |
Estée Lauder, Clinique, The Ordinary |
Innovator |
Dominant prestige market positioning, science-backed product efficacy, and a robust multi-brand portfolio. |
Multinational personal-care groups hold the largest combined revenue share through scaled distribution and R&D budgets, while independent Australian natural-skincare brands compete on indigenous-ingredient authenticity and social-commerce reach, creating a switching opportunity in premium and natural sub-segments.
Key Company Profiles
L'Oréal S.A.
L'Oréal S.A. is one of the leading personal-care groups active in Australia’s facial care market, serving consumers through mass, premium, and dermo-cosmetic brand portfolios distributed across pharmacy, department-store, and e-commerce channels.
- Key Brands: L'Oréal Paris, La Roche-Posay, Kiehl's, Garnier, and others.
- Strategic Focus: Expanding dermo-cosmetic and premium skincare presence while strengthening digital personalization tools across the Australia-New Zealand cluster, a key contributor to the group’s regional growth.
Beiersdorf AG
Beiersdorf AG serves the Australian market through its NIVEA mass-market and Eucerin dermo-cosmetic brands, offering facial cleansers, moisturizers, and anti-aging serums positioned across accessible and premium price tiers.
- Key Brands: NIVEA, La Prairie, Eucerin, and others.
- Strategic Focus: Rebalancing brand investment across face care, body care, and deodorants while cascading dermo-cosmetic innovation into accessible mass-market facial care propositions.
Unilever PLC
Unilever PLC maintains a broad facial care presence in Australia through mass-market brands distributed extensively across supermarkets, pharmacy chains, and online retail platforms.
- Key Brands: Dermalogica, Paula's Choice, Dove, Simple, and others.
- Strategic Focus: Strengthening value-tier accessibility and sustainable packaging commitments while expanding e-commerce and social-commerce distribution reach.
Market Concentration Analysis
Australia’s facial care market is moderately concentrated, with the leading multinational personal-care groups collectively accounting for a substantial share of category revenue through scaled distribution and marketing budgets. Concentration is somewhat offset by a growing base of independent Australian natural-skincare brands that compete effectively on ingredient authenticity, sustainability credentials, and social-commerce reach, particularly within the fast-growing natural-ingredient and premium anti-aging sub-segments. Consolidation activity, including strategic investments by global groups into dermatology and specialty skincare assets, is expected to continue shaping competitive intensity through the forecast period.
Investment & Growth Opportunities
Highest Growth Segments
Natural ingredients (~7.1% CAGR), anti-agers (~6.8% CAGR), face masks (~6.2% CAGR), skincare sets (~5.9% CAGR), and the New South Wales and Victoria regional markets represent the highest-growth investment vectors in Australia’s facial care market through 2034.
Emerging Investment Opportunities
Indigenous-botanical ingredient supply chains represent a commercially transformative long-term opportunity, as brands establishing sourcing and certification capability for native Australian actives ahead of mainstream demand scale-up can capture first-mover positioning in both domestic and export-oriented premium skincare.
Investment Themes
- Indigenous-botanical sourcing and certification for the 2026-2034 premiumization cycle: Establishing sustainable sourcing partnerships for native Australian ingredients positions brands to capture premium natural-segment revenue ahead of broader market adoption.
- AI-personalization platform investment for direct-to-consumer growth: Building proprietary skin-diagnostic and personalization technology creates a recurring engagement model that strengthens customer retention above traditional single-transaction retail relationships.
Future Market Outlook (2026-2034)
Australia’s facial care market is projected to grow from USD 3.12 Billion in 2025 to USD 5.19 Billion by 2034, delivering a 5.66% CAGR over the forecast period. The market’s anchor value of USD 4.11 Billion in 2030 represents a mid-cycle inflection where natural-ingredient and AI-personalized offerings are expected to have scaled from early adoption to mainstream retail presence across major Australian retailers.
Three structural forces underpin this growth trajectory with strong confidence. Australia’s persistently high UV exposure creates structural, non-cyclical demand for sun-protective daily facial care that is resistant to broader consumer-spending fluctuations. The clean-label and indigenous-botanical movement is culturally embedded and commercially compelling at Australian scale. Digital personalization and social-commerce adoption are structurally reshaping discovery and purchase behaviour, favouring brands that invest early in direct-to-consumer digital capability.
Research Methodology
Primary Research
Primary research comprised structured interviews with industry stakeholders including brand marketing directors, dermatology and regulatory affairs specialists, retail category managers, and distribution channel partners across Australia.
Secondary Research
Secondary research encompassed publications and data from the Therapeutic Goods Administration, the Australian Industrial Chemicals Introduction Scheme, the Australian Radiation Protection and Nuclear Safety Agency, the Australian Bureau of Statistics, Cancer Council Australia, company annual reports, and industry association publications.
Forecasting Models
Market revenue forecasts were developed using a bottom-up segmentation model: product-type demand calibrated to historical retail sales patterns, ingredient-mix trends adjusted for clean-label adoption curves, and regional forecasts based on population, income, and UV-exposure-linked consumption patterns across Australian states and territories.
Report Coverage:
| Report Features | Details |
|---|---|
| Base Year of the Analysis | 2025 |
| Historical Period | 2020-2025 |
| Forecast Period | 2026-2034 |
| Units | Billion USD |
| Scope of the Report | Exploration of Historical Trends and Market Outlook, Industry Catalysts and Challenges, Segment-Wise Historical and Future Market Assessment:
|
| Product Types Covered | Facial Cleansers, Moisturizers, Anti-Agers, Skincare Sets, Face Masks, Others |
| Ingredients Covered | Chemical, Natural |
| Genders Covered | Male, Female, Unisex |
| Distribution Channels Covered | Supermarkets and Hypermarkets, Beauty Parlors and Salons, Multi Branded Retail Stores, Online, Exclusive Retail Stores, Others |
| Regions Covered | Western Australia, New South Wales, Queensland, Victoria, Rest of Australia |
| Companies Covered | L'Oréal S.A., Beiersdorf AG, The Procter & Gamble Company (P&G), Unilever PLC, The Estée Lauder Companies Inc., etc. |
| Customization Scope | 10% Free Customization |
| Post-Sale Analyst Support | 10-12 Weeks |
| Delivery Format | PDF and Excel through Email (We can also provide the editable version of the report in PPT/Word format on special request) |
Key Benefits for Stakeholders:
- IMARC’s report offers a comprehensive quantitative analysis of various market segments, historical and current market trends, market forecasts, and dynamics of the Australia facial care market from 2020-2034.
- The research study provides the latest information on the market drivers, challenges, and opportunities in the Australia facial care market.
- The study maps the leading, as well as the fastest-growing, regional markets.
- Porter's five forces analysis assist stakeholders in assessing the impact of new entrants, competitive rivalry, supplier power, buyer power, and the threat of substitution. It helps stakeholders to analyze the level of competition within the Australia facial care industry and its attractiveness.
- Competitive landscape allows stakeholders to understand their competitive environment and provides an insight into the current positions of key players in the market.
Frequently Asked Questions About the Australia Facial Care Market Report
The Australia facial care market reached USD 3.12 Billion in 2025, driven by high UV exposure, rising natural-ingredient demand, and expanding digital retail channels across the country.
The market is projected to grow at a CAGR of 5.66% during 2026-2034, reaching USD 5.19 Billion by 2034 as natural and premium anti-aging segments outpace category averages.
The market is expected to reach USD 5.19 Billion by 2034, supported by an anchor value of USD 4.11 Billion in 2030 as digital personalization and clean-label adoption scale further.
Facial cleansers lead at 29.8% share in 2025, reflecting their role as a daily-routine staple purchased repeatedly across all skin types, ages, and genders nationwide.
Chemical-based formulations lead at 67.4% share in 2025, supported by proven efficacy and lower manufacturing costs, though natural ingredients are the fastest-growing segment.
New South Wales leads at 34.8% share in 2025, supported by Sydney’s dense retail infrastructure, dermatology clinics, and large, affluent metropolitan consumer base.
Australia’s exceptionally high UV exposure, rising demand for natural and locally produced skincare, and growing digital engagement and personalization are the primary growth drivers.
Sunscreen-infused daily skincare, clean-label and indigenous-botanical formulations, AI-personalized diagnostics, social-commerce discovery, and subscription-based replenishment models are reshaping the category.
Leading companies include L'Oréal S.A., Beiersdorf AG, The Procter & Gamble Company (P&G), Unilever PLC, and The Estée Lauder Companies Inc., among other established personal-care groups.
Australia’s exceptionally high ambient UV levels, among the highest globally per ARPANSA, sustain year-round demand for SPF-infused facial moisturizers and after-sun repair products.
Need more help?
- Speak to our experienced analysts for insights on the current market scenarios.
- Include additional segments and countries to customize the report as per your requirement.
- Gain an unparalleled competitive advantage in your domain by understanding how to utilize the report and positively impacting your operations and revenue.
- For further assistance, please connect with our analysts.
 Request Customization
 Speak to an Analyst
 Request Brochure
 Inquire Before Buying
Benefits of Customization
- Personalize this research
- Triangulate with your data
- Get data as per your format and definition
- Gain a deeper dive into a specific application, geography, customer, or competitor
- Any level of personalization
Get in Touch With Us
UNITED STATES
Phone: +1-201-971-6302
INDIA
Phone: +91-120-433-0800
UNITED KINGDOM
Phone: +44-753-714-6104
Email: [email protected]
Client Testimonials




.webp)




.webp)













Related Reports

Choose your plan
*Please note that the prices mentioned below are starting prices for each bundle type. Kindly contact our team for further details.*
Single User License
- 1 User License, Access on 2 Devices
- PDF Report + Excel Dataset (Password Protected)
- Lifetime Access
- No Printing Rights
- 10% Free Report Customization
- 10–12 Weeks of Analyst Support
Five User License
- Access for 5 Users, 2 Devices per User
- PDF Report + Excel Dataset (Password Protected)
- Lifetime Access
- Dedicated Account Manager
- 12–14 Weeks of Analyst Support
- No Printing Rights
- 15% Free Report Customization
- 25% Discount on Your Next Purchase
Corporate User License
- Unlimited User Access (Within Your Organization)
- PDF Report + Excel Dataset
- Lifetime Access
- Dedicated Account Manager
- 14–20 Weeks of Analyst Support
- No Printing Rights
- 20% Free Report Customization
- 30% Discount on Your Next Purchase
Essential Insights
What's included:
3 reports
- Lifetime Access
- PDF Reports
- Excel Datasets
- 2 Weeks of Free Analyst Support
- 2 User Licenses
- Access on 2 Devices
- Printing Rights
- Complimentary PowerPoint (PPT) Version
- Complimentary License Upgrade
Professional Access
What's included:
5 reports
- Lifetime Access
- PDF Reports
- Excel Datasets
- 8 Weeks of Free Analyst Support
- 2 User Licenses
- Access on 2 Devices
- Printing Rights
- Complimentary PowerPoint (PPT) Version
- Complimentary License Upgrade
Business Advantage
What's included:
8 reports
- Lifetime Access
- PDF Reports
- Excel Datasets
- 14 Weeks of Free Analyst Support
- 2 User Licenses
- Access on 2 Devices
- Printing Rights
- Complimentary PowerPoint (PPT) Version
- Complimentary License Upgrade
Enterprise Intelligence
What's included:
10 reports
- Lifetime Access
- PDF Reports
- Excel Datasets
- 20 Weeks of Free Analyst Support
- 2 User Licenses
- Access on 2 Devices
- Printing Rights
- Complimentary PowerPoint (PPT) Version
- Complimentary License Upgrade