
Australia Floating Solar Farms Market Size, Share, Trends and Forecast by Location, Capacity, Size, Connectivity, Application, and Region, 2026-2034
Australia Floating Solar Farms Market Overview:
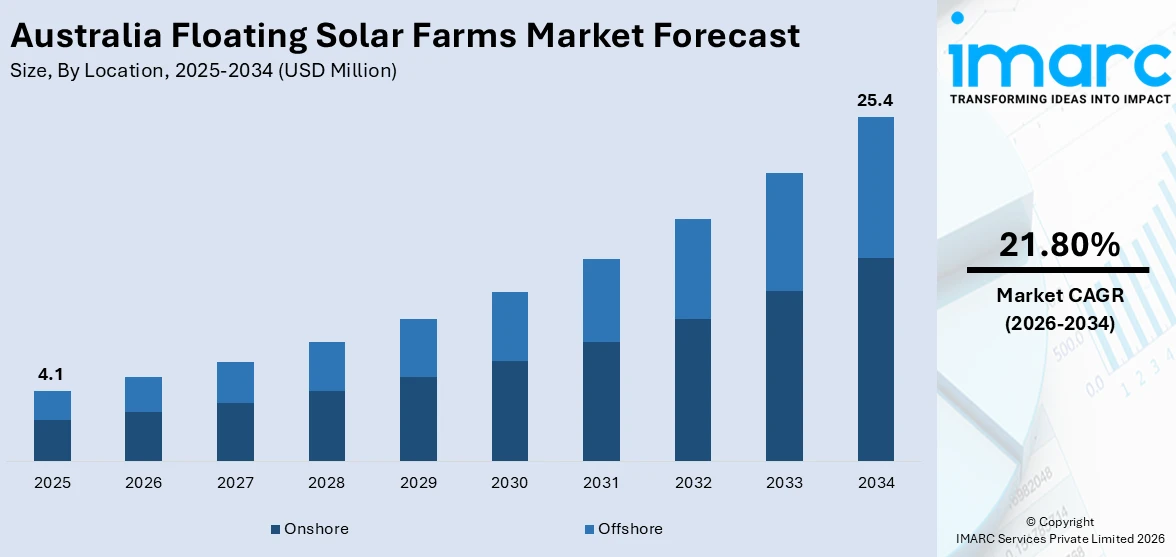
The Australia floating solar farms market size reached USD 4.1 Million in 2025. Looking forward, IMARC Group expects the market to reach USD 25.4 Million by 2034, exhibiting a growth rate (CAGR) of 21.80% during 2026-2034. The market is expanding due to strong government policies, renewable energy targets, and incentives such as ARENA funding. Technological advancements are improving efficiency and reducing costs, while the dual benefits of energy generation and water conservation enhance appeal. Growing demand for sustainable energy, coupled with land scarcity and high solar potential, is further expanding the Australia floating solar market share.
|
Report Attribute
|
Key Statistics
|
|---|---|
|
Base Year
|
2025
|
|
Forecast Years
|
2026-2034
|
|
Historical Years
|
2020-2025
|
| Market Size in 2025 | USD 4.1 Million |
| Market Forecast in 2034 | USD 25.4 Million |
| Market Growth Rate 2026-2034 | 21.80% |
Australia Floating Solar Farms Market Trends:
Increasing Government Support and Renewable Energy Targets
The market is experiencing significant growth due to strong government support and ambitious renewable energy targets. Net energy consumption in Australia increased by 2% to 23,294 PJ in 2022–23, and renewable energy generation increased to 325 PJ (33% of electricity generation). This growth was dominated by solar energy, which climbed 21% to 151 PJ, and reflects the growing solar panel sector. As household energy consumption rose by 3% and solar energy continued to expand, the demand for solar solutions in Australia remains robust. Federal and state governments are actively promoting clean energy initiatives, including incentives for floating solar projects, which help reduce land-use conflicts and enhance water conservation. Programs such as the Australian Renewable Energy Agency (ARENA) and state-level grants are accelerating investments in floating photovoltaic (FPV) systems. Additionally, Australia’s commitment to achieving 82% renewable energy by 2030 is driving utility-scale floating solar deployments, particularly in water reservoirs and hydropower dams. The technology’s dual benefits—energy generation and reduced water evaporation—make it an attractive solution for drought-prone regions. As policies continue to favor sustainable energy, the floating solar sector is poised for rapid expansion, with several large-scale projects already in development across New South Wales, Queensland, and Victoria.
To get more information on this market Request Sample
Technological Advancements and Cost Efficiency
Advancements in floating solar technology and declining costs are propelling the Australia floating solar farm market growth. Improved solar panel durability, anti-corrosion materials, and modular designs are enhancing system efficiency and lifespan, making FPV more viable for harsh Australian conditions. Innovations in anchoring systems and floating structures are reducing installation and maintenance costs, further escalating adoption. Additionally, the integration of floating solar with existing hydropower infrastructure maximizes energy output and grid stability. As economies of scale lower overall project costs, developers are increasingly exploring hybrid renewable systems combining floating solar with wind or battery storage. Australia installed 28,262 solar batteries in 2024, up 4.9% from 2023. This increases the total of hybrid systems to 121,551, or 3% of all solar energy users. New South Wales, Victoria, and South Australia lead the charge, underpinned by state rebate programs. Solar-plus-storage systems are emerging as a major piece of Australia’s shift to clean energy as growth persists. With Australia’s abundant water bodies and high solar irradiance, the declining Levelized Cost of Energy (LCOE) for floating solar positions it as a competitive alternative to traditional ground-mounted solar farms, driving long-term market growth.
Australia Floating Solar Farms Market Segmentation:
IMARC Group provides an analysis of the key trends in each segment of the market, along with forecasts at the country and regional levels for 2026-2034. Our report has categorized the market based on location, capacity, size, connectivity, and application.
Location Insights:
- Onshore
- Offshore
The report has provided a detailed breakup and analysis of the market based on the location. This includes onshore and offshore.
Capacity Insights:
- Up to 1MW
- 1MW - 5MW
- Above 5MW
A detailed breakup and analysis of the market based on the capacity have also been provided in the report. This includes up to 1MW, 1MW - 5MW, and above 5MW.
Size Insights:
- Utility Scale
- Community
The report has provided a detailed breakup and analysis of the market based on the size. This includes utility scale and community.
Connectivity Insights:
- On grid
- Off grid
A detailed breakup and analysis of the market based on the connectivity have also been provided in the report. This includes on grid and off grid.
Application Insights:
Access the comprehensive market breakdown Request Sample
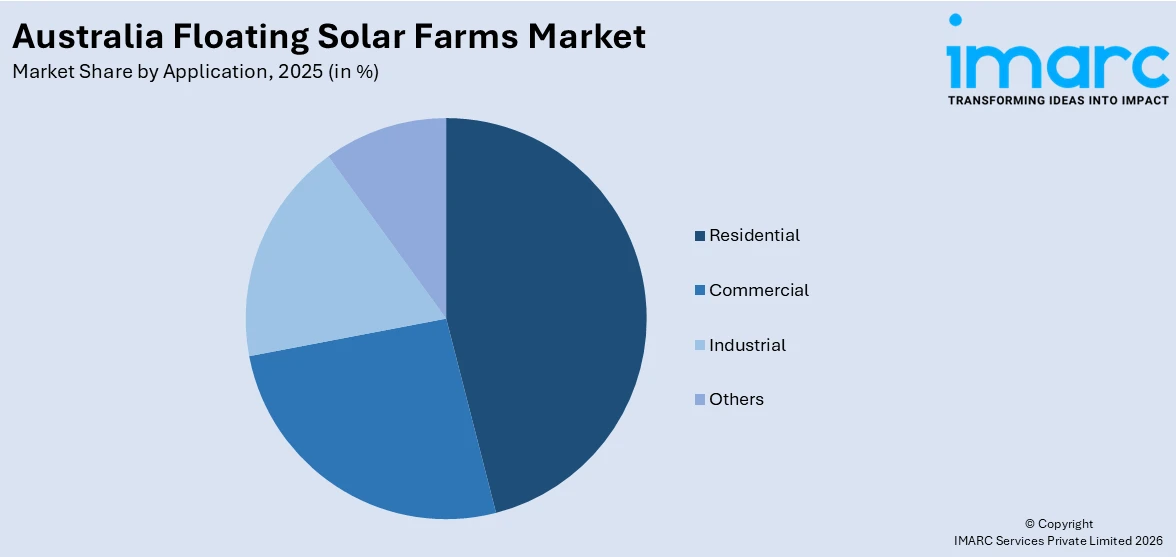
- Residential
- Commercial
- Industrial
- Others
The report has provided a detailed breakup and analysis of the market based on the application. This includes residential, commercial, industrial, and others.
Regional Insights:
- Australia Capital Territory & New South Wales
- Victoria & Tasmania
- Queensland
- Northern Territory & Southern Australia
- Western Australia
The report has also provided a comprehensive analysis of all the major regional markets, which include Australia Capital Territory & New South Wales, Victoria & Tasmania, Queensland, Northern Territory & Southern Australia, and Western Australia.
Competitive Landscape:
The market research report has also provided a comprehensive analysis of the competitive landscape. Competitive analysis such as market structure, key player positioning, top winning strategies, competitive dashboard, and company evaluation quadrant has been covered in the report. Also, detailed profiles of all major companies have been provided.
Australia Floating Solar Farms Market News:
- February 03, 2005, Canopy Power Australia and Ocean Sun launched a 700kWp circular floating solar solution that features a 70-meter membrane-based platform, which can harvest millions of liters of rainwater per annum. The system is meant to address land and water shortage challenges by efficiently reducing evaporation and algae growth while facilitating easy deployment for greater energy and water sustainability. This development makes solar farms floating an imperative part in making Australia's switch to green energy and cost-efficient water management resources.
Australia Floating Solar Farms Market Report Coverage:
| Report Features | Details |
|---|---|
| Base Year of the Analysis | 2025 |
| Historical Period | 2020-2025 |
| Forecast Period | 2026-2034 |
| Units | Million USD |
| Scope of the Report |
Exploration of Historical Trends and Market Outlook, Industry Catalysts and Challenges, Segment-Wise Historical and Future Market Assessment:
|
| Locations Covered | Onshore, Offshore |
| Capacities Covered | Up to 1MW, 1MW - 5MW, Above 5MW |
| Sizes Covered | Utility Scale, Community |
| Connectivities Covered | On grid, Off grid |
| Applications Covered | Residential, Commercial, Industrial, Others |
| Regions Covered | Australia Capital Territory & New South Wales, Victoria & Tasmania, Queensland, Northern Territory & Southern Australia, Western Australia |
| Customization Scope | 10% Free Customization |
| Post-Sale Analyst Support | 10-12 Weeks |
| Delivery Format | PDF and Excel through Email (We can also provide the editable version of the report in PPT/Word format on special request) |
Key Questions Answered in This Report:
- How has the Australia floating solar farms market performed so far and how will it perform in the coming years?
- What is the breakup of the Australia floating solar farms market on the basis of location?
- What is the breakup of the Australia floating solar farms market on the basis of capacity?
- What is the breakup of the Australia floating solar farms market on the basis of size?
- What is the breakup of the Australia floating solar farms market on the basis of connectivity?
- What is the breakup of the Australia floating solar farms market on the basis of application?
- What is the breakup of the Australia floating solar farms market on the basis of region?
- What are the various stages in the value chain of the Australia floating solar farms market?
- What are the key driving factors and challenges in the Australia floating solar farms?
- What is the structure of the Australia floating solar farms market and who are the key players?
- What is the degree of competition in the Australia floating solar farms market?
Key Benefits for Stakeholders:
- IMARC’s industry report offers a comprehensive quantitative analysis of various market segments, historical and current market trends, market forecasts, and dynamics of the Australia floating solar farms market from 2020-2034.
- The research report provides the latest information on the market drivers, challenges, and opportunities in the Australia floating solar farms market.
- Porter's five forces analysis assist stakeholders in assessing the impact of new entrants, competitive rivalry, supplier power, buyer power, and the threat of substitution. It helps stakeholders to analyze the level of competition within the Australia floating solar farms industry and its attractiveness.
- Competitive landscape allows stakeholders to understand their competitive environment and provides an insight into the current positions of key players in the market.
Need more help?
- Speak to our experienced analysts for insights on the current market scenarios.
- Include additional segments and countries to customize the report as per your requirement.
- Gain an unparalleled competitive advantage in your domain by understanding how to utilize the report and positively impacting your operations and revenue.
- For further assistance, please connect with our analysts.
 Request Customization
 Speak to an Analyst
 Request Brochure
 Inquire Before Buying
Benefits of Customization
- Personalize this research
- Triangulate with your data
- Get data as per your format and definition
- Gain a deeper dive into a specific application, geography, customer, or competitor
- Any level of personalization
Get in Touch With Us
UNITED STATES
Phone: +1-201-971-6302
INDIA
Phone: +91-120-433-0800
UNITED KINGDOM
Phone: +44-753-714-6104
Email: [email protected]
Client Testimonials


.webp)


