
Australia Mobility as a Service Market Size, Share, Trends and Forecast by Service Type, Transportation Type, Application Platform, Propulsion Type, and Region, 2026-2034
Australia Mobility as a Service Market Overview:
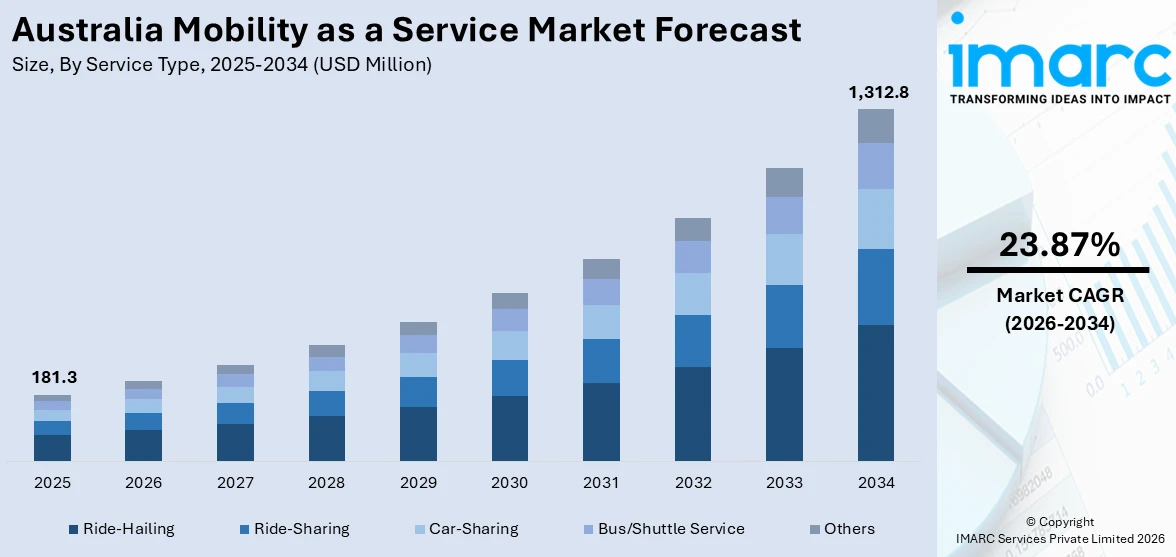
The Australia mobility as a service market size reached USD 181.3 Million in 2025. Looking forward, the market is projected to reach USD 1,312.8 Million by 2034, exhibiting a growth rate (CAGR) of 23.87% during 2026-2034. The implementation of government initiatives promoting sustainable transport, growing demand for integrated mobility solutions, continual advancements in digital platforms, and a shift towards subscription-based transport models, increasing need for urban mobility experiences are some of the major factors driving market expansion.
|
Report Attribute
|
Key Statistics
|
|---|---|
|
Base Year
|
2025 |
|
Forecast Years
|
2026-2034
|
|
Historical Years
|
2020-2025
|
| Market Size in 2025 | USD 181.3 Million |
| Market Forecast in 2034 | USD 1,312.8Million |
| Market Growth Rate 2026-2034 | 23.87% |
Key Trends of Australia Mobility as a Service Market:
Increasing Urbanization Impacting MaaS Adoption
Rapid urbanization in Australia is significantly influencing the Australia mobility as a service market growth. As major cities like Sydney, Melbourne, Brisbane, and Perth continue to experience population growth, there is an escalating demand for efficient, flexible, and scalable transportation solutions that can alleviate congestion, reduce travel times, and enhance overall urban mobility. According to an industry report, the urban population in Australia reached 86.62% of the total population in the country as of 2023. The growing urban population places immense pressure on existing transport infrastructure, prompting governments and city planners to adopt MaaS platforms as strategic tools to manage urban transit challenges. MaaS offers an effective alternative to traditional car ownership by integrating multiple modes of transport, such as public transit, ride-sharing, micro-mobility, and active transport, into cohesive, user-friendly platforms. Urban residents are increasingly seeking convenient and reliable mobility options that align with fast-paced city lifestyles and sustainability goals. Furthermore, urban development plans increasingly incorporate smart mobility components, emphasizing data-driven transport systems, last-mile connectivity, and digital ticketing. As cities densify, MaaS solutions are becoming central to ensuring accessible, equitable, and sustainable transport for diverse urban populations.
To get more information on this market Request Sample
Emphasis on Sustainable and Low-Emission Transport Solutions
Environmental sustainability is emerging as a key factor augmenting Australia mobility as a service market share. In line with national climate targets to cut emissions by 43% from 2005 levels by 2030 and achieve Net Zero by 2050, MaaS platforms are increasingly integrating eco-friendly transport options. These include electric buses, e-bikes, and shared electric vehicles, reflecting a broader shift toward low-emission mobility solutions. Notably, electric vehicle adoption in Australia continues to gain momentum, with 85,319 units sold by the end of September 2024. In addition to this, the implementation of government initiatives, including the National Electric Vehicle Strategy, incentivizes the adoption of low-emission technologies and supports infrastructure development like EV charging networks. These efforts align with Australia's commitment to reduce greenhouse gas emissions and meet international climate goals. Additionally, MaaS operators are leveraging carbon footprint calculators, route optimization tools, and sustainability ratings to empower users to make environmentally conscious decisions. This trend also appeals to environmentally aware consumers who prioritize eco-friendly travel options. Furthermore, corporate partnerships with MaaS providers are rising, as companies aim to meet Environmental, Social, and Governance (ESG) standards through employee mobility programs. Also, the push for sustainable transport is reshaping the service offerings and operational models of MaaS platforms across the country. These factors are creating a positive Australia mobility as a service market outlook.
Integration of Multi-Modal Transport
Multimodal integration is one of the main trends shaping the Australia Mobility as a Service (MaaS) market. Passengers are more and more seeking smooth connections among the different transport modes, such as public transport, ride-hailing services, car-sharing, and micro-mobility solutions like e-scooters and bikes. This integrated approach streamlines the commuting process by allowing users to organize, reserve, and pay for entire trips under one digital platform, eliminating the need for multiple apps or tickets. Multi-modal integration increases convenience and maximizes cost effectiveness, making mobility accessible to both regular commuters and occasional travelers. Additionally, it supports sustainability goals by encouraging shared and public use of transport relative to personal vehicles, thus easing congestion and reducing carbon emissions in urban areas.
Growth Drivers of Australia Mobility as a Service Market:
Government Support for Smart Mobility
Government support for smart mobility is an important growth driver in the Australian mobility as a service market. Nationwide and provincial policies are focused on more and more developing sustainable transportation networks and minimizing the use of private cars. The authorities are encouraging the blending of public transport with private mobility solutions to establish seamless and effective transport networks. Investment in digital infrastructure, such as real-time sharing of transport data and smart ticketing, is also critical to further the MaaS platforms. Regulatory frameworks are also being put in place to promote innovation while maintaining safety and accessibility for all users. This active government participation not only speeds up adoption but also boosts confidence in investors and mobility suppliers to ensure long-term expansion and development of the MaaS ecosystem.
Focus on Reducing Carbon Emissions
Addressing carbon emissions is pivotal in influencing Australia mobility as a service market demand. With sustainability gaining prominence, both government and consumers are gravitating toward eco-friendly travel alternatives. MaaS platforms promote the usage of electric vehicles, shared rides, and public transport, aiding in the reduction of traffic congestion and environmental impact. Numerous urban areas are advocating for green mobility initiatives like low-emission zones and incentives for electric vehicle fleets, making the transition to MaaS more appealing. Consumers are becoming increasingly conscious of their carbon footprint, and MaaS offers a convenient way to opt for cleaner travel choices without compromising flexibility. This alignment with environmental objectives positions MaaS as a sustainable alternative to owning a private vehicle in Australia.
Rising Cost of Vehicle Ownership
The increasing cost associated with owning a vehicle is steering Australian consumers toward more adaptable and cost-efficient mobility options. Expenses related to fuel, insurance, parking, and maintenance have consistently risen, making private vehicle ownership less financially viable, especially for those in urban environments. Mobility as a Service (MaaS) presents a compelling alternative by allowing users to access multiple modes of transport on a pay-per-use or subscription basis. This model enables individuals to manage their travel expenditures more effectively while still enjoying convenience and flexibility. Younger generations, in particular, are displaying a declining interest in car ownership and are more likely to embrace shared mobility solutions. As cost concerns intensify, MaaS emerges as a practical, sustainable, and budget-friendly choice, further enhancing its role in transforming urban transportation in Australia.
Opportunities of Australia Mobility as a Service Market:
Growth in Regional and Suburban Areas
The expansion of MaaS solutions into regional and suburban locations represents a considerable opportunity for growth. While major cities in Australia have access to a variety of mobility services, numerous smaller towns and suburban areas still lack adequate options. By extending MaaS platforms to these regions, it is possible to fill the gaps in public transportation and offer residents enhanced commuting flexibility. For those traveling in regional areas, integrated solutions that combine buses, ride-sharing, and micro-mobility alternatives can improve accessibility and lessen dependence on personal vehicles. This growth also fosters local economic development by enhancing connectivity between regional centers and urban areas. By addressing mobility gaps, MaaS providers can attract new user groups and promote more balanced and inclusive transportation networks throughout the nation.
Partnerships with Public Transport Operators
Partnerships with public transport operators are crucial for advancing MaaS adoption across Australia. According to Australia mobility as a service market analysis, the integration of ride-hailing, car-sharing, and micro-mobility options with public buses, trains, and trams facilitates a cohesive travel ecosystem. Unified ticketing and real-time journey planning can improve user experiences, making multi-leg commutes easier and more efficient. These collaborations also support resource optimization, help eliminate service redundancies, and build public confidence in MaaS platforms. By collaborating closely with transport authorities, providers can ensure better coverage and affordability for users, contributing to decreased congestion and emissions. These collaborations are expected to significantly influence the development of sustainable and interconnected transportation in Australia.
Corporate Mobility Solutions
The rising demand for corporate mobility solutions is generating new prospects within the MaaS market. Companies are increasingly looking for flexible commuting options to lessen travel expenses, boost productivity, and meet sustainability objectives. MaaS platforms can offer tailored packages for corporate travel, which may include ride-hailing credits, shuttle services, and integrated expense management tools. These solutions simplify logistics for employers and enhance convenience for employees by minimizing their reliance on personal vehicles. Corporate partnerships can also lead to long-term contracts, providing MaaS providers with consistent revenue streams. As hybrid work models gain traction, customized mobility packages designed for office commutes and business travel are poised to emerge as an appealing and growing segment within Australia’s MaaS landscape.
Challenges of Australia Mobility as a Service Market:
Regulatory and Policy Barriers
Regulatory and policy obstacles continue to pose a significant challenge for the Australia Mobility as a Service (MaaS) market. Each state and territory enforce its own transport regulations, which complicates the development of cohesive solutions nationwide. Divergent policies regarding data sharing, pricing models, and operational approvals hinder the integration efforts between public and private mobility providers. This patchwork of regulations impedes large-scale MaaS rollout and deters both global and local investors. Furthermore, aspects such as insurance mandates, licensing systems, and compliance with safety standards add layers of complexity to operations. Tackling these challenges will require improved cooperation among governments, regulatory authorities, and industry stakeholders to develop a standardized framework that promotes innovation while protecting consumer interests.
High Infrastructure Costs
The high costs associated with infrastructure represent another key hurdle for the Australia MaaS market. Establishing the digital foundation for MaaS platforms encompassing real-time tracking systems, unified payment solutions, and intelligent ticketing options demands substantial financial investment. In addition to digital infrastructure, physical facilities like electric vehicle charging stations, bike-sharing docks, and transport hubs require significant capital outlay. For operators, managing these expenses while maintaining affordable services to attract users proves to be a challenging endeavor. Smaller service providers may find it difficult to grow due to financial limitations, narrowing the competitive environment. Governments and private entities must work together on funding frameworks and public-private partnerships to alleviate investment burdens. Without sustainable financial support, the growth of MaaS adoption and infrastructure development may lag behind the market's potential.
Integration Complexity
Integration complexity is a critical issue facing the Australia Mobility as a Service market. MaaS platforms rely on the effective coordination of various transport modes such as public transit, ride-hailing, bike-sharing, and car rentals within a single user interface. Realizing this goal necessitates aligning different operators, technologies, and business models, which presents technical challenges. Problems like incompatible ticketing systems, disparate data formats, and disagreements over revenue sharing further complicate integration efforts. Developing a platform that guarantees real-time accuracy, transparency, and reliability for users is an intensive resource undertaking. Additionally, operators might be hesitant to share vital data due to competitive concerns. Addressing this complexity will require robust collaboration, standardized protocols, and trust-building among stakeholders, ensuring that MaaS can fulfill the unified travel experience it aims to provide.
Australia Mobility as a Service Market Segmentation:
IMARC Group provides an analysis of the key trends in each segment of the market, along with forecasts at the country and regional levels for 2026-2034. Our report has categorized the market based on service type, transportation type, application platform, and propulsion type.
Service Type Insights:
- Ride-Hailing
- Ride-Sharing
- Car-Sharing
- Bus/Shuttle Service
- Others
The report has provided a detailed breakup and analysis of the market based on the service type. This includes ride-hailing, ride-sharing, car-sharing, bus/shuttle service, and others.
Transportation Type Insights:
- Private
- Public
A detailed breakup and analysis of the market based on the transportation type have also been provided in the report. This includes private and public.
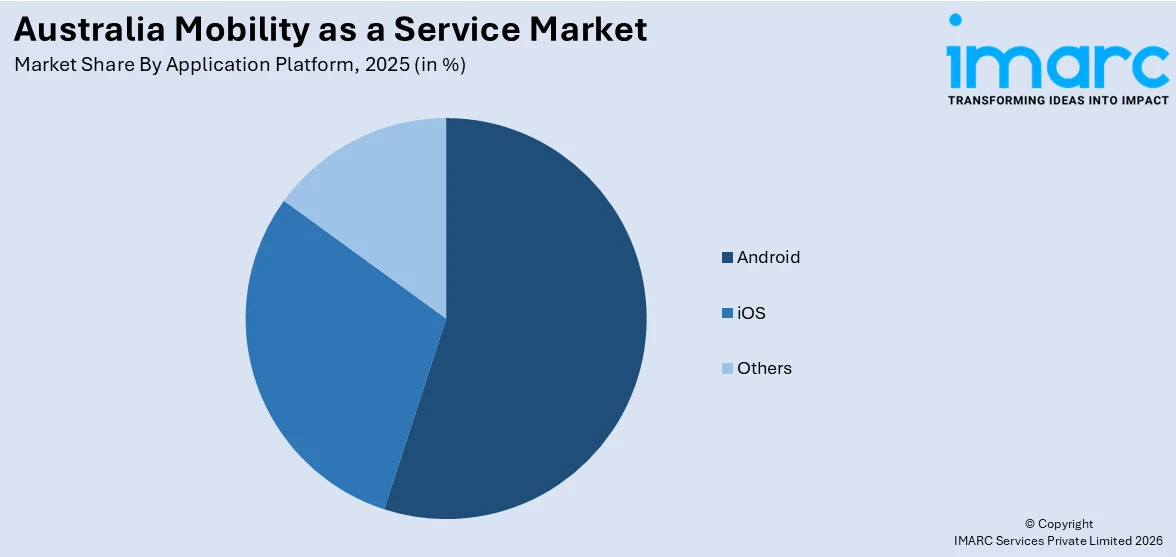
Application Platform Insights:
Access the comprehensive market breakdown Request Sample
- Android
- iOS
- Others
The report has provided a detailed breakup and analysis of the market based on the application platform. This includes android, iOS, and others.
Propulsion Type Insights:
- Electric Vehicle
- Internal Combustion Engine
- Others
A detailed breakup and analysis of the market based on the propulsion type have also been provided in the report. This includes electric vehicle, internal combustion engine, and others.
Regional Insights:
- Australia Capital Territory & New South Wales
- Victoria & Tasmania
- Queensland
- Northern Territory & Southern Australia
- Western Australia
The report has also provided a comprehensive analysis of all the major regional markets, which include Australia Capital Territory & New South Wales, Victoria & Tasmania, Queensland, Northern Territory & Southern Australia, and Western Australia.
Competitive Landscape:
The market research report has also provided a comprehensive analysis of the competitive landscape. Competitive analysis such as market structure, key player positioning, top winning strategies, competitive dashboard, and company evaluation quadrant has been covered in the report. Also, detailed profiles of all major companies have been provided.
Australia Mobility as a Service Market News:
- On November 22, 2024, the Australian Capital Territory (ACT) announced the imminent launch of its new multimodal public transport ticketing system, MyWay+, set to replace the existing MyWay system. The MyWay+ system offers users the convenience of paying for travel through an account or standard mobile methods, enhancing the flexibility and efficiency of public transport fare collection. This initiative reflects the ACT Government's commitment to modernizing its public transport infrastructure and improving user experience.
- On August 2, 2023, the iMOVE Cooperative Research Centre announced a $500,000 investment in the development of the "See Me" app, designed to enhance public transport accessibility for blind and vision-impaired commuters. Developed by legally blind software programmer Cassie Hames of SAGE Automation, the app enables users to notify bus drivers of their presence at stops. It provides real-time alerts for upcoming destinations, thereby improving travel confidence and independence. Following this investment, limited trials of the app are scheduled to commence in South Australia, Queensland, and New South Wales within the year.
Australia Mobility as a Service Market Report Coverage:
| Report Features | Details |
|---|---|
| Base Year of the Analysis | 2025 |
| Historical Period | 2020-2025 |
| Forecast Period | 2026-2034 |
| Units | Million USD |
| Scope of the Report |
Exploration of Historical Trends and Market Outlook, Industry Catalysts and Challenges, Segment-Wise Historical and Future Market Assessment:
|
| Service Types Covered | Ride-Hailing, Ride-Sharing, Car-Sharing, Bus/Shuttle Service, Others |
| Transportation Types Covered | Public, Private |
| Application Platforms Covered | Android, iOS, Others |
| Propulsion Types Covered | Electric Vehicle, Internal Combustion Engine, Others |
| Regions Covered | Australia Capital Territory & New South Wales, Victoria & Tasmania, Queensland, Northern Territory & Southern Australia, Western Australia |
| Customization Scope | 10% Free Customization |
| Post-Sale Analyst Support | 10-12 Weeks |
| Delivery Format | PDF and Excel through Email (We can also provide the editable version of the report in PPT/Word format on special request) |
Key Benefits for Stakeholders:
- IMARC’s industry report offers a comprehensive quantitative analysis of various market segments, historical and current market trends, market forecasts, and dynamics of the Australia mobility as a service market from 2020-2034.
- The research report provides the latest information on the market drivers, challenges, and opportunities in the Australia mobility as a service market.
- Porter's five forces analysis assist stakeholders in assessing the impact of new entrants, competitive rivalry, supplier power, buyer power, and the threat of substitution. It helps stakeholders to analyze the level of competition within the Australia mobility as a service industry and its attractiveness.
- Competitive landscape allows stakeholders to understand their competitive environment and provides an insight into the current positions of key players in the market.
Frequently Asked Questions About the Australia Mobility as a Service Market Report
The mobility as a service market in Australia was valued at USD 181.3 Million in 2025.
The Australia mobility as a service market is projected to exhibit a compound annual growth rate (CAGR) of 23.87% during 2026-2034.
The Australia mobility as a service market is expected to reach a value of USD 1,312.8 Million by 2034.
The Australia mobility as a service market is witnessing trends such as rising adoption of subscription-based travel packages, growing use of AI-driven personalization, expansion of micro-mobility solutions like e-scooters, and greater emphasis on integrating MaaS platforms with smart city initiatives for improved traffic and sustainability outcomes.
Growth in the Australia mobility as a service market is driven by increasing demand for cost-effective alternatives to private car ownership, expansion of digital payment ecosystems, higher consumer focus on convenience and flexibility, and ongoing urban development projects that create opportunities for integrated, technology-enabled mobility solutions across metropolitan and suburban regions.
Need more help?
- Speak to our experienced analysts for insights on the current market scenarios.
- Include additional segments and countries to customize the report as per your requirement.
- Gain an unparalleled competitive advantage in your domain by understanding how to utilize the report and positively impacting your operations and revenue.
- For further assistance, please connect with our analysts.
 Request Customization
 Speak to an Analyst
 Request Brochure
 Inquire Before Buying
Benefits of Customization
- Personalize this research
- Triangulate with your data
- Get data as per your format and definition
- Gain a deeper dive into a specific application, geography, customer, or competitor
- Any level of personalization
Get in Touch With Us
UNITED STATES
Phone: +1-201-971-6302
INDIA
Phone: +91-120-433-0800
UNITED KINGDOM
Phone: +44-753-714-6104
Email: [email protected]
Client Testimonials


.webp)


