
Australia Payments Market Size, Share, Trends and Forecast by Mode of Payment, End Use Industry, and Region, 2026-2034
Australia Payments Market Size, Share, Trends & Forecast (2026-2034)
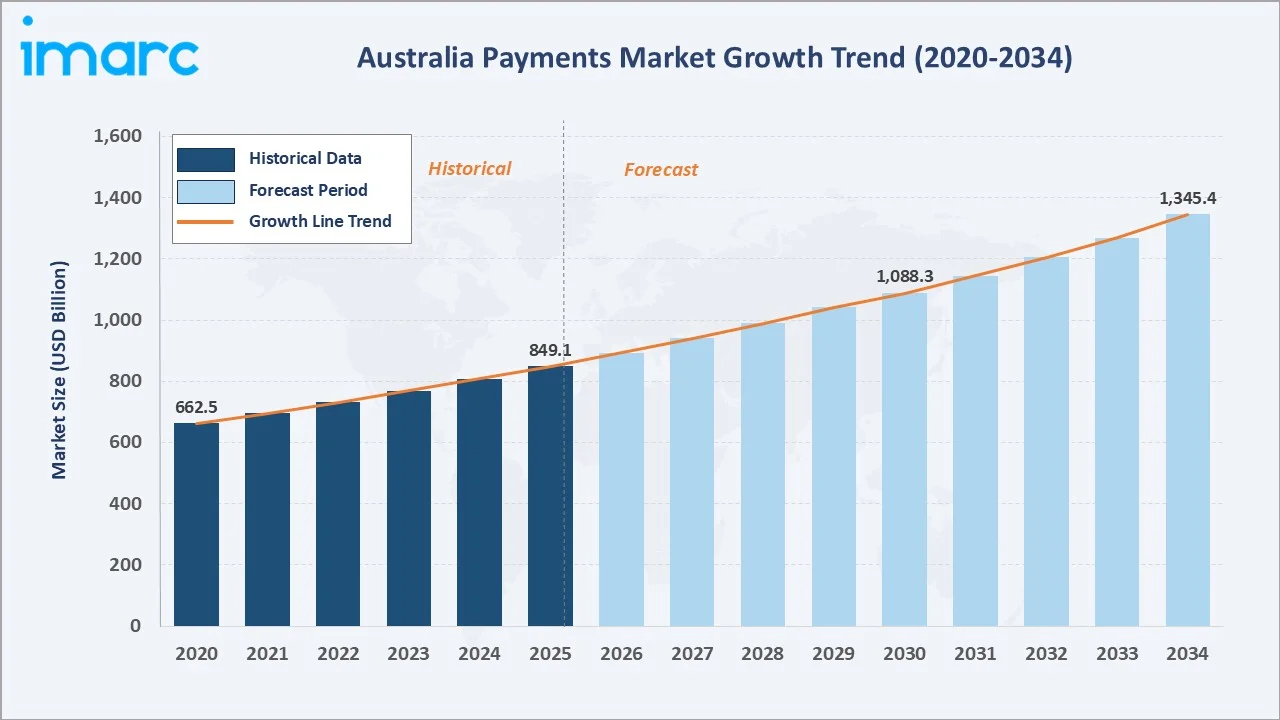
The Australia payments market size reached USD 849.1 Billion in 2025 and is projected to reach USD 1,345.4 Billion by 2034, exhibiting a CAGR of 5.09% during 2026-2034. Digital adoption, mobile wallet proliferation, buy-now-pay-later expansion, and the New Payments Platform (NPP) are primary growth drivers.
Point of sale dominates at 62.4% in 2025, while retail leads end-use at 34.9%, and ACT & New South Wales anchors the regional landscape at 32.8%.
Market Snapshot
|
Metric |
Value |
|
Market Size (2025) |
USD 849.1 Billion |
|
Forecast Market Size (2034) |
USD 1,345.4 Billion |
|
CAGR (2026-2034) |
5.09% |
|
Base Year |
2025 |
|
Historical Period |
2020-2025 |
|
Forecast Period |
2026-2034 |
|
Leading Mode of Payment |
Point of Sale (62.4% share, 2025) |
|
Second Mode of Payment |
Online Sale (37.6% share, 2025) |
|
Leading End Use |
Retail (34.9%, 2025) |
|
Leading Region |
ACT & New South Wales (32.8%, 2025) |
The Australia payments market growth trajectory from 2020 through 2034, with the historical expansion to USD 849.1 Billion in 2025, reflects consistent digital-transformation-driven demand, while the forecast to USD 1,345.4 Billion captures accelerating fintech innovation, open banking rollout, and BNPL penetration across diverse end-use sectors through 2034.
To get more information on this market, Request Sample
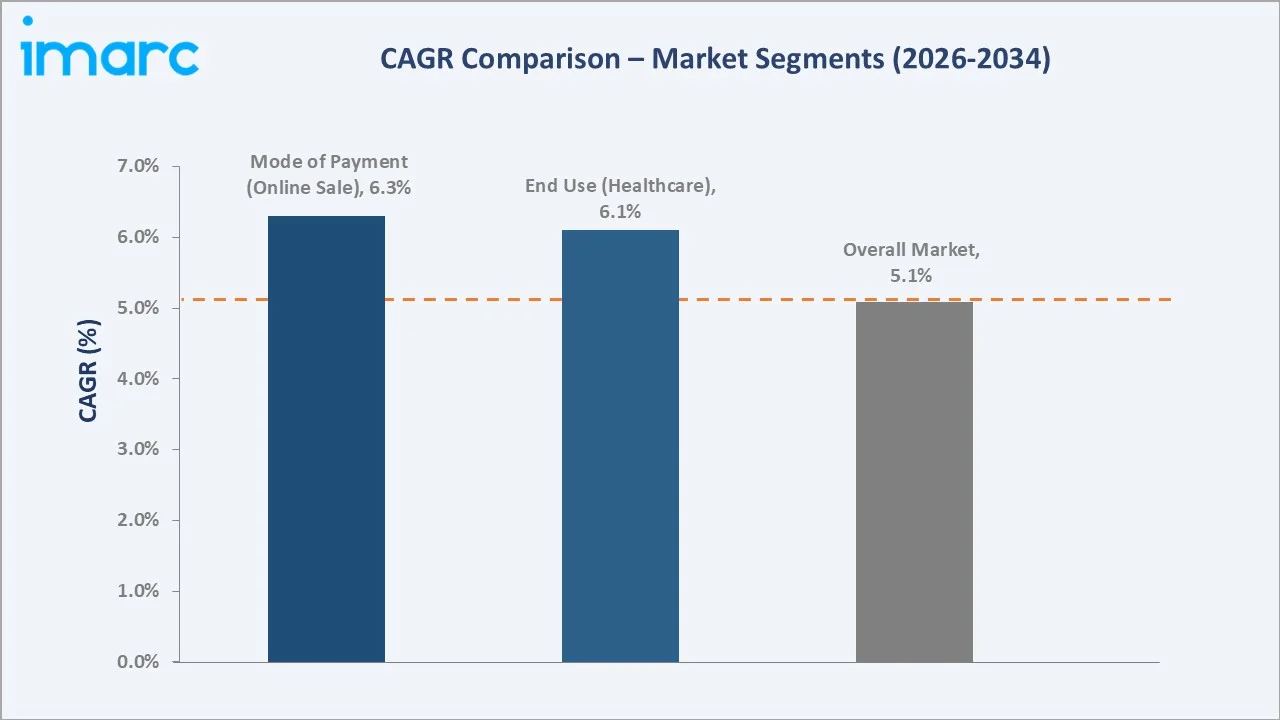
CAGR trajectories across key sub-segments, with online sale at ~6.3% CAGR and healthcare end-use at ~6.1% CAGR, are the fastest-growing categories within the Australia payments industry analysis through 2034.
Executive Summary
The Australia payments market is on a sustained growth trajectory from USD 849.1 Billion in 2025 to USD 1,345.4 Billion by 2034. Payments—encompassing card transactions, digital wallets, BNPL, and real-time transfers—underpin commercial activity across retail, hospitality, healthcare, and entertainment sectors nationwide.
Point of sale dominates at 62.4% in 2025, driven by Australia's near-universal contactless card adoption and mobile wallet integration at merchant terminals. Online sale (37.6%) is growing at a faster CAGR, propelled by e-commerce expansion and seamless checkout innovation.
Retail leads end-use at 34.9% in 2025, reflecting Australia's advanced omni-channel retail ecosystem. Hospitality (21.6%) and entertainment (17.8%) follow, both accelerating in post-pandemic recovery. Healthcare (14.3%) is the fastest-growing end-use on digital health payment adoption and integrated rebate processing.
ACT & New South Wales commands 32.8% in 2025 as Australia's financial and commercial epicentre. Victoria & Tasmania (25.4%) follows, underpinned by Melbourne's fintech hub status. Queensland (19.7%) benefits from tourism and high retail payment volumes.
Key Market Insights
|
Insight |
Data |
|
Largest Mode of Payment |
Point of Sale – 62.4% share (2025) |
|
Fastest-Growing Mode |
Online Sale – 37.6% share; CAGR ~6.3% |
|
Leading End Use |
Retail – 34.9% share (2025) |
|
Fastest End Use |
Healthcare – 14.3% share; CAGR ~6.1% |
|
Leading Region |
ACT & New South Wales – 32.8% (2025) |
|
Second Largest Region |
Victoria & Tasmania – 25.4% (2025) |
|
Key Companies |
Visa, Mastercard, Commonwealth Bank of Australia, Tyro Payments Limited |
Key Analytical Observations Expanding on the Above Data:
- Point of sale dominance at 62.4% reflects Australia's world-leading contactless penetration rate. Nearly all in-person card transactions now support tap-and-go, with mobile wallets surpassing physical card swipes at major metropolitan merchants.
- Online sale at 37.6%, growing faster than the overall market at ~6.3% CAGR, is driven by e-commerce acceleration. Online retail sales exceeded US$82.6 Billion in 2025, up 13.9 percent year-on-year.
- Retail leads end-use at 34.9% because Australia's advanced omni-channel retail ecosystem demands unified payment platforms spanning physical, mobile, and online touchpoints, requiring continuous investment in integrated payment infrastructure.
- ACT & New South Wales at 32.8% reflects Sydney's concentration of major bank headquarters, the Australian Securities Exchange, and fintech companies, generating the nation's highest commercial payment transaction volumes.
Australia Payments Market Overview
The Australia payments market encompasses the full ecosystem of instruments, infrastructure, and participants enabling monetary exchange across consumer and commercial contexts: card networks, digital wallets, BNPL platforms, real-time payment rails, and cross-border remittance services supporting domestic and international transactions.
The ecosystem integrates the Reserve Bank of Australia as regulator, card scheme operators, issuing and acquiring banks, payment processors, fintech disruptors, merchants, and diverse end-use consumers. Digital adoption, regulatory reform, and infrastructure investment are collectively reshaping every layer of the payments value chain.
Market Dynamics
To evaluate market opportunities, Request Sample
Market Drivers
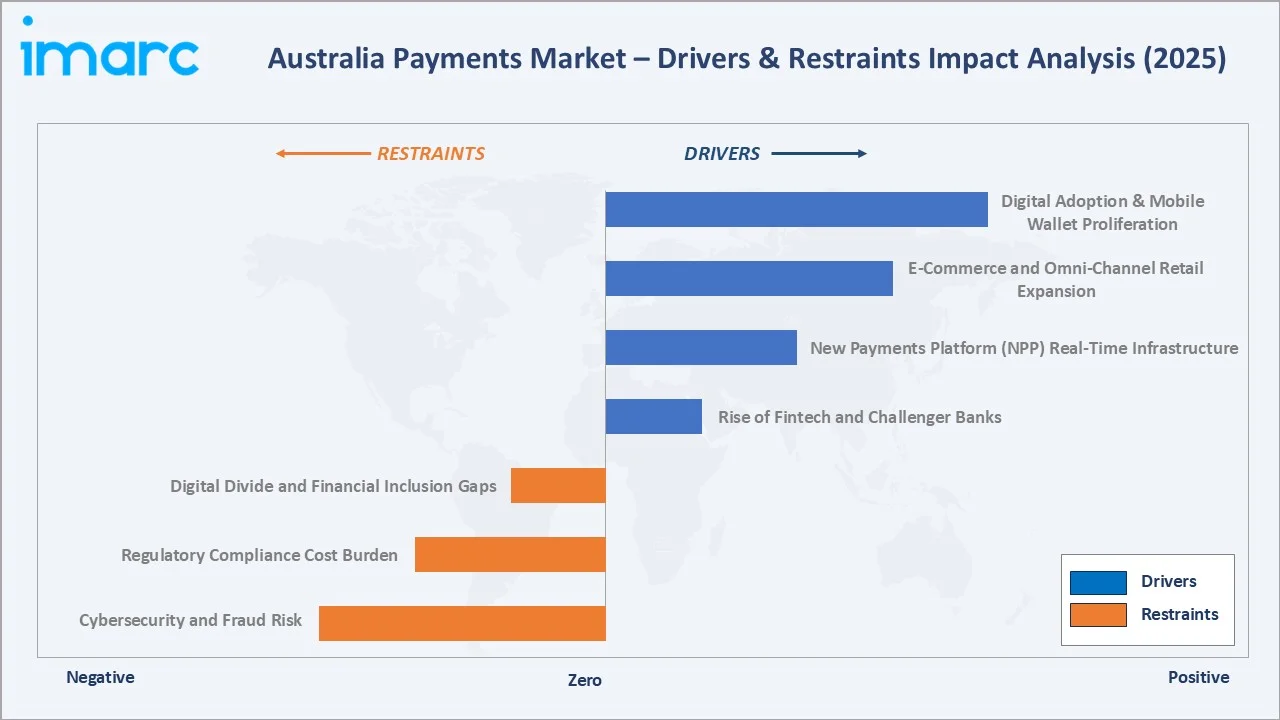
- Digital Adoption and Mobile Wallet Proliferation: In October 2024, Australians executed over 500 million mobile wallet transactions totalling more than USD 20 Billion, evidencing mainstream acceptance of tap-and-go digital payment instruments across all consumer segments.
- E-Commerce and Omni-Channel Retail Expansion: Online retail sales exceeded $82.6 billion in 2025, fueling demand for seamless checkout, integrated payment gateways, and BNPL services that now penetrate 31% of all online transactions.
- New Payments Platform (NPP) Real-Time Infrastructure: NPP processed 1.6 billion transactions worth AUD 1.99 trillion in 2024, enabling instant interbank transfers and PayTo overlay services for subscription and utility billing innovation.
- Rise of Fintech and Challenger Banks: Agile, tech-driven payment firms offering mobile-first, lower-fee solutions are reshaping consumer expectations, compelling traditional banks to accelerate digital transformation and payment technology investment strategies.
Market Restraints
- Cybersecurity and Fraud Risk: As digital payment volumes grow, fraud sophistication escalates. Australian payment fraud losses exceeded US $762 million in 2023, requiring continuous investment in AI-driven detection, tokenisation, and biometric authentication systems.
- Regulatory Compliance Cost Burden: APRA prudential standards, ASIC oversight, and the Payment Systems Regulation Act impose significant compliance burdens, raising operational costs for incumbents and new entrants throughout the Australia payments ecosystem.
- Digital Divide and Financial Inclusion Gaps: Rural and elderly populations remain underserved by digital-only payment solutions, creating adoption barriers and social equity challenges that require inclusive infrastructure design and accessible alternative payment channels.
Market Opportunities
- BNPL and Embedded Finance Growth: Australia's BNPL sector continues expanding into healthcare, travel, and B2B verticals, embedding deferred payment capabilities directly into merchant checkout and enterprise procurement workflows to unlock new revenue streams for providers.
- Cross-Border Payment Expansion: Australia's deep trade relationships with Asia-Pacific partners and growing diaspora remittance flows are generating demand for efficient, transparent, and cost-competitive international payment corridors through bilateral NPP linkages.
Market Challenges
- Interchange Fee Reform and Revenue Pressure: The Reserve Bank of Australia's ongoing review of interchange fees and surcharging rules creates profitability uncertainty for card issuers and acquirers, incentivising shift to lower-cost NPP-based account-to-account payments.
- Legacy System Integration and ISO 20022 Migration: Banks and retailers face significant technical debt migrating core systems to ISO 20022 messaging standards, with mandatory deadlines requiring substantial infrastructure investment and enterprise transformation programs.
Emerging Market Trends
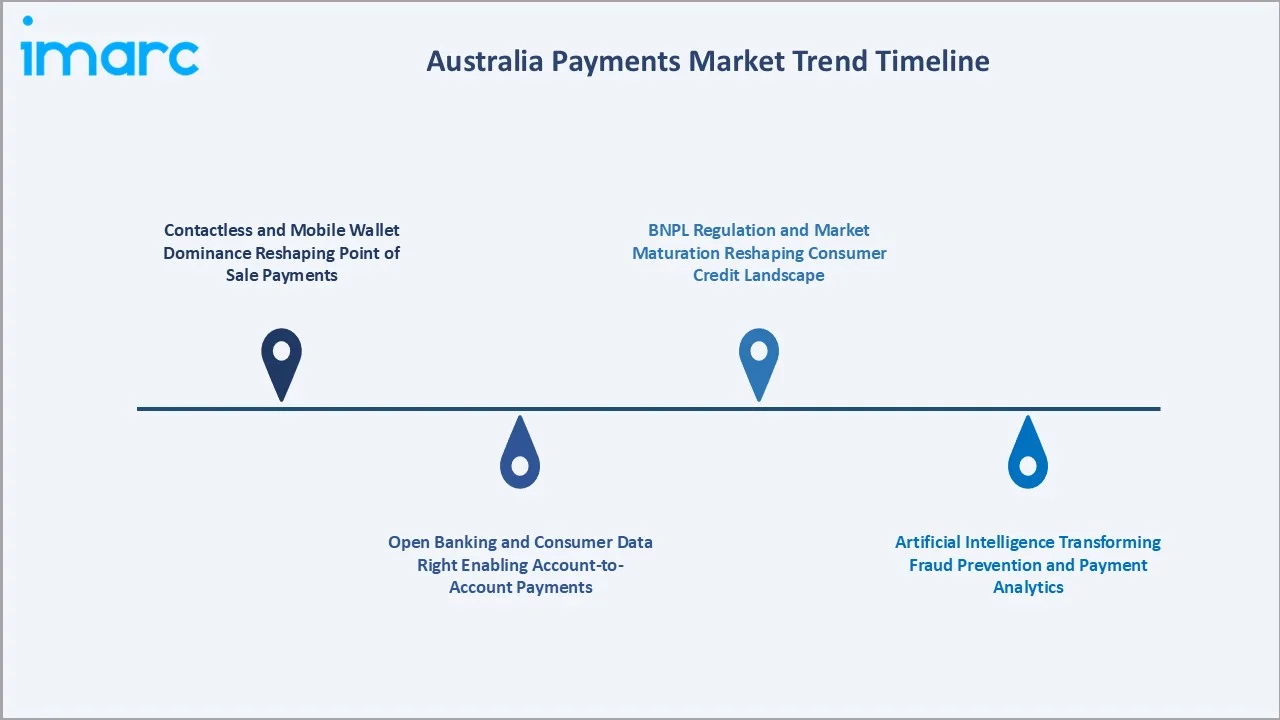
1. Contactless and Mobile Wallet Dominance Reshaping Point of Sale Payments
Australia's contactless payment penetration exceeds 95% of in-person card transactions. Mobile wallet usage via major digital wallet platforms grew over 25% in 2024. Biometric authentication at the point of sale is becoming standard, reducing PIN entry requirements.
2. Open Banking and Consumer Data Right Enabling Account-to-Account Payments
Australia's Consumer Data Right framework enables third-party providers to initiate account-to-account payments, bypassing card interchange and offering lower-cost settlement for merchants. PayTo overlay services are scaling rapidly on NPP rails throughout 2026 and beyond.
3. Artificial Intelligence Transforming Fraud Prevention and Payment Analytics
Financial institutions deploy machine learning models analysing transaction patterns in real time, achieving fraud detection rates exceeding 95% accuracy while minimising false positives. AI-driven decisioning enables seamless user experiences across digital payment channels.
4. BNPL Regulation and Market Maturation Reshaping Consumer Credit Landscape
Australia's new BNPL regulations—requiring responsible lending assessments—are accelerating market consolidation as smaller providers exit and larger platforms integrate BNPL directly into banking super-apps and merchant checkout ecosystems for broader consumer reach.
Industry Value Chain Analysis
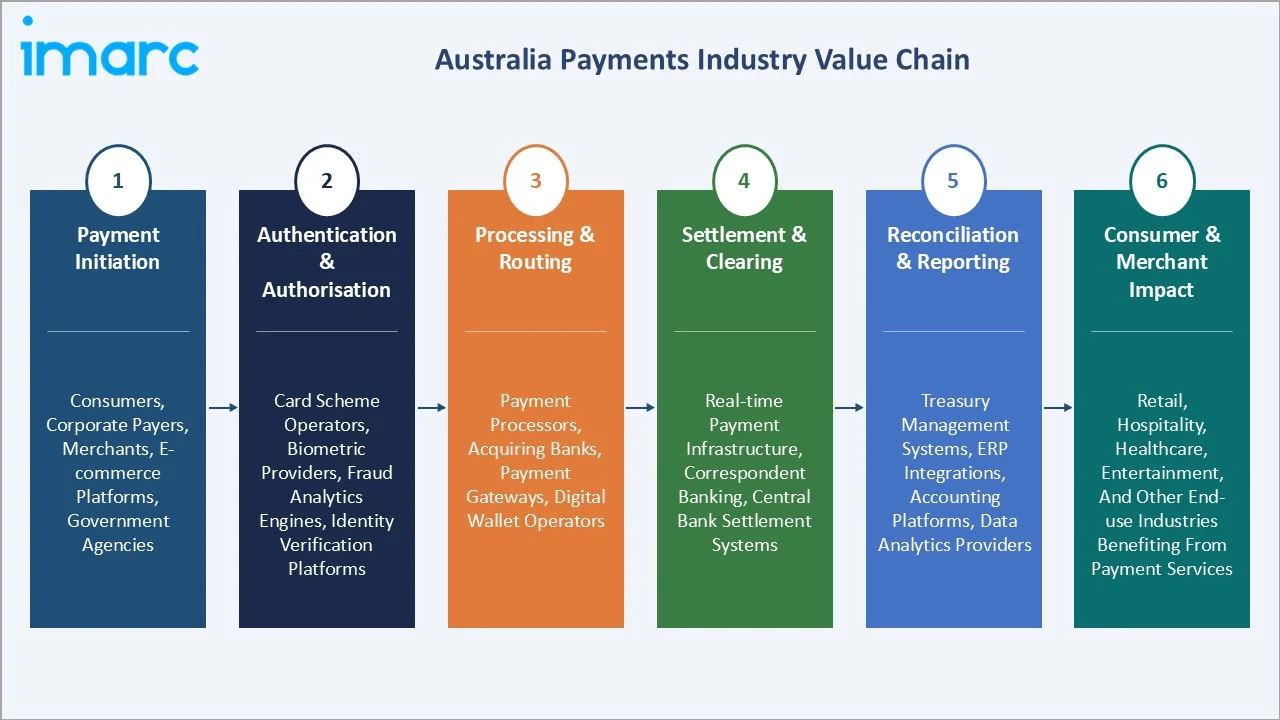
The Australia payments value chain spans six stages from payment initiation through consumer and merchant impact. Processing, authentication, and settlement layers capture the highest value-add margins, while real-time NPP infrastructure is compressing clearing cycles from days to seconds and enabling new overlay payment services.
|
Stage |
Key Participants / Activities |
|
Payment Initiation |
Consumers, corporate payers, merchants, e-commerce platforms, government agencies |
|
Authentication & Authorisation |
Card scheme operators, biometric providers, fraud analytics engines, identity verification platforms |
|
Processing & Routing |
Payment processors, acquiring banks, payment gateways, digital wallet operators |
|
Settlement & Clearing |
Real-time payment infrastructure, correspondent banking networks, central bank settlement systems |
|
Reconciliation & Reporting |
Treasury management systems, ERP integrations, accounting platforms, data analytics providers |
|
Consumer & Merchant Impact |
Retail, hospitality, healthcare, entertainment, and other end-use industries benefiting from payment services |
Integrated payment service providers with proprietary processing infrastructure and direct NPP connectivity achieve lower transaction cost bases than processors relying entirely on third-party clearing networks. This vertical integration is a meaningful competitive advantage in commodity payment processing segments where margin pressure is intense.
Technology Landscape in the Australia Payments Industry
Real-Time Payment Infrastructure: NPP and PayTo
The New Payments Platform (NPP), Australia's real-time payment backbone, processed 1.24 Billion transactions in 2025. PayTo, its account-to-account overlay service, enables pre-authorised payment agreements for recurring billing, replacing legacy direct debits with instant, revocable payment mandates and enriched transaction data.
Tokenisation and Biometric Authentication
Token-based card payments, replacing 16-digit PANs with cryptographic tokens, are standard across major Australian digital wallets. Biometric fingerprint cards for contactless purchases above AUD 250 were piloted in December 2025, extending secure authentication beyond mobile devices to physical payment instruments.
ISO 20022 Migration and Data Enrichment
Australia's migration to ISO 20022 payment messaging, mandated for major banks by June 2026, enriches transaction data with structured remittance information. This improves reconciliation efficiency for corporates and enables AI-powered cash flow analytics across the payments ecosystem.
Artificial Intelligence in Payments
AI is deployed across fraud detection, credit risk assessment, customer authentication, and payment routing optimisation. Machine learning models process millions of transactions per second, dynamically selecting lowest-cost routing paths while maintaining high authorisation rates across diverse payment channels and merchant categories.
Market Segmentation Analysis
The report covers the following segments:
|
Segment Category |
Leading Segment |
Market Share |
Year |
|
Mode of Payment |
Point of Sale |
62.4% |
2025 |
|
End Use Industry |
Retail |
34.9% |
2025 |
|
Region |
Australia Capital Territory & New South Wales |
32.8% |
2025 |

By Mode of Payment
Point of sale commands a 62.4% majority share in 2025, reflecting Australia's world-leading contactless card penetration rate. Nearly all in-person transactions support tap-and-go, with mobile wallets surpassing physical card interactions at many metropolitan merchants.
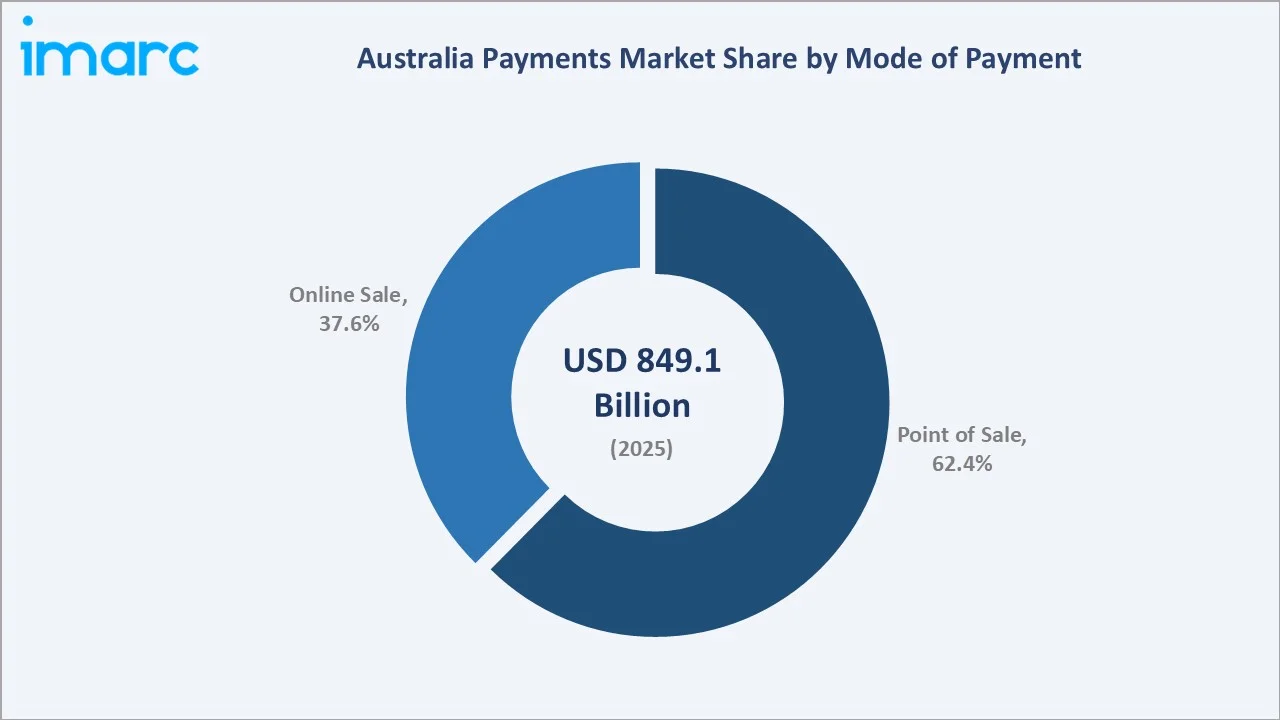
To access detailed market analysis, Request Sample
Online sale at 37.6% in 2025 is growing at the fastest CAGR (~6.3%), driven by e-commerce acceleration, BNPL integration at checkout, and expanding cross-border shopping volumes. Improved fraud detection and one-click checkout are reducing cart abandonment significantly.
By End Use Industry
Retail dominates end-use at 34.9% in 2025, encompassing grocery, fashion, electronics, and specialty retail. Unified commerce platforms enabling seamless payment experiences across physical, mobile, and online channels drive consistent retail payment volume growth.
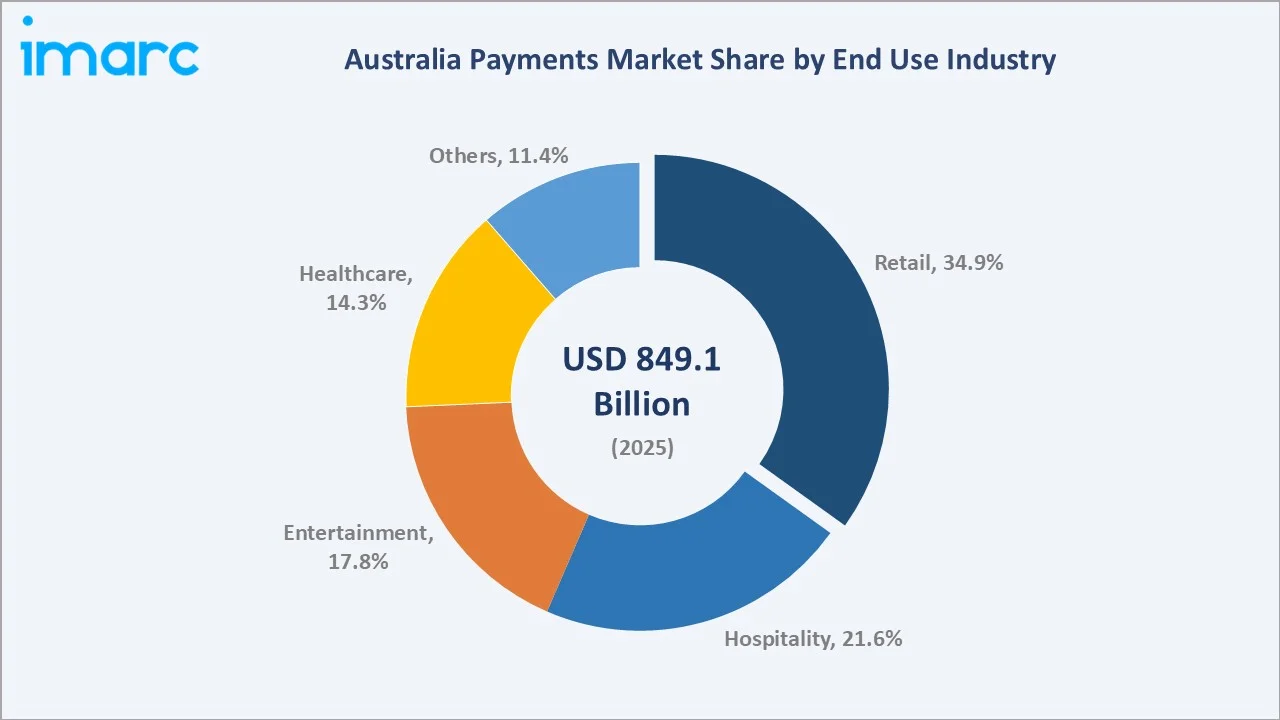
Hospitality at 21.6% in 2025 reflects Australia's significant tourism, food service, and accommodation sectors, where tap-and-go and mobile wallet adoption has accelerated sharply post-pandemic. Entertainment (17.8%) encompasses ticketing, gaming, and leisure services.
Regional Market Insights
|
Region |
Share (2025) |
Key Growth Drivers |
|
ACT & New South Wales |
32.8% |
Financial hub concentration; high corporate payment volumes; strong digital banking adoption; government digital services |
|
Victoria & Tasmania |
25.4% |
Fintech ecosystem strength; retail and hospitality payment volumes; high mobile wallet penetration |
|
Queensland |
19.7% |
Tourism-driven payment activity; growing commercial sector; expanding contactless adoption |
|
Western Australia |
12.6% |
Resources sector B2B payments; growing commercial hub activity; trade-linked payment flows |
|
Northern Territory & South Australia |
9.5% |
Regional inclusion programmes; agricultural sector payment digitisation; compact but growing markets |
ACT & New South Wales commands 32.8% market dominance in 2025, driven by Sydney's concentration of major financial institutions, the Australian Securities Exchange, and a dense fintech ecosystem. Elevated commercial and consumer payment transaction volumes position this region as Australia's undisputed payments leadership centre.
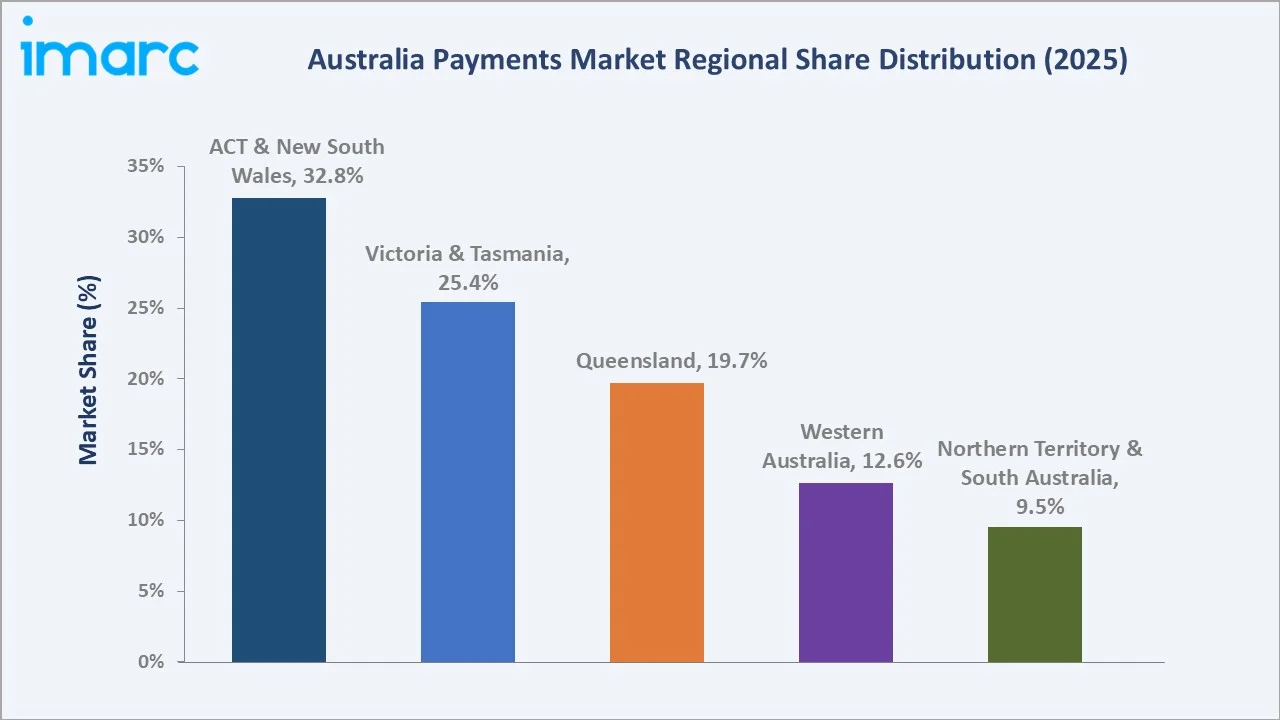
Victoria & Tasmania at 25.4% benefits from Melbourne's fintech ecosystem depth, strong retail and hospitality payment volumes, and widespread mobile wallet adoption. High contactless penetration across the region's diverse commercial sectors supports consistent payment volume growth through the forecast period.
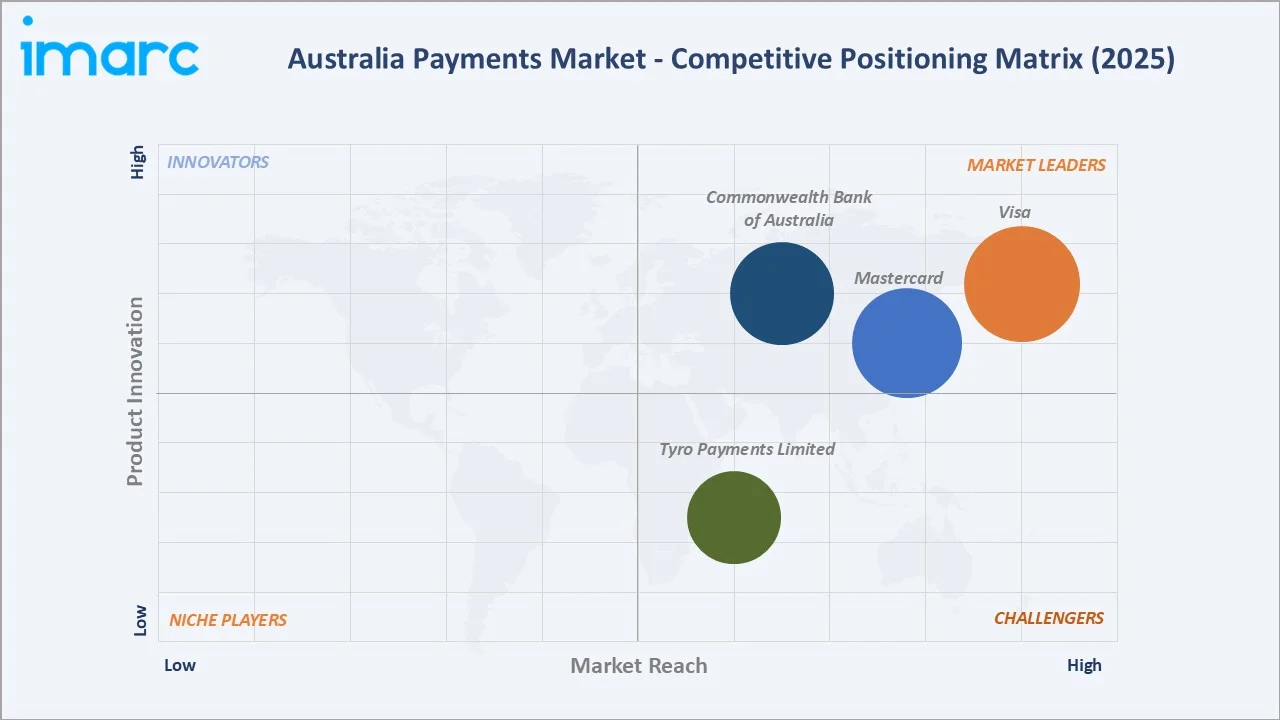
Competitive Landscape
The Australia payments market is moderately concentrated, with global card networks anchoring transaction infrastructure while domestic banks, fintech disruptors, and international payment processors compete across merchant acquiring, digital wallets, and BNPL services.
|
Company Name |
Key Products |
Market Position |
Strategic Focus |
|
Visa |
Visa card network, Visa Direct, tokenization services |
Leader |
Global network scale; real-time push payments; open banking APIs |
|
Mastercard |
Mastercard network, biometric cards, Mastercard Send |
Leader |
Biometric innovation; cross-border corridors; data analytics |
|
Commonwealth Bank of Australia |
CommBank app, StepPay BNPL, NetBank, CommBiz |
Leader |
Digital banking integration; NPP leadership; BNPL expansion |
|
Tyro Payments Limited |
eCommerce, Payment Links, integrated EFTPOS terminal |
Challenger |
SME market focus; health rebate integration; POS ecosystem |
Key players include Visa, Mastercard, Commonwealth Bank of Australia, Tyro Payments Limited, and others.
Key Company Profiles
Commonwealth Bank of Australia
CBA is Australia's largest bank by market capitalisation and a dominant force in retail payments. Its CommBank app serves over 8 million active digital users, leading Australian mobile banking by user engagement and digital transaction volume.
- Product Portfolio: CommBank app, StepPay BNPL, NetBank, CommBiz
- Recent Developments: In February 2026, Commonwealth Bank of Australia announced the acquisition of eCommerce platform IPSI as part of its strategy to strengthen digital payment capabilities for business and institutional customers. The bank said the platform will be integrated into CommBank’s operations throughout 2026 to help businesses better manage the rapid growth of online commerce and digital transactions.
- Strategic Focus: CBA's strategy centres on deepening digital banking integration, embedding BNPL and real-time payment capabilities within its super-app ecosystem, and leveraging data analytics to personalise payment experiences for retail and SME customers across all Australian regions.
Tyro Payments Limited
Tyro Payments is Australia's largest non-bank EFTPOS provider, specialising in integrated payment solutions for small and medium enterprises, with depth in healthcare, hospitality, and retail merchant verticals requiring tight POS software integration.
- Product Portfolio: eCommerce, Payment Links, integrated EFTPOS terminal
- Recent Developments: In June 2025, Tyro has partnered with pet insurance provider GapOnly to roll out a next-generation payment solution designed to simplify and accelerate claims processing for veterinary clinics and pet owners across Australia. The collaboration introduces real-time payment capabilities aimed at improving the overall pet insurance experience.
- Strategic Focus: Tyro differentiates through deep vertical software integration in healthcare and hospitality, enabling instant Medicare and private health fund claim processing at the point of care and reducing administrative burden for healthcare practitioners and their patients.
Market Concentration Analysis
The Australia payments market is moderately concentrated at the infrastructure layer—major card scheme operators collectively process the majority of card-based transactions—while the acquiring, digital wallet, and BNPL layers remain more fragmented and competitively dynamic.
The major domestic banks maintain dominant deposit and card issuance positions, but their acquiring and merchant payment share faces pressure from specialist providers and international payment processors offering cloud-native, developer-friendly payment infrastructure at competitive cost structures.
Investment & Growth Opportunities
Fastest-Growing Segments
Online sale at ~6.3% CAGR through 2034 is the highest-growth mode, driven by e-commerce expansion and BNPL integration. Healthcare payments at ~6.1% CAGR represent the most structurally compelling end-use opportunity on digital health adoption and rebate integration.
Emerging Market Opportunities
Open banking and account-to-account payments present the largest structural disruption opportunity. PayTo overlay services on NPP rails could displace significant card volumes, creating new revenue pools for fintech initiators and reducing merchant interchange costs substantially across retail and hospitality payment categories.
Venture & Investment Trends
Private equity and venture capital interest in Australian payments fintech remains strong. Major international payment processor commitments to expand Sydney engineering operations signal continued offshore strategic investment. Embedded payments in health and SME verticals continue to attract growth capital at attractive valuations.
Future Market Outlook (2026-2034)
The Australia payments market is forecast to expand from USD 849.1 Billion in 2025 to USD 1,345.4 Billion by 2034 at a CAGR of 5.09%, adding USD 496.3 Billion in incremental annual market value over the forecast period—reflecting non-discretionary, infrastructure-linked demand characteristics across all payment channels.
Three structural forces will shape the industry landscape through 2034. Open banking will enable account-to-account payment initiation at scale, compressing card interchange economics and creating new value for fintech payment initiators serving merchant and consumer segments.
Real-time cross-border payment corridors, bilateral NPP linkages with regional payment systems, and AI-powered personalisation will redefine payment experiences. These forces collectively support the market's sustained 5.09% CAGR growth trajectory through 2034.
Research Methodology
Primary Research
Primary research encompassed structured interviews with Australian banking executives, fintech founders, Reserve Bank of Australia economists, merchant payment directors, and industry association analysts. Primary data validated market sizing, segment shares, and technology adoption timelines across all payment modes and end-use categories.
Secondary Research
Key secondary sources include Reserve Bank of Australia Payments System Reports, Australian Banking Association data, AusPayNet Annual Industry Statistics, APRA prudential data, Australian Bureau of Statistics retail trade releases, and Fintech Australia industry publications, supplemented by company annual reports and regulatory submissions.
Forecasting Models
Market size estimations use combined top-down and bottom-up forecasting models incorporating GDP growth rates, consumer spending indices, digital adoption curves, and regulatory scenario analysis. Base, optimistic, and conservative scenario cases validate the 5.09% CAGR central forecast through 2034, with sensitivity analysis applied to key macroeconomic assumptions.
Australia Payments Market Report Coverage:
| Report Features | Details |
|---|---|
| Base Year of the Analysis | 2025 |
| Historical Period | 2020-2025 |
| Forecast Period | 2026-2034 |
| Units | Billion USD |
| Scope of the Report |
Exploration of Historical Trends and Market Outlook, Industry Catalysts and Challenges, Segment-Wise Historical and Future Market Assessment:
|
| Mode of Payments Covered |
|
| End Use Industries Covered | Retail, Entertainment, Healthcare, Hospitality, Others |
| Regions Covered | Australia Capital Territory & New South Wales, Victoria & Tasmania, Queensland, Northern Territory & Southern Australia, Western Australia |
| Companies Covered | Visa, Mastercard, Commonwealth Bank of Australia, Tyro Payments Limited, etc. |
| Customization Scope | 10% Free Customization |
| Post-Sale Analyst Support | 10-12 Weeks |
| Delivery Format | PDF and Excel through Email (We can also provide the editable version of the report in PPT/Word format on special request) |
Key Benefits for Stakeholders:
- IMARC’s industry report offers a comprehensive quantitative analysis of various market segments, historical and current market trends, market forecasts, and dynamics of the Australia payments market from 2020-2034.
- The research report provides the latest information on the market drivers, challenges, and opportunities in the Australia payments market.
- Porter's five forces analysis assist stakeholders in assessing the impact of new entrants, competitive rivalry, supplier power, buyer power, and the threat of substitution. It helps stakeholders to analyze the level of competition within the Australia payments industry and its attractiveness.
- Competitive landscape allows stakeholders to understand their competitive environment and provides an insight into the current positions of key players in the market.
Frequently Asked Questions About the Australia Payments Market Report
The Australia payments market reached USD 849.1 Billion in 2025, reflecting consistent demand driven by widespread digital adoption, mobile wallet proliferation, e-commerce growth, and the expansion of real-time payment infrastructure through the New Payments Platform.
The market is projected to reach USD 1,345.4 Billion by 2034, growing at a CAGR of 5.09% during 2026-2034, driven by open banking rollout, BNPL sector maturation, real-time cross-border payment expansion, and continued digital payment adoption across all consumer segments.
Point of sale leads with a 62.4% share in 2025, valued for its universal contactless penetration and mobile wallet integration. Australia's near-100% tap-and-go acceptance at merchant terminals makes point of sale the default transaction method across all retail sectors.
Online sale is the fastest-growing mode at ~6.3% CAGR through 2034, with a 37.6% market share in 2025. Growth is driven by e-commerce expansion, BNPL penetration at 31% of online transactions, and improved fraud detection enabling higher consumer confidence in digital checkout.
Retail commands 34.9% of the Australia payments market in 2025, reflecting Australia's advanced omni-channel retail ecosystem requiring unified payment platforms across physical, mobile, and online touchpoints, supported by high consumer spending levels.
Healthcare is the fastest-growing end-use segment at ~6.1% CAGR through 2034, with 14.3% share in 2025. Integrated POS payment terminals enabling instant Medicare and private health fund rebate processing are transforming healthcare payment workflows nationwide.
ACT & New South Wales leads at 32.8% in 2025, anchored by Sydney's concentration of major financial institutions, fintech companies, and the Australian Securities Exchange, generating the nation's highest commercial and consumer payment transaction volumes.
Key drivers include rapid digital and mobile wallet adoption, e-commerce expansion, New Payments Platform real-time infrastructure growth, the rise of fintech and challenger banks, and increasing consumer preference for fast, seamless, and secure payment solutions.
Key players include Visa, Mastercard, Commonwealth Bank of Australia, Tyro Payments Limited, and others.
Need more help?
- Speak to our experienced analysts for insights on the current market scenarios.
- Include additional segments and countries to customize the report as per your requirement.
- Gain an unparalleled competitive advantage in your domain by understanding how to utilize the report and positively impacting your operations and revenue.
- For further assistance, please connect with our analysts.
 Request Customization
 Speak to an Analyst
 Request Brochure
 Inquire Before Buying
Benefits of Customization
- Personalize this research
- Triangulate with your data
- Get data as per your format and definition
- Gain a deeper dive into a specific application, geography, customer, or competitor
- Any level of personalization
Get in Touch With Us
UNITED STATES
Phone: +1-201-971-6302
INDIA
Phone: +91-120-433-0800
UNITED KINGDOM
Phone: +44-753-714-6104
Email: [email protected]
Client Testimonials


.webp)


