
Australia Plant-Based Condiments Market Size, Share, Trends and Forecast by Source, Product, Application, End-User, and Region, 2026-2034
Australia Plant-Based Condiments Market Size and Share:
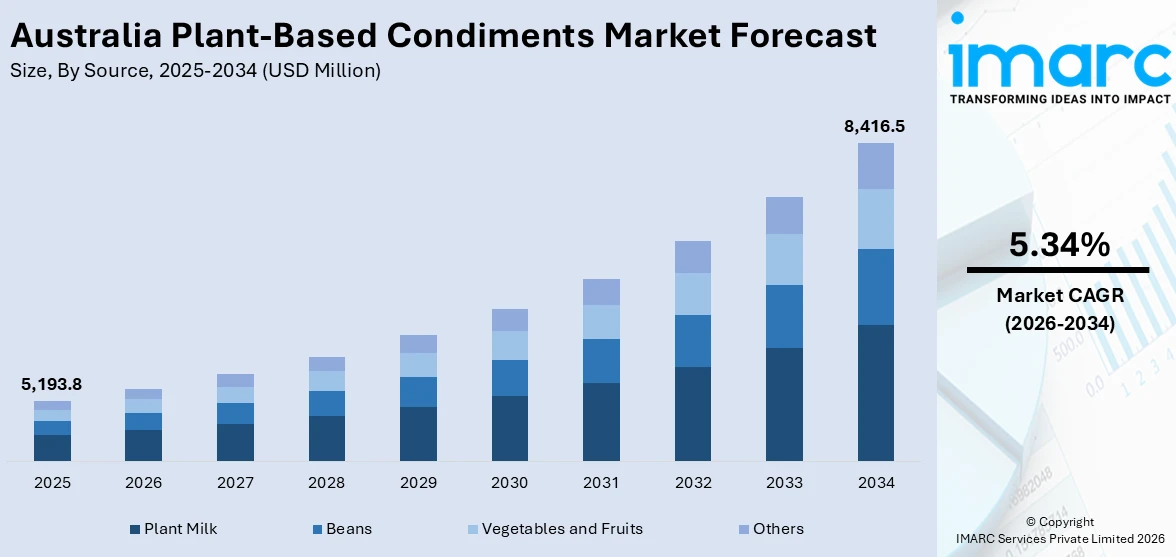
The Australia plant-based condiments market size reached USD 5,193.8 Million in 2025. Looking forward, IMARC Group expects the market to reach USD 8,416.5 Million by 2034, exhibiting a growth rate (CAGR) of 5.34% during 2026-2034. The plant-based condiments market is expanding due to improved accessibility via physical retail and online platforms, making it easier for consumers to discover and purchase these products. The growing preference for clean label items, which feature simple and transparent ingredients, further boosts the demand. Vegan products, often made with natural and organic ingredients, align well with this shift toward healthier, more authentic food options, contributing to the increase of the Australia plant-based condiments market share.
|
Report Attribute
|
Key Statistics
|
|---|---|
|
Base Year
|
2025
|
|
Forecast Years
|
2026-2034
|
|
Historical Years
|
2020-2025
|
|
Market Size in 2025
|
USD 5,193.8 Million |
|
Market Forecast in 2034
|
USD 8,416.5 Million |
| Market Growth Rate 2026-2034 | 5.34% |
Australia Plant-Based Condiments Market Trends:
Rising Focus on Clean Label Products
An increasing consumer inclination towards clean label items, which contain fewer and more easily identifiable ingredients, is influencing the plant-based condiments market in Australia. Individuals are becoming more skeptical about highly processed foods and are seeking options with clear, straightforward ingredient lists. Condiments derived from plants, typically produced with organic, natural, and non-genetically modified organism (GMO) components, match the need for cleaner, healthier options. To address this change, companies in the industry are highlighting the quality of their components, including plant-based oils, herbs, and spices, making it easier for consumers to recognize what is in their meals. The clean label movement is boosting the popularity of plant-based condiments, as these items resonate with the larger shift towards authenticity and simplicity in food. To address the need for transparency, initiatives such as SmartFacts, initiated in 2025 by the Food & Grocery Councils of Australia and New Zealand in partnership with GS1 Australia and GS1 New Zealand, are facilitating consumer access to standardized product details. By scanning GS1 QR codes, consumers can instantly access detailed product information, including ingredients and allergen information, using their smartphones. This effort demonstrates the growing demand for transparency and underscores the attractiveness of plant-based condiments, which align perfectly with the clean label trend by providing natural ingredients that consumers can trust and easily understand.
To get more information on this market Request Sample
Stronger Retail Presence and Distribution Channels
The market for plant-based condiments is witnessing notable expansion due to enhanced visibility and access via physical retail outlets and online platforms. Supermarkets, health food shops, and online retailers are progressively broadening their selections to meet the growing consumer interest in plant-based products. This change in distribution methods, especially the rise of online shopping, is simplifying the process for buyers to discover and buy plant-based condiments. With more brands now available on store shelves and the convenience of online shopping, consumers can easily access a variety of plant-based options. Retailers are leveraging this trend by establishing specific areas for plant-based products, which enhances the appeal of these alternatives. The Australian e-commerce market, which is valued at USD 536.0 billion in 2024, is projected to increase to USD 1,568.60 billion by 2033, showing a remarkable CAGR of 12.70% from 2025 to 2033. This increase in online shopping reflects a growing user desire for convenience and highlights a key opportunity for plant-based condiments to attract a broader consumer base. With the ongoing success of e-commerce, an increasing number of people are finding plant-based condiments via online platforms, which is propelling the Australia plant-based condiments market growth and securing enduring success in the food industry.
Australia Plant-Based Condiments Market Segmentation:
IMARC Group provides an analysis of the key trends in each segment of the market, along with forecasts at the country and regional levels for 2026-2034. Our report has categorized the market based on source, product, application, and end-user.
Source Insights:
- Plant Milk
- Beans
- Vegetables and Fruits
- Others
The report has provided a detailed breakup and analysis of the market based on the source. This includes plant milk, beans, vegetables and fruits, and others.
Product Insights:
- Table Dressings
- Paste, Purees, and Sauce
- Seasoning
- Pickled
A detailed breakup and analysis of the market based on the product have also been provided in the report. This includes table dressings, paste, purees, and sauce, seasoning, and pickled.
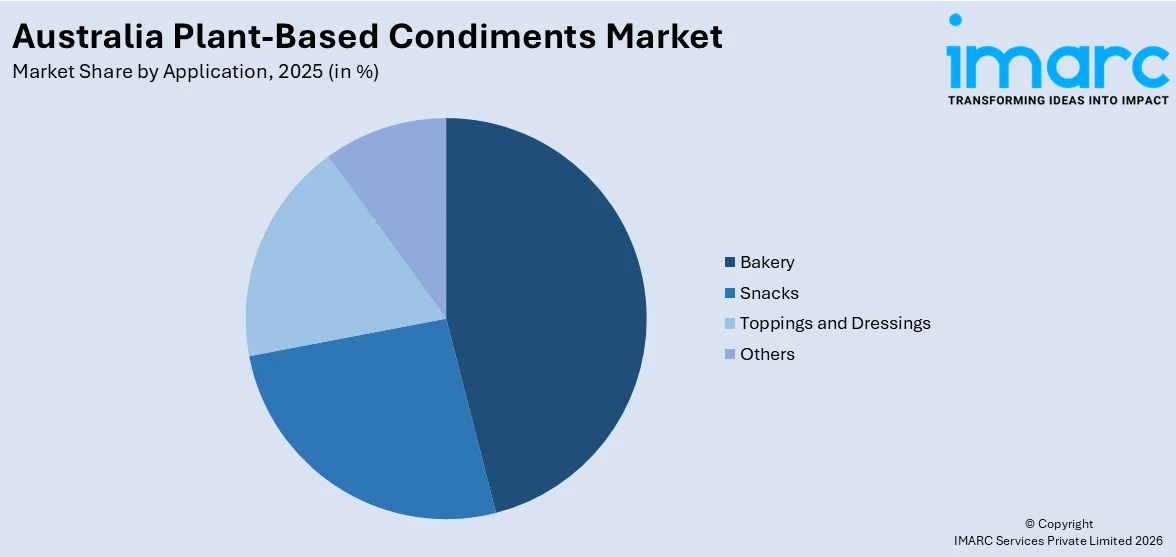
Application Insights:
Access the comprehensive market breakdown Request Sample
- Bakery
- Snacks
- Toppings and Dressings
- Others
The report has provided a detailed breakup and analysis of the market based on the application. This includes bakery, snacks, toppings and dressings, and others.
End-User Insights:
- HoReCa
- Household and Retail
A detailed breakup and analysis of the market based on the end-user have also been provided in the report. This includes HoReCa and household and retail.
Regional Insights:
- Australia Capital Territory & New South Wales
- Victoria & Tasmania
- Queensland
- Northern Territory & Southern Australia
- Western Australia
The report has also provided a comprehensive analysis of all the major regional markets, which include Australia Capital Territory & New South Wales, Victoria & Tasmania, Queensland, Northern Territory & Southern Australia, and Western Australia.
Competitive Landscape:
The market research report has also provided a comprehensive analysis of the competitive landscape. Competitive analysis such as market structure, key player positioning, top winning strategies, competitive dashboard, and company evaluation quadrant has been covered in the report. Also, detailed profiles of all major companies have been provided.
Australia Plant-Based Condiments Market News:
- In August 2024, Fine Food Australia announced its 40th-anniversary event, set for September 2–5, 2024, at the Melbourne Convention and Exhibition Centre. The show spotlighted plant-based innovations, with exhibitors like v2food, The Alternative Dairy Co., and Heal-Thy showcasing sustainable, health-focused food products.
- In February 2024, Bitchin' Sauce known for its diverse range of plant-based creamy condiments, announced its global expansion into Costco stores across Australia, China, Mexico, New Zealand, and South Korea. The plant-based dip brand offered international consumers value-sized and multi-pack flavors like Chipotle and Original.
Australia Plant-Based Condiments Market Report Coverage:
| Report Features | Details |
|---|---|
| Base Year of the Analysis | 2025 |
| Historical Period | 2020-2025 |
| Forecast Period | 2026-2034 |
| Units | Million USD |
| Scope of the Report |
Exploration of Historical Trends and Market Outlook, Industry Catalysts and Challenges, Segment-Wise Historical and Future Market Assessment:
|
| Sourcess Covered | Plant Milk, Beans, Vegetables and Fruits, Others |
| Products Covered | Table Dressings, Paste, Purees, and Sauce, Seasoning, Pickled |
| Applications Covered | Bakery,Snacks,Toppings and Dressings, Others |
| End-Users Covered | HoReCa, Household and Retail |
| Regions Covered | Australia Capital Territory & New South Wales, Victoria & Tasmania, Queensland, Northern Territory & Southern Australia, Western Australia |
| Customization Scope | 10% Free Customization |
| Post-Sale Analyst Support | 10-12 Weeks |
| Delivery Format | PDF and Excel through Email (We can also provide the editable version of the report in PPT/Word format on special request) |
Key Questions Answered in This Report:
- How has the Australia plant-based condiments market performed so far and how will it perform in the coming years?
- What is the breakup of the Australia plant-based condiments market on the basis of source?
- What is the breakup of the Australia plant-based condiments market on the basis of product?
- What is the breakup of the Australia plant-based condiments market on the basis of application?
- What is the breakup of the Australia plant-based condiments market on the basis of end-user?
- What is the breakup of the Australia plant-based condiments market on the basis of region?
- What are the various stages in the value chain of the Australia plant-based condiments market?
- What are the key driving factors and challenges in the Australia plant-based condiments market?
- What is the structure of the Australia plant-based condiments market and who are the key players?
- What is the degree of competition in the Australia plant-based condiments market?
Key Benefits for Stakeholders:
- IMARC’s industry report offers a comprehensive quantitative analysis of various market segments, historical and current market trends, market forecasts, and dynamics of the Australia plant-based condiments market from 2020-2034.
- The research report provides the latest information on the market drivers, challenges, and opportunities in the Australia plant-based condiments market.
- Porter's five forces analysis assist stakeholders in assessing the impact of new entrants, competitive rivalry, supplier power, buyer power, and the threat of substitution. It helps stakeholders to analyze the level of competition within the Australia plant-based condiments industry and its attractiveness.
- Competitive landscape allows stakeholders to understand their competitive environment and provides an insight into the current positions of key players in the market.
Need more help?
- Speak to our experienced analysts for insights on the current market scenarios.
- Include additional segments and countries to customize the report as per your requirement.
- Gain an unparalleled competitive advantage in your domain by understanding how to utilize the report and positively impacting your operations and revenue.
- For further assistance, please connect with our analysts.
 Request Customization
 Speak to an Analyst
 Request Brochure
 Inquire Before Buying
Benefits of Customization
- Personalize this research
- Triangulate with your data
- Get data as per your format and definition
- Gain a deeper dive into a specific application, geography, customer, or competitor
- Any level of personalization
Get in Touch With Us
UNITED STATES
Phone: +1-201-971-6302
INDIA
Phone: +91-120-433-0800
UNITED KINGDOM
Phone: +44-753-714-6104
Email: [email protected]
Client Testimonials


.webp)


