
Australia Power Market Size, Share, Trends and Forecast by Generation Source and Region, 2026-2034
Australia Power Market Size, Share, Trends & Forecast (2026-2034)
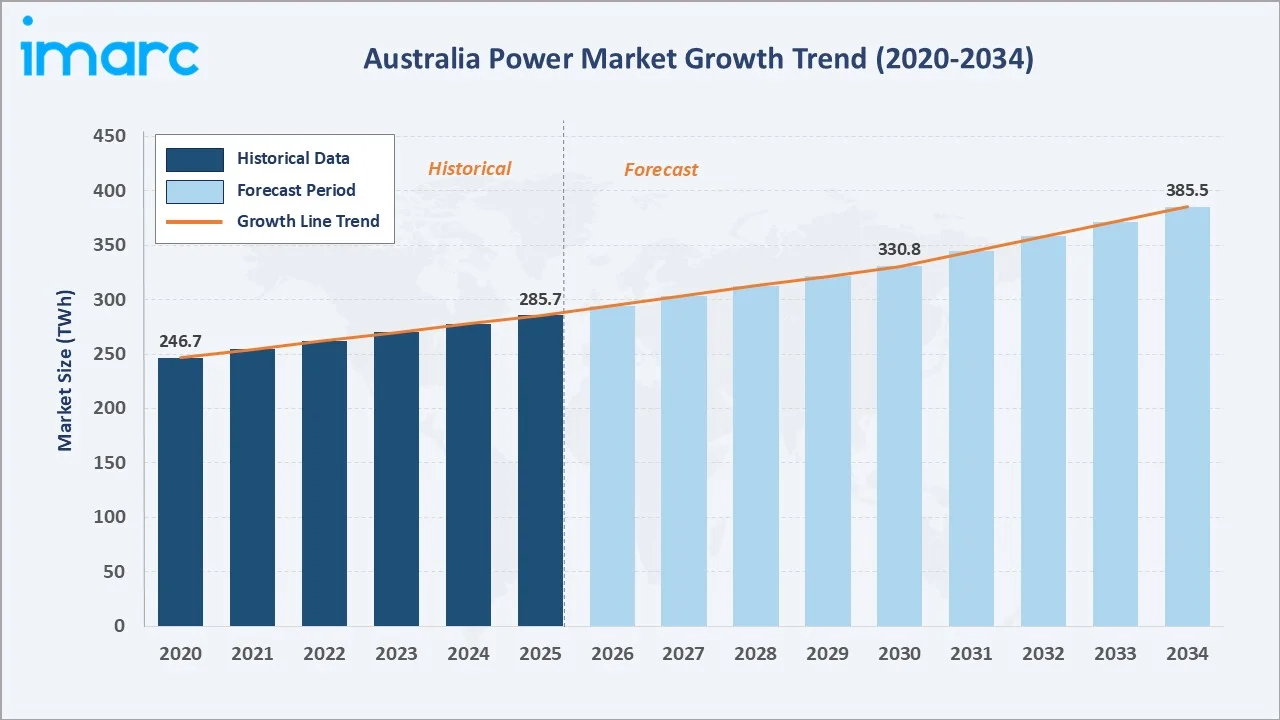
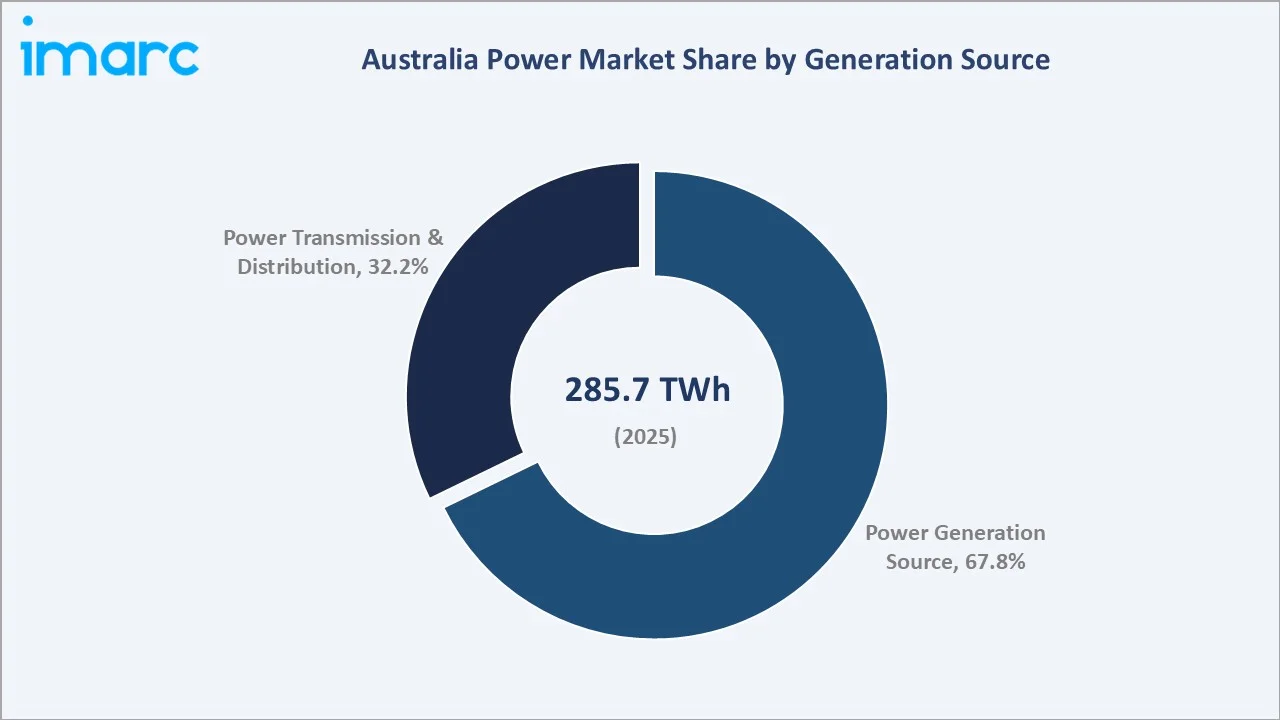
The Australia power market reached 285.7 TWh in 2025 and is projected to reach 385.5 TWh by 2034, growing at a CAGR of 2.98% during 2026-2034. Australia's legally binding 82% renewable electricity target by 2030, electrification of transport and industry driving demand growth, record utility-scale solar and wind capacity additions, large-scale battery energy storage system (BESS) deployment firming the grid, and the Snowy 2.0 pumped hydro completion pipeline collectively anchor the market's steady growth. Power generation source dominates at 67.8% of the market. Australia Capital Territory & New South Wales commands 34.1% of the regional market share.
Market Snapshot
|
Metric |
Value |
|
Market Size (2025) |
285.7 TWh |
|
Forecast Market Size (2034) |
385.5 TWh |
|
CAGR (2026-2034) |
2.98% |
|
Base Year |
2025 |
|
Historical Period |
2020-2025 |
|
Forecast Period |
2026-2034 |
|
Dominant Segment |
Power Generation Source (67.8%, 2025) |
|
Leading Region |
Australia Capital Territory & New South Wales (34.1%, 2025) |
The market expanded from 246.7 TWh in 2020 to 285.7 TWh in 2025, anchored at 330.8 TWh in 2030, and forecast to reach 385.5 TWh by 2034. Australia's power sector is undergoing its most consequential structural transformation since electrification began.
To get more information on this market, Request Sample
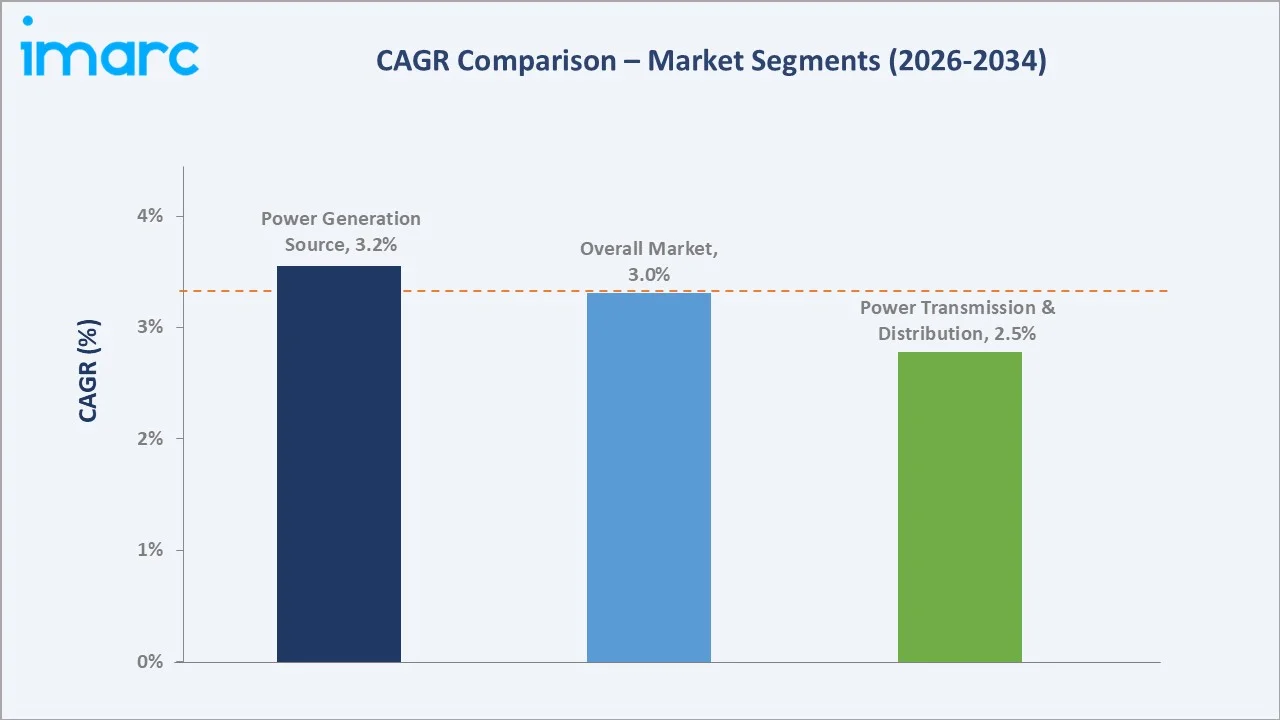
Power generation source grows at ~3.2% CAGR, faster than the overall market, as electrification of transport, industrial process heat decarbonization, and green hydrogen production drive generation capacity and output above the current trajectory. Power transmission and distribution grows at ~2.5% CAGR as regulated asset base expansion translates to service revenue growth despite per-unit distribution cost reductions from smart grid efficiency improvements.
Executive Summary
The Australia power market reached 285.7 TWh in 2025, reflecting a grid system in the midst of the world's fastest renewable energy transition as a percentage of legacy coal-based system replacement. During January to June 2025, Australians had installed a total of 26.8 GW of rooftop solar capacity across 4.2 million homes and small businesses, creating a generation system where midday solar output frequently exceeds 50% of total National Electricity Market (NEM) demand and wholesale prices regularly turn negative in five-minute intervals. The market is projected to reach 385.5 TWh by 2034 at 2.98% CAGR.
Power generation source at 67.8% of the market encompasses all electricity generated and dispatched within Australia's connected grid systems, from the NEM's coal and gas thermal fleet, the growing renewable energy portfolio, and distributed energy resources at the network edge. Power transmission and distribution at 32.2% represents the regulated network infrastructure that delivers generation to consumers. ACT and NSW at 34.1% leads through Sydney's massive load and NSW's renewable transition infrastructure investment.
Key Market Insights
|
Insight |
Data |
|
Dominant Segment |
Power Generation Source - 67.8% (2025) |
|
Leading Region |
ACT & NSW - 34.1% market share (2025) |
Key Analytical Observations Supporting the Above Data:
- Power generation source at 67.8%: Australia's wholesale electricity generation market operates through the NEM's 5-minute dispatch mechanism. The generation sector's 67.8% market share reflects the capital intensity and revenue primacy of the generation layer. The renewable generation transition is shifting asset ownership concentration, and the entry of global renewable IPPs alongside domestic retailers building renewable portfolios is fundamentally changing generation sector competition from a domestic oligopoly to a more diverse international investor landscape.
- ACT and NSW at 34.1% anchored by Sydney's massive load and NSW's renewable transition urgency from Eraring and Liddell coal retirements: NSW faces Australia's most acute renewable transition challenge. Three Renewable Energy Zones have committed network infrastructure, providing the transmission backbone for 25 GW+ of committed renewable development.
Australia Power Market Overview
Australia's power market encompasses the generation, transmission, distribution, and retail of electricity across the continent's interconnected and isolated grid systems. The principal market structure is the National Electricity Market (NEM). The NEM is one of the world's longest AC interconnected power systems. Australia's power market is currently experiencing the most rapid structural transformation in its history. The legislated closure of coal-fired power stations, the deployment of record renewable energy capacity, and the development of grid-scale storage at unprecedented scale collectively define the market's investment landscape through 2034. Macroeconomic factors include steady population growth, expanding urban and industrial electricity demand, rising renewable energy investments, and government support for grid modernization.
Market Dynamics
To evaluate market opportunities, Request Sample
Market Drivers
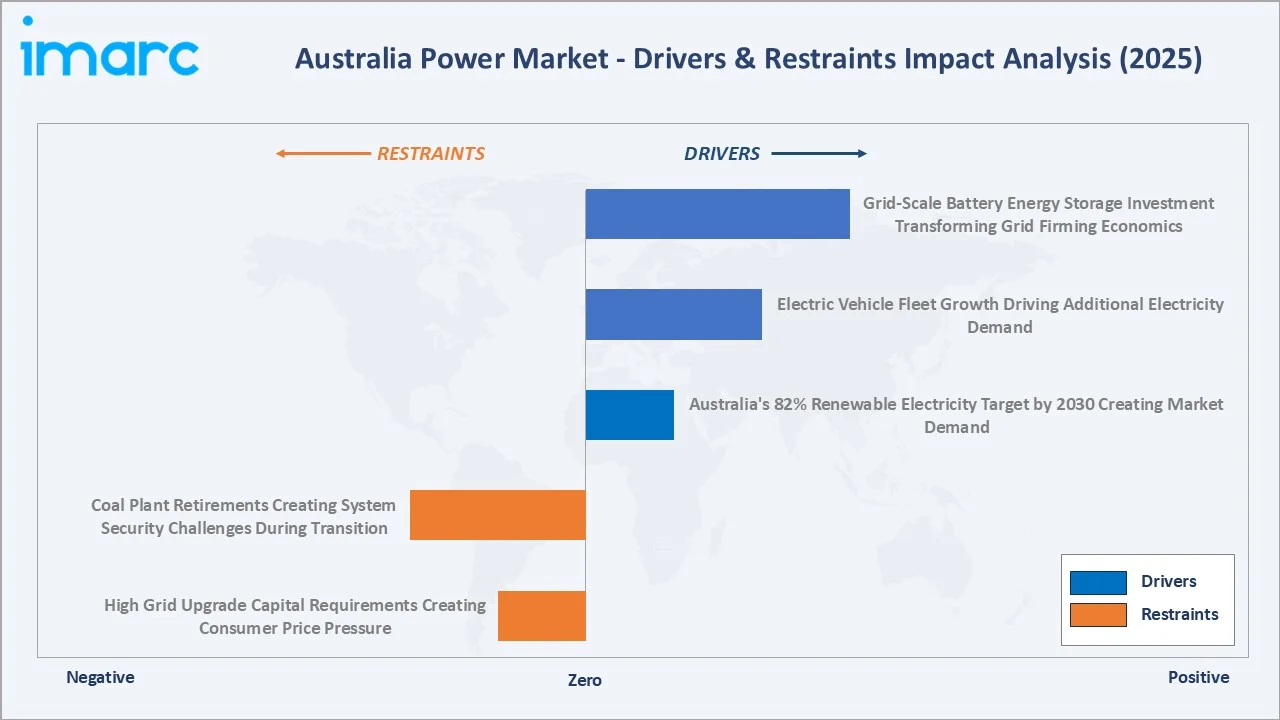
- Australia's 82% Renewable Electricity Target by 2030 Creating Market Demand: The Australian Energy Market Operator’s Integrated System Plan, which supports the national target of achieving 82% renewable electricity, projects that rooftop solar capacity across the National Electricity Market will reach around 36 GW by 2030. It is encouraging utilities and private developers to invest in clean power projects, supported by government schemes aimed at expanding renewable generation and storage capacity.
- Electric Vehicle Fleet Growth Driving Additional Electricity Demand: Electric vehicle fleet growth is increasing electricity demand as more households, businesses, and public transport operators shift from fuel-based vehicles to battery-powered mobility. This is creating new load requirements for home charging, public fast-charging networks, fleet depots, and grid-connected charging infrastructure, supporting investment in power generation and distribution capacity.
- Grid-Scale Battery Energy Storage Investment Transforming Grid Firming Economics: Grid-scale battery energy storage investments are strengthening the market by improving grid reliability and supporting the integration of intermittent renewable energy sources such as solar and wind. Large battery projects are helping utilities manage peak demand, reduce curtailment, and stabilize electricity prices during supply fluctuations. The growing deployment of battery energy storage systems is also encouraging investments in transmission infrastructure and flexible power generation assets.
Market Restraints
- Coal Plant Retirements Creating System Security Challenges During Transition: Coal plant retirements are creating system security and supply reliability challenges as Australia transitions toward renewable energy-based power generation. The closure of aging coal-fired stations is reducing baseload power availability, increasing pressure on transmission networks and backup generation capacity during peak demand periods. Delays in renewable project connections, storage deployment, and grid upgrades are also contributing to electricity price volatility and concerns over long-term energy security.
- High Grid Upgrade Capital Requirements Creating Consumer Price Pressure: High capital requirements for transmission upgrades, renewable integration, and grid modernization are increasing operational and infrastructure costs across Australia’s power sector. Utilities are passing a portion of these expenses to consumers through higher electricity tariffs, creating affordability concerns for households and energy-intensive industries. Rising network investment costs are also placing pressure on regulators to balance reliability improvements with price stability.
Market Opportunities
- Offshore Wind Pipeline of 1.2 GW in Active Licensing Creating a New Generation Category: Ocean Winds received an official feasibility licence from the Australian Federal Government to develop the Westward Wind offshore wind project, which is planned to deliver up to 1.2 GW of capacity off the coast of Bunbury in Western Australia. Offshore wind provides evening and overnight generation at capacity factors superior to mainland onshore wind, directly complementing Australia's solar-heavy daytime renewable profile and addressing the evening demand peak that BESS currently must bridge.
- Green Hydrogen Production Creating Incremental Electricity Demand: Australia's national hydrogen strategy has a green hydrogen target of 15 million tonnes a year, requiring additional electricity demand.
Market Challenges
- Social License and Community Acceptance for Large-Scale Renewable Infrastructure: Australia's renewable transition requires an unprecedented scale of new infrastructure across rural and regional landscapes that communities have historically experienced as undisturbed. Opposition to transmission lines, wind farm noise and visual impact complaints, and solar farmland use competition with agricultural land have created project delays that threaten the 2030 target's feasibility.
- Skilled Labour Shortage for Grid Construction and Renewable Installation: Australia's construction industry faces a national skills shortage in electrical trades, transmission line workers, and renewable energy technicians that threatens to constrain renewable capacity addition rates below policy requirements.
Emerging Market Trends
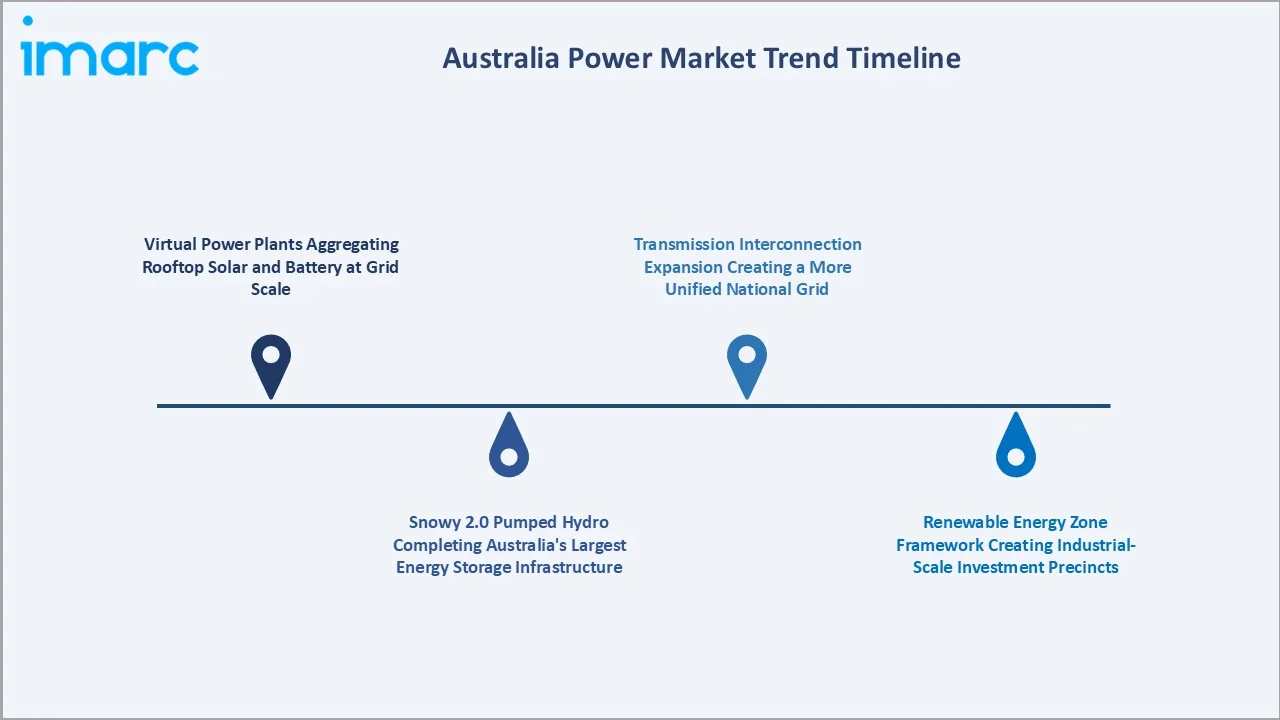
1. Virtual Power Plants Aggregating Rooftop Solar and Battery at Grid Scale
Virtual Power Plants (VPPs) connect distributed rooftop solar systems and residential batteries into coordinated grid-scale energy networks. These systems help utilities manage peak demand, improve grid stability, and optimize renewable energy utilization without relying solely on centralized power generation. Growing household solar adoption and government-backed battery programs are accelerating VPP deployment across several Australian states.
2. Snowy 2.0 Pumped Hydro Completing Australia's Largest Energy Storage Infrastructure
Snowy 2.0 is expanding large-scale energy storage capacity to support the growing share of renewable electricity generation. The pumped hydro project is designed to provide long-duration storage, grid balancing, and backup power during periods of high demand or low renewable output. Its development is also accelerating investments in transmission infrastructure and strengthening the transition toward a more flexible and resilient energy system.
3. Australia's Renewable Energy Zone Framework Creating Industrial-Scale Investment Precincts
Australia’s Renewable Energy Zone (REZ) framework is creating dedicated investment precincts for large-scale solar, wind, storage, and transmission infrastructure development. These zones are helping streamline grid connectivity, reduce network congestion, and attract private investment into renewable energy clusters. The framework is also supporting regional economic growth by encouraging industrial development, clean energy manufacturing, and new employment opportunities around renewable power hubs.
4. Transmission Interconnection Expansion Creating a More Unified National Grid
Transmission interconnection expansion improves electricity transfer between states and strengthens overall grid reliability. New interconnector projects are enabling better integration of renewable energy from resource-rich regions while reducing supply imbalances and price volatility across the National Electricity Market. The growing focus on a more unified national grid is also supporting energy security and long-term decarbonization goals.
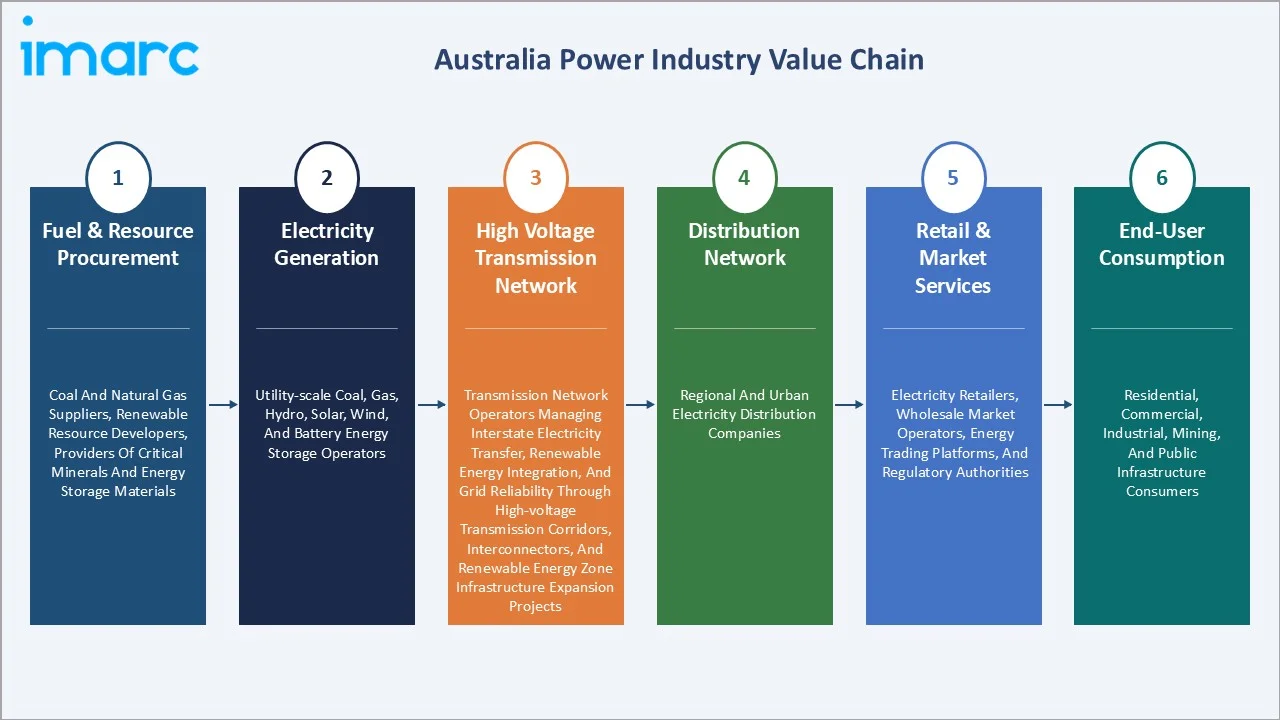
Industry Value Chain Analysis
Australia's power value chain integrates fuel and resource procurement, electricity generation, high-voltage transmission, low-voltage distribution, retail and market services, and end-user consumption with distributed energy resources. Transmission operators earn regulated returns on regulated asset bases through the transmission use of system charges. Distribution operators earn regulated returns through the distribution use of system charges. Retailers earn margins on energy sold minus wholesale cost, network charges, environmental scheme costs, and metering costs.
|
Stage |
Key Participants |
|
Fuel & Resource Procurement |
Coal and natural gas suppliers, renewable resource developers, providers of critical minerals and energy storage materials. |
|
Electricity Generation |
Utility-scale coal, gas, hydro, solar, wind, and battery energy storage operators. |
|
High Voltage Transmission Network |
Transmission network operators managing interstate electricity transfer, renewable energy integration, and grid reliability through high-voltage transmission corridors, interconnectors, and renewable energy zone infrastructure expansion projects. |
|
Distribution Network |
Regional and urban electricity distribution companies. |
|
Retail & Market Services |
Electricity retailers, wholesale market operators, energy trading platforms, and regulatory authorities. |
|
End-User Consumption |
Residential, commercial, industrial, mining, and public infrastructure consumers. |
The end-user consumption and distributed energy resource tier is Australia's most rapidly transforming value chain element. Rooftop solar generation has shifted households from passive energy consumers to active prosumers who both consume and generate electricity, fundamentally changing the distribution network's operational requirements and the retail market's economics.
Technology Landscape in the Australia Power Industry
Battery Energy Storage System Technology
Australia has emerged as one of the world's leading BESS deployment markets, driven by grid firming requirements, frequency control ancillary service market revenue, and network infrastructure deferral applications. Lithium iron phosphate (LFP) chemistry dominates Australia's utility-scale BESS deployments due to its superior cycle life, thermal stability in Australia's high-ambient-temperature environment, and declining cost trajectory.
Large-Scale Solar PV Technology and Grid Integration
Large-scale solar PV technology is transforming Australia’s power industry through the deployment of high-efficiency utility-scale solar farms integrated with advanced grid management systems. The increasing use of tracking systems, smart inverters, and battery storage integration is improving power generation stability and renewable energy utilization. Grid integration technologies are also enabling better coordination between solar generation, transmission infrastructure, and electricity demand across the National Electricity Market.
Smart Grid and Advanced Metering Infrastructure
In December 2025, EDMI signed a major agreement with Australia-based smart meter and energy infrastructure company PLUS ES to strengthen advanced grid intelligence capabilities in the country. The expanded partnership includes one of Australia’s largest deployments of edge intelligence and smart metering technologies, extending the use of EDMI’s hardware for six additional years and its Storm cloud intelligence platform for another 15 years. The deployment of smart meters and digital network technologies is helping utilities enhance operational efficiency, reduce outage response times, and support dynamic electricity pricing models. These technologies are also facilitating greater integration of rooftop solar, battery storage, electric vehicles, and other distributed energy resources into the grid.
Market Segmentation Analysis
The report covers the following segments:
|
Segment Category |
Leading Segment |
Market Share |
Year |
|
Generation Source |
Power Generation Source |
67.8% |
2025 |
|
Region |
Australia Capital Territory & New South Wales |
34.1% |
2025 |
By Generation Source
Power generation source leads at 67.8% market share (2025). The power generation source holds a dominant position due to the country’s large-scale electricity production capacity across coal, natural gas, solar, wind, and hydro resources. Growing investments in renewable energy projects, utility-scale battery storage, and grid modernization are further strengthening generation infrastructure nationwide. Rising electricity demand from residential, industrial, mining, and commercial sectors is also supporting the continuous expansion of generation capacity across the National Electricity Market (NEM).
The generation source segment's 3.2% CAGR through 2034 reflects two countervailing forces: output growth from new renewable and storage capacity additions offset by improved energy efficiency and distributed generation.
Regional Market Insights
|
Region |
Share (2025) |
Key Growth Drivers & Characteristics |
|
Australia Capital Territory & New South Wales |
34.1% |
Supported by high electricity demand from dense urban centers, commercial hubs, data centers, and ongoing renewable energy integration across major consumption zones. |
|
Victoria & Tasmania |
24.9% |
Driven by strong residential and industrial power demand, expanding wind and hydro-based generation, and growing investments in grid modernization and clean energy transition. |
|
Queensland |
19.3% |
Benefiting from rising energy consumption across mining, manufacturing, and residential sectors, along with increasing solar power adoption and large-scale renewable projects. |
|
Western Australia |
12.4% |
Supported by strong demand from mining, resources, and industrial operations, along with investments in standalone power systems and renewable energy integration in remote areas. |
|
Northern Territory & Southern Australia |
9.3% |
Driven by growing renewable energy deployment, remote power infrastructure needs, and rising focus on improving grid stability and energy access across dispersed markets. |
ACT and New South Wales at 34.1% leads Australia's regional power market through Sydney's metropolitan demand, NSW's heavy industry, and the ACT's government and services economy. NSW is also Australia's most significant renewable investment state, with the largest coal retirement volume requiring the most proportional replacement investment.
Victoria and Tasmania, at 24.9%, collectively leverage Tasmania's hydro resources through Basslink to firm mainland VIC's renewable generation, creating a natural integration between Australia's two states with the highest renewable generation shares. Victoria's offshore wind ambition represents the most significant new generation category addition. Queensland's 19.3% reflects the state's strong renewable resource and clean energy development program.

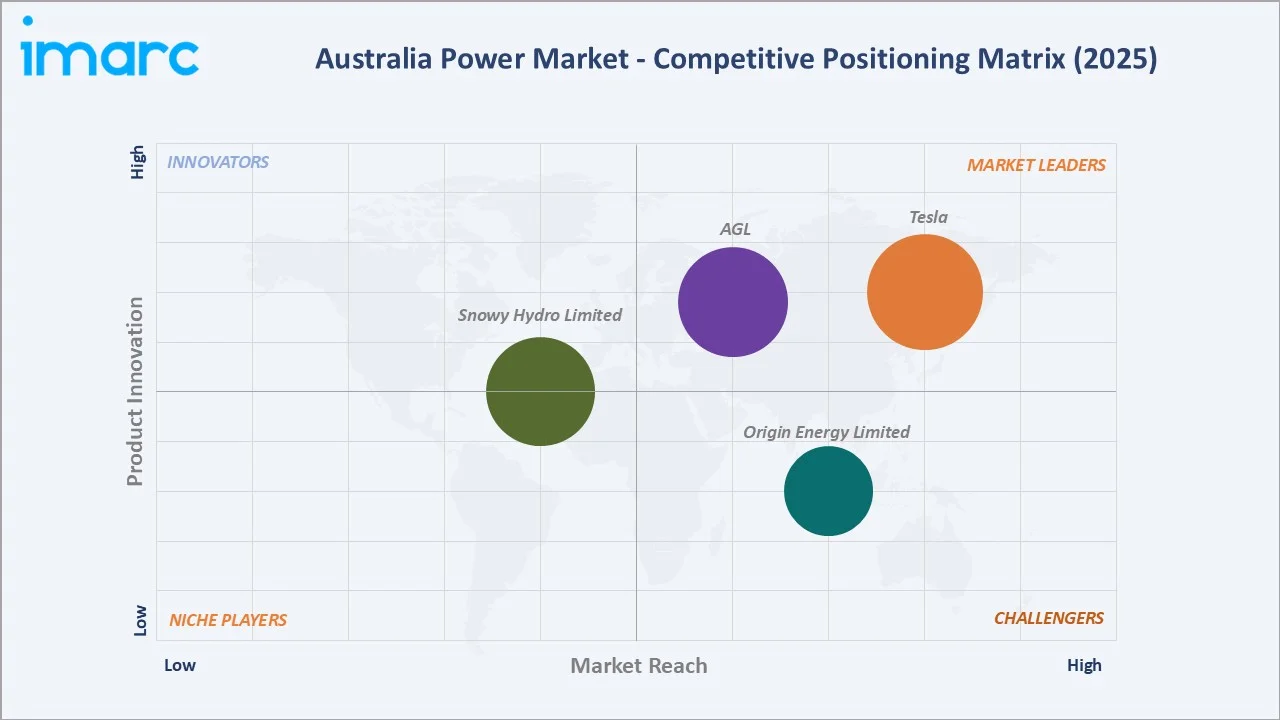
Competitive Landscape
Australia's power market competitive structure operates across two distinct competitive layers: the wholesale electricity generation market and the regulated transmission and distribution segment. In generation, the three largest retailers-generators together control 40-45% of NEM generation capacity and 65-70% of retail customer accounts. New renewable entrants and government-owned entities are progressively reducing the three retailer-generators' market share as the generation mix diversifies.
|
Company Name |
Products |
Market Position |
Core Strength |
|
Tesla |
Megapack, Powerwall |
Market Leader |
Powerwall is a compact home battery that stores energy generated by solar or from the grid. Megapack is a powerful, integrated battery system that provides clean, reliable, cost-effective energy storage to help stabilize the grid and prevent outages. |
|
AGL |
Broken Hill Battery, Tomago Battery, Liddell Battery |
Market Leader |
AGL operates the largest private electricity generation portfolio in Australia and is building history as one of Australia’s leading private investors in the construction of renewable energy projects. |
|
Snowy Hydro Limited |
Snowy 2.0 |
Established Player |
Snowy 2.0 will store excess power from wind and solar and deliver it to homes and businesses across the grid at times it’s needed most. |
|
Origin Energy Limited |
Eraring Power Station battery, Mortlake Power Station battery, Darling Downs Power Station battery |
Strong Challenger |
Origin’s priority renewable energy project is the Yanco Delta Wind Farm in New South Wales, alongside the development of large-scale battery energy storage systems at the Eraring and Mortlake power stations. The company also owns multiple utility-scale wind and solar projects and retains the option to expand the Shoalhaven pumped-storage hydro power plant. |
The competitive landscape is being reshaped by three forces: coal retirements eliminating the largest thermal generators' market power; BESS entry by specialized storage operators competing with retailer-generator BESS for FCAS market revenue; and the ACCC's market monitoring creating competitive pressure on retail margins that historically subsidized the three largest integrated utilities' renewable transition investment programs.
Key Company Profiles
AGL
AGL is Australia's largest private electricity generator and retailer, operating across thermal, gas, and growing renewable assets, and serving residential and business energy accounts through its energy business.
- Products: Broken Hill Battery, Tomago Battery, Liddell Battery
- Recent Developments: In March 2026, AGL Energy Ltd launched the commissioning of the first 250 MW at its 500-MW/1,000-MWh Liddell battery project in New South Wales.
- Strategic Focus: Expanding renewable energy generation, grid-scale battery storage, and flexible energy solutions while accelerating the transition away from coal-fired power assets in Australia.
Origin Energy Limited
Origin Energy is one of Australia’s largest integrated energy companies, combining a customer retail business and electricity generation assets.
- Products: Eraring Power Station battery, Mortlake Power Station battery, Darling Downs Power Station battery.
- Recent Developments: In February 2026, Origin Energy started generating revenue from the first phase of its Supernode and Eraring battery storage projects in Queensland and New South Wales. The Eraring Battery Energy Storage System reached commercial operation in December 2025, providing 460 MW of output with nearly 3.8 hours of discharge duration at the site of Australia’s largest coal-fired power station. The company stated that the project was completed on schedule and within budget, and it is now actively participating in the National Electricity Market to generate revenue.
- Strategic Focus: Expanding renewable energy projects, large-scale battery storage systems, and flexible generation assets to strengthen its transition toward a lower-carbon electricity portfolio in Australia.
Market Concentration Analysis
Australia's power generation market exhibits moderate concentration; the three integrated retailer-generators (AGL Energy, Origin Energy, Tesla) collectively own 40-45% of NEM installed generation capacity and serve 65-70% of retail electricity customers. However, this concentration is declining as coal retirements reduce the three large utilities' thermal fleet capacity while new renewable entrants add capacity primarily outside the three majors' portfolios.
Transmission and distribution markets are natural monopolies with single operators in each geographic franchise area regulated under the National Electricity Rules. This regulatory structure prevents competition in transmission and distribution but enables oversight of pricing, service standards, and investment approval that protects consumer interests while enabling sufficient investment returns to attract private capital.
Investment & Growth Opportunities
Highest Investment Priority Segments
Large-scale BESS development, offshore wind development, renewable energy zone network infrastructure, pumped hydro development beyond Snowy 2.0, and green hydrogen electrolysis infrastructure collectively define Australia's power sector investment landscape for the forecast period.
Emerging Investment Opportunities
Australia's offshore wind sector represents the highest-return greenfield investment opportunity in the power sector through 2034, with project economics benefiting from world-class Bass Strait and Southern Ocean wind resources, the premium value of evening generation that offshore wind provides in Australia's solar-heavy grid, and the Victorian and NSW government offshore wind targets creating structured demand for offtake agreements.
Investment Themes
- Battery Energy Storage for Grid Firming: Australia's BESS market offers compelling investment returns through the combination of NEM wholesale market arbitrage, FCAS market revenue, and capacity mechanism revenue.
- Green Hydrogen and Export Infrastructure: Australia's competitive advantage in green hydrogen derives from the combination of world-class renewable resources (solar and wind), existing port infrastructure, and proximity to Asian hydrogen import markets.
Future Market Outlook (2026-2034)
The Australia power market is projected to grow from 285.7 TWh in 2025 to 385.5 TWh by 2034, delivering a 2.98% CAGR over the forecast period. The market's anchor value of 330.8 TWh in 2030 represents a power system in which coal-fired generation has declined to below 5% of annual NEM output, rooftop and utility-scale solar together supply 45-50% of annual energy, wind contributes 25-30%, and battery storage and pumped hydro provide the firming capacity that enables Australia's renewable-dominated grid to maintain the system reliability standards that modern economies require.
Three structural forces define Australia's power market growth through 2034 with high certainty: demand growth from electrification, EV adoption, electric heat pumps replacing gas water heaters and space heating, green hydrogen electrolysis, and industrial process electrification collectively add new electricity demand above existing trajectory; supply transformation through renewable energy deployment; and network investment enabling the renewable transition.
Research Methodology
Primary Research
Primary research comprised structured interviews with 50+ industry stakeholders (2025), including General Managers of Generation; Transmission and Distribution planning directors; AEMO wholesale market and system planning division analysts; AER regulatory economics team leads; ARENA and CEFC clean energy finance officers; Australia project development directors; and independent analysts at Rystad Energy, Wood Mackenzie, and Cornwall Insight Australia specializing in NEM market forecasting.
Secondary Research
Secondary research encompassed AEMO Integrated System Plan (ISP) 2024 Update; AEMO Electricity Statement of Opportunities (ESOO) 2025; AER State of the Energy Market 2025; Clean Energy Council Clean Energy Australia Report 2024; Department of Climate Change, Energy, the Environment and Water (DCCEEW) 2035 National Energy Targets modeling; Australian Bureau of Statistics Energy Account Australia 2023-24; BOM climate data for solar and wind resource assessment; individual company ASX/annual reports; CEFC Green Financing Annual Report 2024; ARENA investment portfolio data; and OpenNEM historical NEM generation data (2020-2025). Over 70 secondary sources were reviewed.
Forecasting Models
Market volume forecasts (TWh) were developed using AEMO's Step Change and Central scenarios from the 2024 ISP as primary reference trajectories, calibrated against AER's State of the Energy Market electricity demand projections, CSIRO's GenCost 2024-25 generation cost trajectories informing technology deployment assumptions, and OpenNEM historical dispatch data for base year calibration. Key inputs include Australia's Climate Change Act 2022 emissions reduction trajectory, state renewable energy targets, EV market penetration models, and Green Hydrogen Industrial Strategy deployment scenarios for electrolyser demand.
Australia Power Market Report Coverage:
| Report Features | Details |
|---|---|
| Base Year of the Analysis | 2025 |
| Historical Period | 2020-2025 |
| Forecast Period | 2026-2034 |
| Units | TWh |
| Scope of the Report |
Exploration of Historical Trends and Market Outlook, Industry Catalysts and Challenges, Segment-Wise Historical and Future Market Assessment:
|
| Generation Sources Covered | Power Generation Source (Coal, Natural Gas, Oil, Renewables, Others), Power Transmission and Distribution |
| Regions Covered | Australia Capital Territory & New South Wales, Victoria & Tasmania, Queensland, Northern Territory & Southern Australia, Western Australia |
| Companies Covered | Tesla, AGL, Snowy Hydro Limited, Origin Energy Limited, etc. |
| Customization Scope | 10% Free Customization |
| Post-Sale Analyst Support | 10-12 Weeks |
| Delivery Format | PDF and Excel through Email (We can also provide the editable version of the report in PPT/Word format on special request) |
Frequently Asked Questions About the Australia Power Market Report
The Australia power market reached 285.7 TWh in 2025, driven by demand growth from electrification, renewable energy deployment growth, Snowy 2.0 pumped hydro construction progress, large-scale BESS commissioning at Torrens Island and Liddell, and record utility-scale renewable capacity additions.
The market grows at 2.98% CAGR during 2026-2034, reaching 385.5 TWh by 2034, driven by EV fleet electrification demand, industrial electrification, green hydrogen electrolyser demand, and population and economic growth across all Australian states, partially offset by energy efficiency improvements reducing per-capita consumption intensity.
Power generation source leads at 67.8% through coal, gas, solar, wind, and hydro generation dispatched through the NEM's 5-minute real-time market.
ACT and NSW lead at 34.1% through Sydney's metropolitan load, Hunter Valley industrial demand, and the ACT's government services economy.
Leading companies include Tesla, AGL, Snowy Hydro Limited, and Origin Energy Limited, among others.
The market is projected to reach approximately 330.8 TWh by 2030, with renewable energy, Snowy 2.0 entering the commissioning phase, the last major coal generators approaching retirement, and offshore wind reaching final investment decision.
Australia's legislated 82% renewable electricity target by 2030 requires new wind, solar, and storage capacity, representing new clean energy investment.
Snowy 2.0’s 2,200 megawatt (MW) capacity will deliver enough energy to power 3 million homes for a week, equivalent to about 23 million home batteries. It is Australia's largest energy storage project.
Three priority opportunities: utility-scale BESS in NSW and VIC REZ precincts achieving 12-15% project IRRs through combined FCAS, arbitrage, and CIS underwriting revenue streams; offshore wind development in Bass Strait and Gippsland with 40-50% capacity factors and government offtake support through the Victorian offshore wind program; and green hydrogen electrolyser projects in WA's Pilbara and NT's Darwin region leveraging world-class renewable resources, existing port infrastructure, and proximity to Asian hydrogen import markets targeting commercial production by 2028-2030.
Need more help?
- Speak to our experienced analysts for insights on the current market scenarios.
- Include additional segments and countries to customize the report as per your requirement.
- Gain an unparalleled competitive advantage in your domain by understanding how to utilize the report and positively impacting your operations and revenue.
- For further assistance, please connect with our analysts.
 Request Customization
 Speak to an Analyst
 Request Brochure
 Inquire Before Buying
Benefits of Customization
- Personalize this research
- Triangulate with your data
- Get data as per your format and definition
- Gain a deeper dive into a specific application, geography, customer, or competitor
- Any level of personalization
Get in Touch With Us
UNITED STATES
Phone: +1-201-971-6302
INDIA
Phone: +91-120-433-0800
UNITED KINGDOM
Phone: +44-753-714-6104
Email: [email protected]
Client Testimonials


.webp)


