
Australia Power Transformer Market Size, Share, Trends and Forecast by Core, Insulation, Phase, Rating, Application, and Region, 2026-2034
Australia Power Transformer Market Overview:
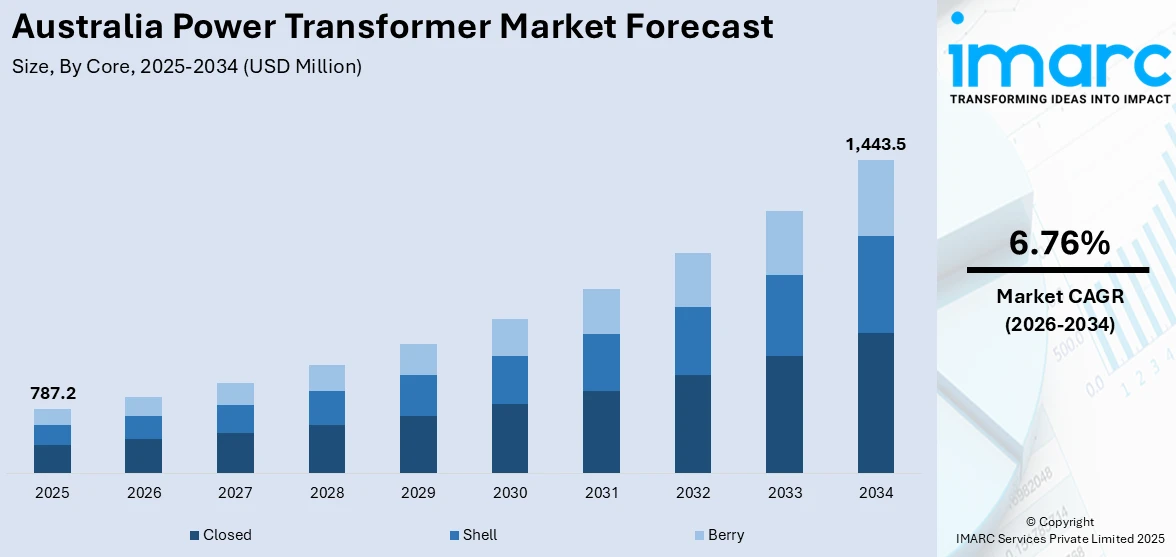
The Australia power transformer market size reached USD 787.2 Million in 2025. Looking forward, the market is projected to reach USD 1,443.5 Million by 2034, exhibiting a growth rate (CAGR) of 6.76% during 2026-2034. The market is prompted by drivers like growing demand for electricity, upgrade of infrastructure, renewable integration, and technology. Government policies and measures favoring energy efficiency and grid stability also drive the Australia power transformer market share, increasing investment in industrial and commercial sectors.
|
Report Attribute
|
Key Statistics
|
|---|---|
|
Base Year
|
2025 |
|
Forecast Years
|
2026-2034
|
|
Historical Years
|
2020-2025
|
| Market Size in 2025 | USD 787.2 Million |
| Market Forecast in 2034 | USD 1,443.5 Million |
| Market Growth Rate 2026-2034 | 6.76% |
Key Trends of Australia Power Transformer Market:
Integration of Renewable Energy
The transition towards renewable energy sources in Australia is changing the power transformer market. Governments' carbon-emission-reducing targets are pushing Australia towards solar, wind, and battery storage technologies. These renewable energy sources necessitate an enhanced grid system to distribute and transmit electricity efficiently, which boosts the demand for advanced power transformers. Solar farms, wind power plants, and battery storage facilities are spread all over Australia, particularly in rural regions, which require high-voltage as well as variable load transformers. This is expected to pick up speed as renewable energy capacity continues to grow, requiring more efficient power transformers to enable smooth energy transmission and grid integration. For instance, in May 2024, Hitachi Energy and AusNet collaborated on the Golden Plains Wind Farm project in Victoria, Australia, to support the country’s transition to renewable energy. Hitachi Energy is supplying two 850 MVA 500kV power transformers to connect the wind farm to the grid. This project, with a total capacity of 1,330 MW, will provide 4,000 GWh of green energy annually, powering over 765,000 homes. It also aims to prevent 4.5 million tons of CO2 emissions annually, supporting Australia’s net-zero goals. The project creates significant local employment opportunities and contributes to sustainable energy infrastructure.
To get more information on this market Request Sample
Smart Grid and Technological Advancements
The use of smart grid technologies is propelling the demand for higher power transformers. This is one of the major drivers for the Australia power transformer market growth. Smart grids enable real-time monitoring, fault detection, and automated control, enhancing the efficiency of the transmission and distribution networks. Power transformers with sensors and IoT devices offer valuable information to grid operators that can help them optimize the performance of the transformer, improve predictive maintenance, and prolong equipment life. This trend is especially significant as Australia aims to increase the capacity of its power grid, minimize losses, and incorporate decentralized renewable sources of energy. With continuing technological innovation in smart grid infrastructure, the demand for advanced, digital-ready transformers will increase to provide better grid management and efficiency. For instance, in May 2024, Wilson Transformer Company completed the transportation of the final 350MVA 330/33/33kV power transformer to the Waratah Super Battery Project in New South Wales. The transformer, part of a larger shipment of equipment, is essential for managing voltage levels in the system. The project, developed by Akaysha Energy, will house the world’s largest battery, with a capacity of 850 MW / 1680 MWh. The transformers will play a critical role in the grid's energy storage and distribution.
Demand for High-Efficiency Transformers
The Australian market for high-efficiency transformers is on the rise because of an increased emphasis on energy conservation and sustainability. Utilities, industrial consumers, and commercial buildings are placing emphasis on transformers that minimize the loss of energy during transmission and distribution, resulting in reduced operational expenses and a smaller carbon footprint. These transformers employ improved materials, better core construction, and improved cooling systems to enhance efficiency and reliability. Government regulations and standards that promote low-loss electrical equipment further encourage the adoption of high-efficiency solutions. The presence of renewable energy sources like solar power and wind also requires transformers that ensure excellent performance with minimal energy loss, which is crucial for sustaining stable grid operations. Growing awareness of energy-saving technologies and their long-term cost advantages is driving Australia power transformer market demand, positioning high-efficiency transformers as an essential element of contemporary electrical infrastructure and sustainable energy development.
Growth Drivers of Australia Power Transformer Market:
Expansion of Power Generation Capacity
The growth of power generation capacity in Australia significantly contributes to the demand for transformers. As electricity production increases from traditional sources like coal and natural gas, alongside renewables such as solar and wind, there is a heightened need for dependable transmission and distribution infrastructure. Transformers play a crucial role in adjusting voltage levels, facilitating efficient power delivery from generation facilities to consumers. An increase in generation capacity also bolsters grid stability and energy reliability, especially in remote or industrial regions. Utility companies and independent power producers are investing in sophisticated transformers to manage heavier loads and integrate variable renewable energy sources, thereby making the deployment of transformers a vital aspect of Australia’s changing energy landscape.
Urbanization and Industrialization
The swift urbanization and industrialization occurring in Australia are propelling electricity usage, which subsequently heightens the demand for power transformers. Expanding cities necessitate broader residential, commercial, and infrastructure power networks, while industrial areas require dependable high-capacity transformers to support ongoing operations. According to Australia power transformer market analysis, this increase in electricity needs in urban and industrial areas is prompting utilities and private investors to enhance and expand distribution networks. There is a growing requirement for transformers that can manage higher loads and facilitate smart grid integration. The establishment of industrial parks, commercial centers, and urban infrastructure projects offers long-term prospects for transformer manufacturers and suppliers. As a result, urbanization and industrialization serve as key growth drivers for the Australian power transformer market.
Replacement of Obsolete Transformers
The need to replace outdated and aging transformers is a vital factor influencing growth within the Australian power transformer market. Numerous existing transformers have reached the end of their operational life, resulting in heightened maintenance expenses, inefficiencies, and a greater risk of outages. Transitioning to modern, high-performance transformers improves reliability, reduces energy losses, and helps meet evolving safety and efficiency standards. Various sectors including industrial, commercial, and utility are increasingly investing in advanced transformers that offer enhanced cooling systems, low-loss materials, and digital monitoring features. Proactive replacement initiatives also support grid modernization efforts, allowing for better integration of renewable energy and smart grid technologies. This ongoing emphasis on replacing outdated equipment guarantees a sustained demand for new transformers and fosters long-term market growth in Australia.
Opportunities of Australia Power Transformer Market:
Rural Electrification Initiatives
Rural electrification efforts in Australia are presenting substantial prospects for the power transformer sector. Providing electricity to remote and regional areas calls for dependable distribution and step-down transformers to ensure consistent power delivery over extensive distances and difficult terrains. These initiatives cater to the energy requirements of residential, agricultural, and industrial sectors in underserved locations, improving living standards and fostering economic advancement. Utility companies and private energy providers are investing in durable transformer solutions designed to function effectively under fluctuating load conditions and extreme weather. Moreover, rural electrification frequently involves the incorporation of renewable energy sources like solar mini-grids, which require specialized transformers suited for managing intermittent power. The increasing emphasis on enhancing electricity access in regional areas guarantees ongoing demand for innovative transformer designs, making rural electrification a significant factor driving growth in Australia’s power transformer market.
Advanced Cooling and Material Technologies
The integration of advanced cooling systems and groundbreaking materials offers a substantial opportunity in the Australian power transformer market. Contemporary transformers use materials such as amorphous steel, improved insulation, and enhanced core configurations to boost efficiency and minimize energy losses. Advanced cooling technologies, including oil-immersed and forced-air systems, enable transformers to accommodate higher loads while maintaining optimal temperatures, thereby enhancing longevity and reliability. These technological advancements are particularly relevant for high-capacity industrial, urban, and renewable energy settings. As businesses and utilities seek energy-efficient and low-maintenance options, transformers featuring enhanced materials and cooling solutions become increasingly attractive. Investment in research, development, and the implementation of these advanced technologies provides manufacturers and service providers opportunities to distinguish their products and respond to evolving market needs, thereby supporting long-term growth and sustainability in the industry.
Public-Private Partnerships (PPPs)
Public-private partnerships (PPPs) in Australia offer a strategic avenue for the power transformer market by merging government oversight with the efficiency of the private sector. Infrastructure and energy initiatives conducted under PPP models often entail constructing or upgrading transmission and distribution systems, leading to increased demand for high-performance transformers. These collaborations facilitate shared investment in modern electrical equipment, including smart and energy-efficient transformers, which enhance grid stability and energy delivery. PPPs also allow for the deployment of advanced technologies such as IoT-enabled monitoring, predictive maintenance systems, and the integration of renewable energy. By capitalizing on private sector expertise and funding, large-scale projects can be executed effectively while adhering to regulatory and sustainability goals. Such partnerships strengthen the transformer market ecosystem, create consistent demand, and encourage innovation, making PPP initiatives a vital path for the sustained growth of Australia’s power transformer market.
Government Initiatives for Australia Power Transformer Market:
Research and Development Support
The Australian government actively promotes research and development in the power transformer sector through funding, grants, and collaborative programs. These initiatives aim to enhance transformer technology, including the use of high-performance materials, innovative cooling systems, and energy-efficient designs. By facilitating R&D, the government encourages manufacturers to create transformers with increased reliability, reduced energy losses, and improved durability. Research efforts also include integrating smart monitoring systems, IoT connectivity, and predictive maintenance capabilities, which enable more intelligent and responsive power networks. Such programs foster innovation and boost the competitiveness of domestic manufacturers in both regional and global markets. Government-backed R&D initiatives contribute to the modernization of Australia’s power infrastructure and support sustainable energy solutions, driving long-term growth in the power transformer market.
Safety and Operational Standards
The Australian government enforces strict safety and operational standards for power transformers to ensure reliable performance and mitigate risks. Regulations encompass electrical safety, noise control, insulation quality, and operational efficiency, requiring compliance from manufacturers and utilities with established guidelines. These standards protect workers, end-users, and the environment while ensuring an uninterrupted power supply. Compliance involves regular inspections, certifications, and the implementation of best practices in transformer design and maintenance. By setting clear benchmarks, the government promotes the production and deployment of high-quality transformers capable of withstanding heavy loads, extreme weather, and operational stress. These safety and operational policies safeguard public and industrial infrastructure, strengthening confidence in modern power systems and facilitating the adoption of advanced transformer technologies.
Incentives for Industrial and Commercial Electrification
The Australian government provides incentives to encourage industrial and commercial entities to upgrade their electrical systems with modern transformers. Programs may include tax benefits, grants, or subsidies aimed at adopting high-efficiency, low-loss, and smart transformers that enhance reliable power distribution. These incentives lower upfront costs, making it easier for industries, commercial complexes, and large facilities to modernize their energy infrastructure. Upgraded transformers improve operational efficiency, decrease maintenance costs, and boost energy management capabilities. They also support the incorporation of renewable energy sources and compliance with sustainability regulations. By advocating for electrification and modernization in industrial and commercial sectors, these government initiatives stimulate demand for advanced transformer solutions, drive technological adoption, and bolster the long-term growth of the power transformer market in Australia.
Australia Power Transformer Market Segmentation:
IMARC Group provides an analysis of the key trends in each segment of the market, along with forecasts at the region/country level for 2026-2034. Our report has categorized the market based on core, insulation, phase, rating, and application.
Core Insights:
- Closed
- Shell
- Berry
The report has provided a detailed breakup and analysis of the market based on the core. This includes closed, shell, and berry.
Insulation Insights:
- Gas
- Oil
- Solid
- Air
- Others
The report has provided a detailed breakup and analysis of the market based on the insulation. This includes gas, oil, solid, air, and others.
Phase Insights:
- Single
- Three
The report has provided a detailed breakup and analysis of the market based on the phase. This includes single and three.
Rating Insights:
- 100 MVA to 500 MVA
- 501 MVA to 800 MVA
- 801 MVA to 1200 MVA
The report has provided a detailed breakup and analysis of the market based on the rating. This includes 100 MVA to 500 MVA, 501 MVA to 800 MVA, and 801 MVA to 1200 MVA.
Application Insights:
Access the comprehensive market breakdown Request Sample
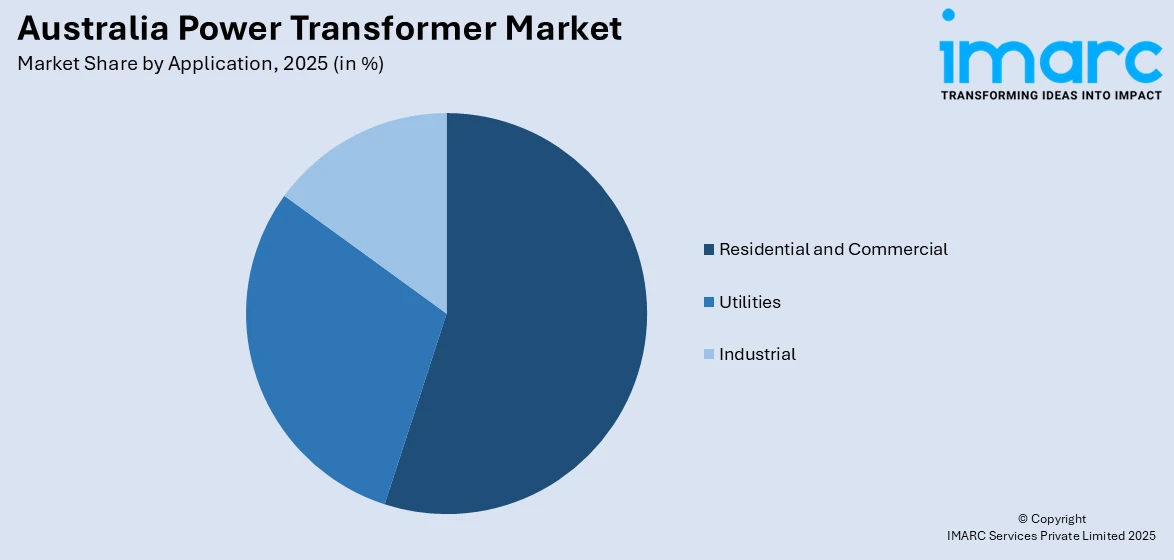
- Residential and Commercial
- Utilities
- Industrial
The report has provided a detailed breakup and analysis of the market based on the application. This includes residential and commercial, utilities, and industrial.
Regional Insights:
- Australia Capital Territory & New South Wales
- Victoria & Tasmania
- Queensland
- Northern Territory & Southern Australia
- Western Australia
The report has also provided a comprehensive analysis of all the major regional markets, which include Australia Capital Territory & New South Wales, Victoria & Tasmania, Queensland, Northern Territory & Southern Australia, and Western Australia.
Competitive Landscape:
The market research report has also provided a comprehensive analysis of the competitive landscape. Competitive analysis such as market structure, key player positioning, top winning strategies, competitive dashboard, and company evaluation quadrant has been covered in the report. Also, detailed profiles of all major companies have been provided.
Australia Power Transformer Market News:
- In April 2025, Ingeteam secured contracts from European Energy to supply technology for two new solar plants in Australia: the Lancaster plant in Victoria (106 MW) and the Mulwala plant in New South Wales (31 MW). These projects, expected to generate 255 GWh annually, will power around 54,000 homes. Ingeteam will provide 77 INGECON SUN inverters and 22 transformer stations, further advancing Australia's renewable energy transition. This marks Ingeteam’s first project with European Energy, building on its 4 GW supply track record in Australia.
- In April 2025, Australia’s EnergyConnect project reached a significant milestone with the first power transmission through its western section, marking a key development in the country’s energy transformation. Spanning 900 km, the project links grids in New South Wales, South Australia, and Victoria, enhancing grid stability and enabling renewable energy transfers. Once completed, it will allow the transfer of up to 800 MW, reducing reliance on fossil fuels.
Australia Power Transformer Market Report Coverage:
| Report Features | Details |
|---|---|
| Base Year of the Analysis | 2025 |
| Historical Period | 2020-2025 |
| Forecast Period | 2026-2034 |
| Units | Million USD |
| Scope of the Report |
Exploration of Historical Trends and Market Outlook, Industry Catalysts and Challenges, Segment-Wise Historical and Future Market Assessment:
|
| Cores Covered | Closed, Shell, Berry |
| Insulations Covered | Gas, Oil, Solid, Air, Others |
| Phases Covered | Single, Three |
| Ratings Covered | 100 MVA To 500 MVA, 501 MVA To 800 MVA, 801 MVA To 1200 MVA |
| Applications Covered | Residential And Commercial, Utilities, Industrial |
| Regions Covered | Australia Capital Territory & New South Wales, Victoria & Tasmania, Queensland, Northern Territory & Southern Australia, Western Australia |
| Customization Scope | 10% Free Customization |
| Post-Sale Analyst Support | 10-12 Weeks |
| Delivery Format | PDF and Excel through Email (We can also provide the editable version of the report in PPT/Word format on special request) |
Key Benefits for Stakeholders:
- IMARC’s industry report offers a comprehensive quantitative analysis of various market segments, historical and current market trends, market forecasts, and dynamics of the Australia power transformer market from 2020-2034.
- The research report provides the latest information on the market drivers, challenges, and opportunities in the Australia power transformer market.
- Porter's five forces analysis assist stakeholders in assessing the impact of new entrants, competitive rivalry, supplier power, buyer power, and the threat of substitution. It helps stakeholders to analyze the level of competition within the Australia power transformer industry and its attractiveness.
- Competitive landscape allows stakeholders to understand their competitive environment and provides an insight into the current positions of key players in the market.
Frequently Asked Questions About the Australia Power Transformer Market Report
The power transformer market in Australia was valued at USD 787.2 Million in 2025.
The Australia power transformer market is projected to exhibit a compound annual growth rate (CAGR) of 6.76% during 2026-2034.
The Australia power transformer market is expected to reach a value of USD 1,443.5 Million by 2034.
The Australia power transformer market is witnessing trends such as the adoption of high-efficiency, low-loss transformers, greater focus on smart grid integration, and rising use of digital monitoring systems. Growth in renewable energy projects and demand for advanced, sustainable transformer solutions are also shaping market evolution.
Key growth drivers include expanding electricity generation from renewable and conventional sources, rising urbanization, and increasing industrialization. Replacement of outdated transformers with modern, high-performance units, along with government initiatives supporting infrastructure upgrades and grid modernization, further strengthen market expansion and ensure reliable energy delivery across urban and regional areas.
Need more help?
- Speak to our experienced analysts for insights on the current market scenarios.
- Include additional segments and countries to customize the report as per your requirement.
- Gain an unparalleled competitive advantage in your domain by understanding how to utilize the report and positively impacting your operations and revenue.
- For further assistance, please connect with our analysts.
 Request Customization
 Speak to an Analyst
 Request Brochure
 Inquire Before Buying
Benefits of Customization
- Personalize this research
- Triangulate with your data
- Get data as per your format and definition
- Gain a deeper dive into a specific application, geography, customer, or competitor
- Any level of personalization
Get in Touch With Us
UNITED STATES
Phone: +1-201-971-6302
INDIA
Phone: +91-120-433-0800
UNITED KINGDOM
Phone: +44-753-714-6104
Email: [email protected]
Client Testimonials


.webp)


