
Australia Reinsurance Market Size, Share, Trends and Forecast by Type, Mode, Distribution Channel, Application, and Region, 2026-2034
Australia Reinsurance Market Overview:
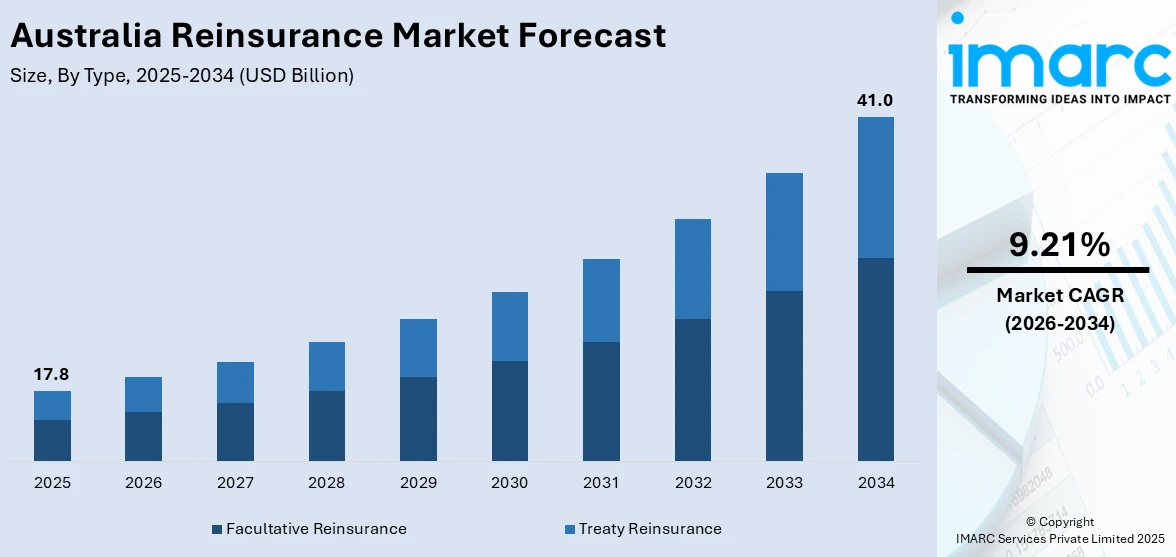
The Australia reinsurance market size reached USD 17.8 Billion in 2025. Looking forward, the market is projected to reach USD 41.0 Billion by 2034, exhibiting a growth rate (CAGR) of 9.21% during 2026-2034. ESG-aligned risk models, regulatory climate disclosures, and sustainability-focused capital strategies are reshaping underwriting frameworks. Cyber vulnerability, digital dependency, and critical infrastructure protections are increasing demand for specialized cover. In addition to this, parametric solutions, collaborative modeling, and sector-specific risk differentiation are some of the major factors augmenting the Australia reinsurance market share.
|
Report Attribute
|
Key Statistics
|
|---|---|
|
Base Year
|
2025 |
|
Forecast Years
|
2026-2034
|
|
Historical Years
|
2020-2025
|
| Market Size in 2025 | USD 17.8 Billion |
| Market Forecast in 2034 | USD 41.0 Billion |
| Market Growth Rate 2026-2034 | 9.21% |
Key Trends of Australia Reinsurance Market:
Climate Disclosure Mandates and ESG Integration
Australia’s regulatory environment is increasingly shaped by climate-related financial disclosure requirements, prompting insurers and reinsurers to adjust capital allocation strategies. With the Australian Prudential Regulation Authority (APRA) and the Australian Securities and Investments Commission (ASIC) issuing guidance on managing climate risks, reinsurance providers are now integrating environmental, social, and governance (ESG) metrics into underwriting and portfolio modeling. These frameworks demand quantifiable risk analysis and long-term scenario planning, especially across sectors exposed to bushfires, coastal erosion, and drought. Reinsurers are incorporating physical and transition risk variables into pricing strategies, leading to more refined risk differentiation and dynamic capital reserve structures. Additionally, corporate demand for climate-aligned insurance coverage is driving innovation in parametric and indexed reinsurance offerings. As insurers increase reliance on technical risk transfer products that align with ESG benchmarks, this institutional shift is supporting Australia reinsurance market growth by embedding sustainability principles into core risk management practices and fostering long-term capital stability. The Australian Government's cyclone reinsurance pool, established in 2022, has begun delivering some savings on insurance premiums for consumers in cyclone-prone regions, according to an industry report released on 19 September 2024. The pool has resulted in an average premium reduction of 8% to 24% in high-risk cyclone regions, with some home, strata, and small business policies seeing price drops of 27% and 16%, respectively.
To get more information on this market Request Sample
Cyber Risk Exposure and Digital Infrastructure Dependency
The expanding digitization of Australia’s economy has heightened systemic exposure to cyber threats, making cyber risk a significant driver of reinsurance demand. Businesses across the banking, energy, logistics, and healthcare sectors have increased their reliance on interconnected digital platforms, resulting in growing vulnerability to ransomware, data breaches, and operational disruption. Reinsurers are now developing bespoke cyber reinsurance products that account for both primary coverage gaps and systemic aggregation risks. These offerings are tailored to complex incident scenarios, including multi-vector attacks and correlated global events. To address the growing complexities of risk in sectors like banking, energy, and healthcare, insurers and reinsurers are increasingly focusing on solutions that extend beyond traditional coverage, such as government-backed reinsurance pools. On November 13, 2023, IAG, a major Australian insurance company, joined the Federal Government's Cyclone Reinsurance Pool, managed by the Australian Reinsurance Pool Corporation (ARPC). The initiative aims to reduce insurance premiums for eligible policyholders in cyclone-prone regions such as Queensland, the Northern Territory, and Western Australia. IAG will pass on savings from the pool to new and renewed policies, including home, commercial property, and landlord policies, with the extent of savings varying based on individual circumstances and property risks. Regulatory developments such as the Security of Critical Infrastructure Act (SOCI) have intensified pressure on insurers to maintain adequate capital buffers for cyber-related exposures. In response, reinsurance plays an increasingly strategic role in safeguarding balance sheets from volatility associated with digital threats. The introduction of real-time threat modeling tools and collaborative risk-sharing consortia has further expanded coverage options and underwriting accuracy.
Shift Toward Alternative Capital
The shift toward alternative capital is a notable trend shaping the Australia reinsurance market demand. Reinsurers are increasingly seeking non-traditional capital sources, including insurance-linked securities (ILS), catastrophe bonds, and collateralized reinsurance, to diversify their funding and manage risk exposure. These financial instruments enable investors from outside the traditional insurance sector to engage in risk-sharing, thereby providing additional capacity and liquidity to the market. Alternative capital solutions play a crucial role in managing high-severity, low-frequency events, like natural disasters, where conventional reinsurance options may be limited or expensive. By utilizing these innovative financial structures, reinsurers can enhance capital efficiency, improve solvency management, and deliver more competitive coverage options. The rising acceptance of alternative capital is consequently bolstering resilience and flexibility within the Australian reinsurance ecosystem.
Growth Drivers of Australia Reinsurance Market:
Urbanization and Asset Concentration
The rapid urban growth in Australia has resulted in a substantial accumulation of population, properties, and commercial infrastructure in areas vulnerable to risks, such as coastal regions and zones prone to bushfires. This clustering significantly amplifies the financial repercussions of natural disasters, as a single event can lead to extensive losses across residential, industrial, and agricultural domains. With a larger number of high-value assets involved, insurers experience increased risk exposure, making reinsurance a vital mechanism for risk distribution. The trend of expanding infrastructure roads, housing, and utilities exacerbates the potential for larger insured losses. Reinsurers play a crucial role in assuming these risks, which helps ensure stability for primary insurers and keeps coverage affordable for both households and businesses in the face of growing threats associated with climate and geographic vulnerabilities.
Catastrophe Modeling Improvements
According to Australia reinsurance market analysis, advancements in catastrophe modeling have revolutionized the way insurers and reinsurers evaluate, price, and manage risk. Modern models now combine historical loss data, satellite imaging, climate simulations, and predictive analytics to more precisely estimate the financial repercussions of bushfires, floods, and cyclones. These tools enable insurers to fine-tune their reinsurance arrangements, opting for customized coverage that aligns with their risk tolerance and capital needs. The enhanced transparency in risk assessment also aids reinsurers in creating innovative products and attracting fresh capital to the market. This level of scientific accuracy nurtures greater confidence among stakeholders, bolsters solvency resilience, and promotes the long-term viability of the reinsurance sector in a nation susceptible to severe and recurring natural hazards.
Global Reinsurer Participation
Australia’s reinsurance market reaps the benefits of the active engagement of prominent global reinsurers, who contribute top financial strength and superior risk management expertise and innovative products. Their involvement augments market depth, allowing Australian insurers to gain access to broader coverage options and competitive pricing structures. International players also bring new capital forms, such as insurance-linked securities, enhancing market resilience against significant catastrophic losses. Additionally, global reinsurers offer insights from other regions facing similar difficulties, which improves underwriting standards and regulatory compliance. This collaboration elevates the sophistication of the Australian reinsurance market, ensuring it is well-prepared to manage escalating risks while assisting domestic insurers in providing consistent protection to policyholders across the country.
Australia Reinsurance Market Segmentation:
IMARC Group provides an analysis of the key trends in each segment of the market, along with forecasts at the country and regional levels for 2026-2034. Our report has categorized the market based on type, mode, distribution channel, and application.
Type Insights:
- Facultative Reinsurance
- Treaty Reinsurance
- Proportional Reinsurance
- Non-proportional Reinsurance
The report has provided a detailed breakup and analysis of the market based on the type. This includes facultative reinsurance and treaty reinsurance (proportional reinsurance and non-proportional reinsurance).
Mode Insights:
- Online
- Offline
The report has provided a detailed breakup and analysis of the market based on the mode. This includes online and offline.
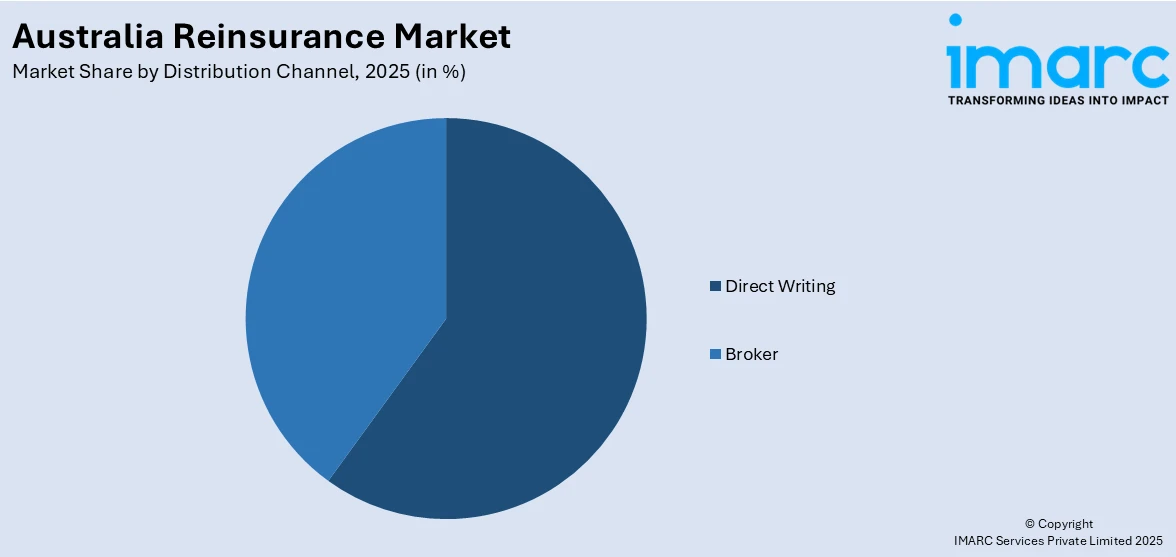
Distribution Channel Insights:
Access the comprehensive market breakdown Request Sample
- Direct Writing
- Broker
The report has provided a detailed breakup and analysis of the market based on the distribution channel. This includes direct writing and broker.
Application Insights:
- Property and Casualty Reinsurance
- Life and Health Reinsurance
- Disease Insurance
- Medical Insurance
The report has provided a detailed breakup and analysis of the market based on the application. This includes property and casualty reinsurance and life and health reinsurance (disease insurance and medical insurance).
Regional Insights:
- Australia Capital Territory & New South Wales
- Victoria & Tasmania
- Queensland
- Northern Territory & Southern Australia
- Western Australia
The report has also provided a comprehensive analysis of all the major regional markets, which include Australia Capital Territory & New South Wales, Victoria & Tasmania, Queensland, Northern Territory & Southern Australia, and Western Australia.
Competitive Landscape:
The market research report has also provided a comprehensive analysis of the competitive landscape. Competitive analysis such as market structure, key player positioning, top winning strategies, competitive dashboard, and company evaluation quadrant has been covered in the report. Also, detailed profiles of all major companies have been provided.
Australia Reinsurance Market News:
- On March 31, 2025, MS Amlin announced the launch of a new branch office in Sydney, Australia, as part of its strategy to expand its reinsurance presence in the Asia Pacific market. Matt Botfield was appointed as Head of Australia and New Zealand to oversee business development and leverage MS Amlin’s underwriting expertise in the region. The new office, which is subject to Lloyd’s approval, aims to tap into growing reinsurance opportunities in Australia and New Zealand, without disrupting the existing portfolio managed from London.
Australia Reinsurance Market Report Coverage:
| Report Features | Details |
|---|---|
| Base Year of the Analysis | 2025 |
| Historical Period | 2020-2025 |
| Forecast Period | 2026-2034 |
| Units | Billion USD |
| Scope of the Report |
Exploration of Historical Trends and Market Outlook, Industry Catalysts and Challenges, Segment-Wise Historical and Future Market Assessment:
|
| Types Covered |
|
| Modes Covered | Online, Offline |
| Distribution Channels Covered | Direct Writing, Broker |
| Applications Covered |
|
| Regions Covered | Australia Capital Territory & New South Wales, Victoria & Tasmania, Queensland, Northern Territory & Southern Australia, Western Australia |
| Customization Scope | 10% Free Customization |
| Post-Sale Analyst Support | 10-12 Weeks |
| Delivery Format | PDF and Excel through Email (We can also provide the editable version of the report in PPT/Word format on special request) |
Key Benefits for Stakeholders:
- IMARC’s industry report offers a comprehensive quantitative analysis of various market segments, historical and current market trends, market forecasts, and dynamics of the Australia reinsurance market from 2020-2034.
- The research report provides the latest information on the market drivers, challenges, and opportunities in the Australia reinsurance market.
- Porter's five forces analysis assist stakeholders in assessing the impact of new entrants, competitive rivalry, supplier power, buyer power, and the threat of substitution. It helps stakeholders to analyze the level of competition within the Australia reinsurance industry and its attractiveness.
- Competitive landscape allows stakeholders to understand their competitive environment and provides an insight into the current positions of key players in the market.
Frequently Asked Questions About the Australia Reinsurance Market Report
The reinsurance market in Australia was valued at USD 17.8 Billion in 2025.
The Australia reinsurance market is projected to exhibit a compound annual growth rate (CAGR) of 9.21% during 2026-2034.
The Australia reinsurance market is expected to reach a value of USD 41.0 Billion by 2034.
The market is witnessing rising use of alternative capital structures like catastrophe bonds, growing adoption of AI-driven risk modeling, and higher focus on climate resilience. Local insurers are increasingly forming strategic partnerships with global reinsurers while demand for customized, event-specific coverage is also strengthening the market growth.
Expanding infrastructure investment, aging population fueling life and health insurance demand, and rising agricultural insurance needs are driving growth. Increasing investor interest in insurance-linked securities, alongside regulatory encouragement for risk transfer, further boosts market development. Enhanced digitalization in claims and underwriting also supports broader reinsurance adoption.
Need more help?
- Speak to our experienced analysts for insights on the current market scenarios.
- Include additional segments and countries to customize the report as per your requirement.
- Gain an unparalleled competitive advantage in your domain by understanding how to utilize the report and positively impacting your operations and revenue.
- For further assistance, please connect with our analysts.
 Request Customization
 Speak to an Analyst
 Request Brochure
 Inquire Before Buying
Benefits of Customization
- Personalize this research
- Triangulate with your data
- Get data as per your format and definition
- Gain a deeper dive into a specific application, geography, customer, or competitor
- Any level of personalization
Get in Touch With Us
UNITED STATES
Phone: +1-201-971-6302
INDIA
Phone: +91-120-433-0800
UNITED KINGDOM
Phone: +44-753-714-6104
Email: [email protected]
Client Testimonials


.webp)


