
Australia Solar Panel Market Size, Share, Trends and Forecast by Type, End Use, and Region, 2026-2034
Australia Solar Panel Market Size, Share, Trends & Forecast (2026-2034)
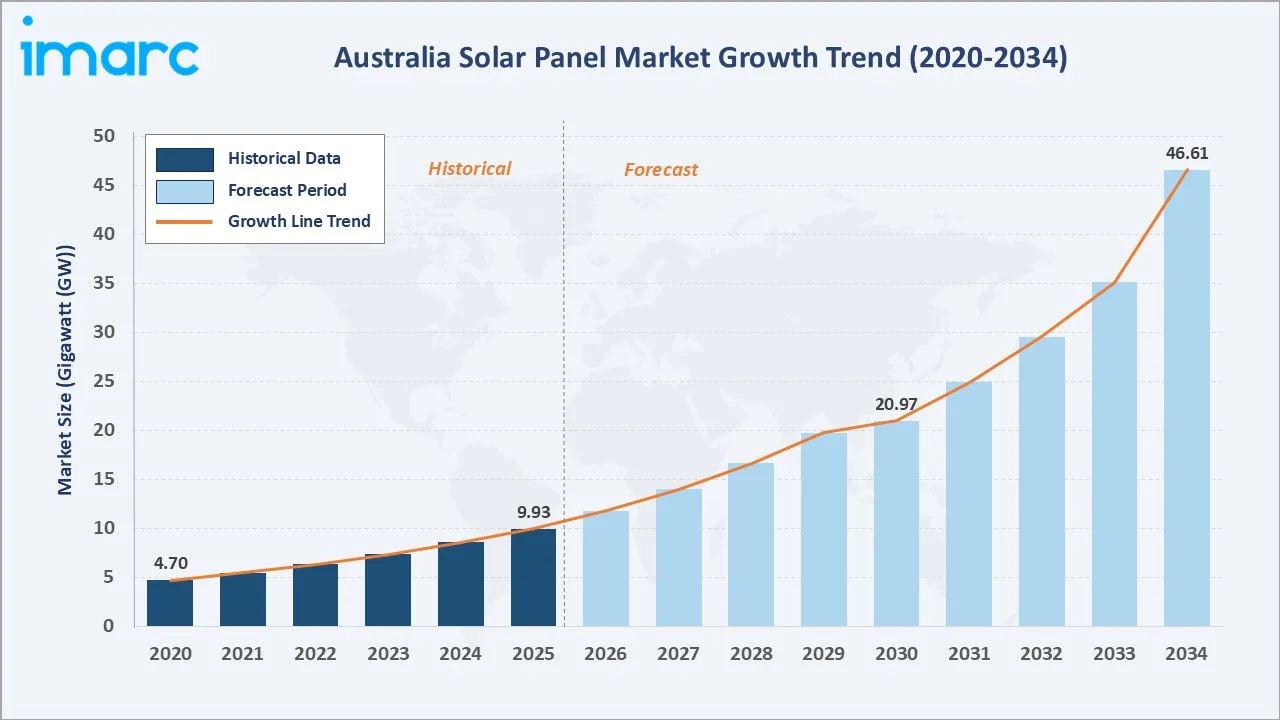
The Australia solar panel market reached 9.93 Gigawatt (GW) in 2025 and is projected to reach 46.61 GW by 2034, growing at a CAGR of 16.13% during 2026-2034. Market growth is driven by Australia's exceptional solar irradiance, rising residential and commercial electricity costs, strong government incentive programs, and the nation's accelerating transition to renewable energy under its 82% clean electricity by 2030 target.
Market Snapshot
|
Metric |
Value |
|
Market Size (2025) |
9.93 Gigawatt (GW) |
|
Forecast Market Size (2034) |
46.61 Gigawatt (GW) |
|
CAGR (2026-2034) |
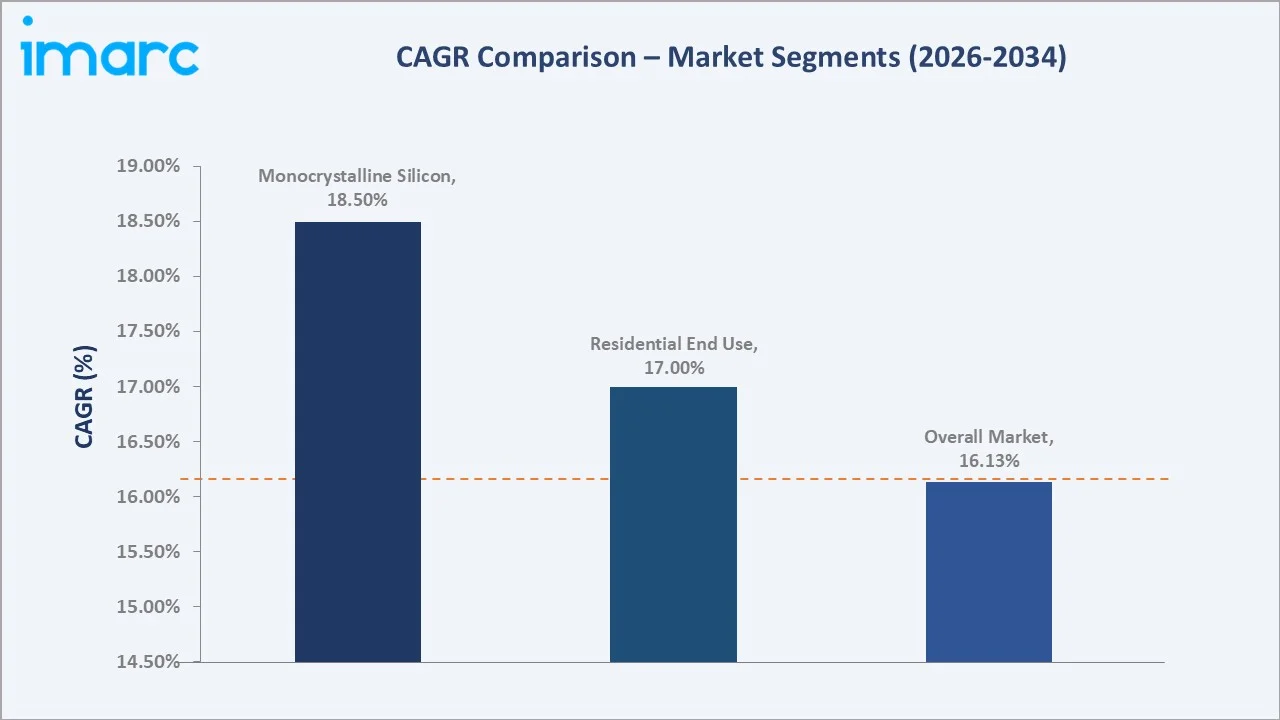
16.13% |
|
Base Year |
2025 |
|
Historical Period |
2020-2025 |
|
Forecast Period |
2026-2034 |
Australia leads the world in per-capita rooftop solar installations; approximately one in three Australian households had solar panels installed as of 2024, a penetration rate unmatched in any other country. The Australia Capital Territory & New South Wales region's 33.8% dominance reflects Sydney's large population base and the Hunter Valley's industrial solar expansion.
To get more information on this market, Request Sample
The market's exceptional 16.13% CAGR is underwritten by Australia's structural energy transition from coal-dominated generation to renewable-first electricity supply. The federal government's 82% renewable energy target by 2030 requires approximately 60 GW of new solar and wind capacity, creating a mandated, policy-guaranteed demand pipeline that underpins market growth through the forecast period regardless of energy price cycles.
Executive Summary
The Australia solar panel market is among the world's fastest-growing solar markets by CAGR, powered by unrivalled solar resources, regulatory certainty, and the broadest residential solar penetration of any developed market. From 9.93 GW in 2025, the market is forecast to reach 46.61 GW by 2034, adding 36.68 GW of incremental installed solar capacity at a 16.13% CAGR.
Residential end use leads at 46.3% in 2025, driven by Australia's world-record household solar penetration supported by the Small-scale Renewable Energy Scheme (SRES) rebates and state-level feed-in tariffs. Monocrystalline silicon panels command a 41.6% technology share, reflecting the market's transition toward high-efficiency N-type cell technologies that maximize output on limited Australian residential rooftop footprints.
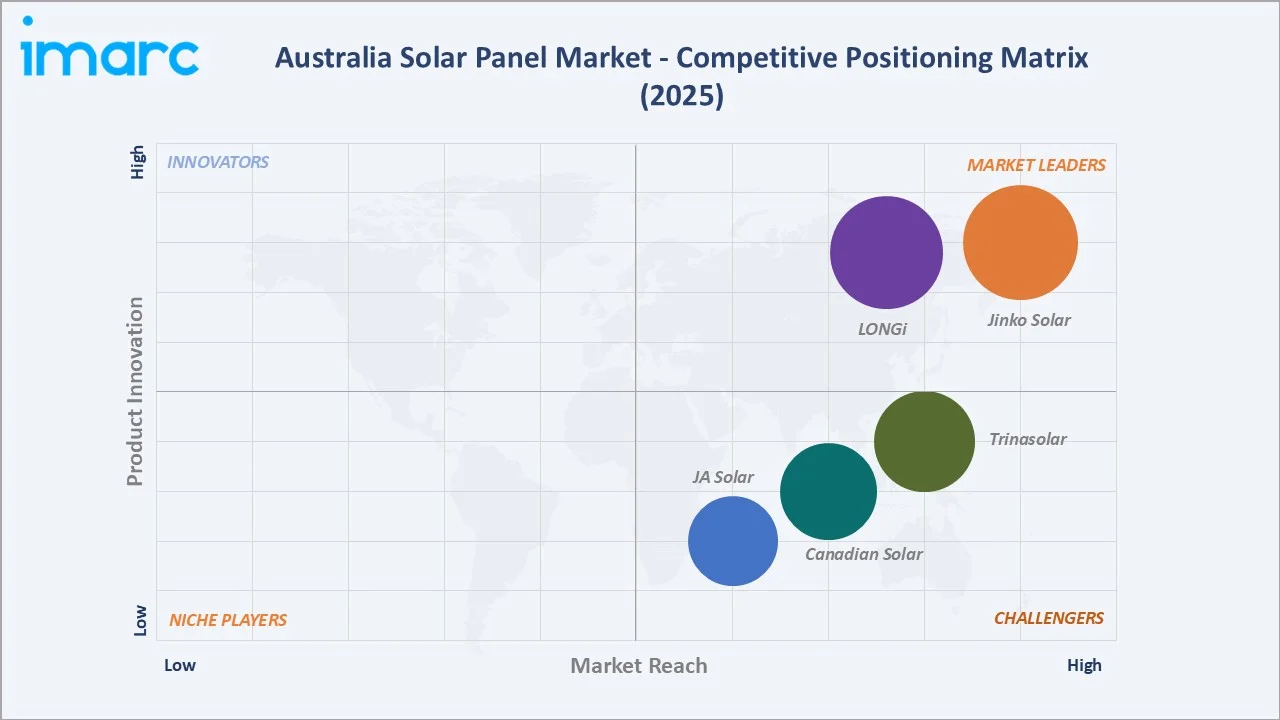
Key players, including Jinko Solar, LONGi, Trinasolar, Canadian Solar, and JA Solar, supply the Australian market predominantly through import and distribution partnerships with CEC-accredited Australian solar retailers and installers, competing on module efficiency, price-per-watt, warranty terms, and brand recognition among Australian homeowners and commercial buyers.
Key Market Insights
|
Insight |
Data |
|
Largest End Use |
Residential – 46.3% share (2025) |
|
Fastest Growing End Use |
Residential – ~17.0% CAGR; Industrial accelerating via utility-scale |
|
Largest Type Segment |
Monocrystalline Silicon – 41.6% share (2025) |
|
Fastest Growing Type |
Monocrystalline Silicon – ~18.5% CAGR (higher efficiency premium) |
|
Leading Region |
Australia Capital Territory & New South Wales– 33.8% share (2025) |
|
Top Companies |
Jinko Solar, LONGi, Trinasolar, Canadian Solar, and JA Solar |
Key Analytical Observations:
- Residential installations at 46.3% reflect Australia's extraordinary household solar adoption rate. ARENA (Australian Renewable Energy Agency) data confirms that Australia leads the world in rooftop solar per capita. The federal SRES scheme provides Small-scale Technology Certificates (STCs) and reduces the upfront cost of installing renewable energy systems.
- Monocrystalline silicon panels at 41.6% are the dominant technology, preferred for their higher conversion efficiency over polycrystalline equivalents. Australia's high-irradiance environment rewards higher-efficiency panels with proportionally greater energy output, making the premium cost of monocrystalline technology a sound investment for both residential and commercial buyers.
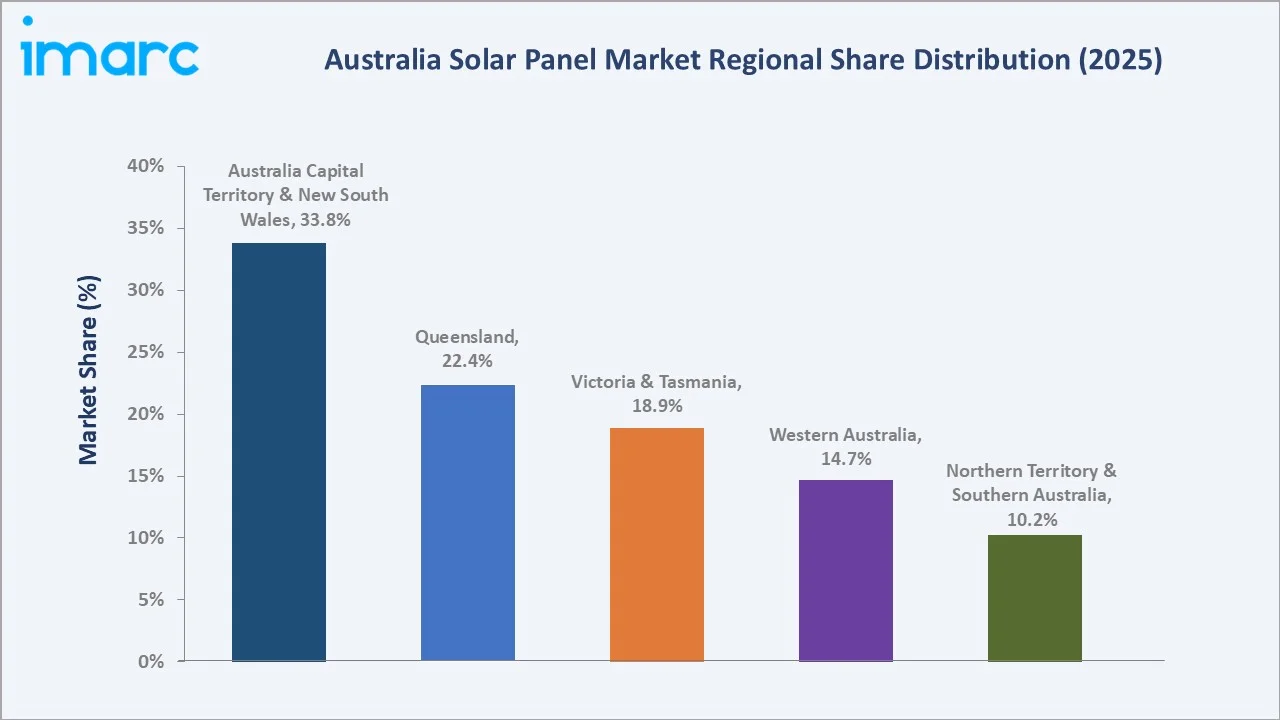
- The Australia Capital Territory & New South Wales region at 33.8% is the largest market by installed capacity, anchored by Sydney's population of 5+ million and the large stock of suitable residential rooftops. The Australia Capital Territory has one of the nation's highest solar penetration rates at 35.62% of households, supported by the ACT government's 100% renewable electricity target achieved ahead of schedule.
- Queensland's 22.4% share is driven by the state's highest annual solar irradiance levels, averaging 5-6 peak sun hours per day across most of the state compared to the national average of 4.5, which maximizes energy yield and financial return from solar installations.
Australia Solar Panel Market Overview
Australia's solar panel market encompasses the installation of photovoltaic (PV) solar panels across residential rooftops, commercial and industrial facilities, and utility-scale ground-mounted solar farms. The market spans all PV technology types, monocrystalline silicon (mono-Si), polycrystalline silicon (poly-Si), crystal silicon, thin film, and emerging technologies, and all installation scales from sub-5 kW residential systems to 1,000+ MW utility solar farms in designated renewable energy zones.
Australia's solar market operates within one of the world's most favorable policy frameworks: the federal SRES scheme, state-level solar rebate programs, net metering and feed-in tariffs, and large-scale renewable energy zone infrastructure investment. The market's supply chain is predominantly China-sourced for panels, with Australian value-add in CEC-accredited installation, inverter programming, grid connection, and increasingly battery energy storage system (BESS) integration.
Market Dynamics
To evaluate market opportunities, Request Sample
Market Drivers
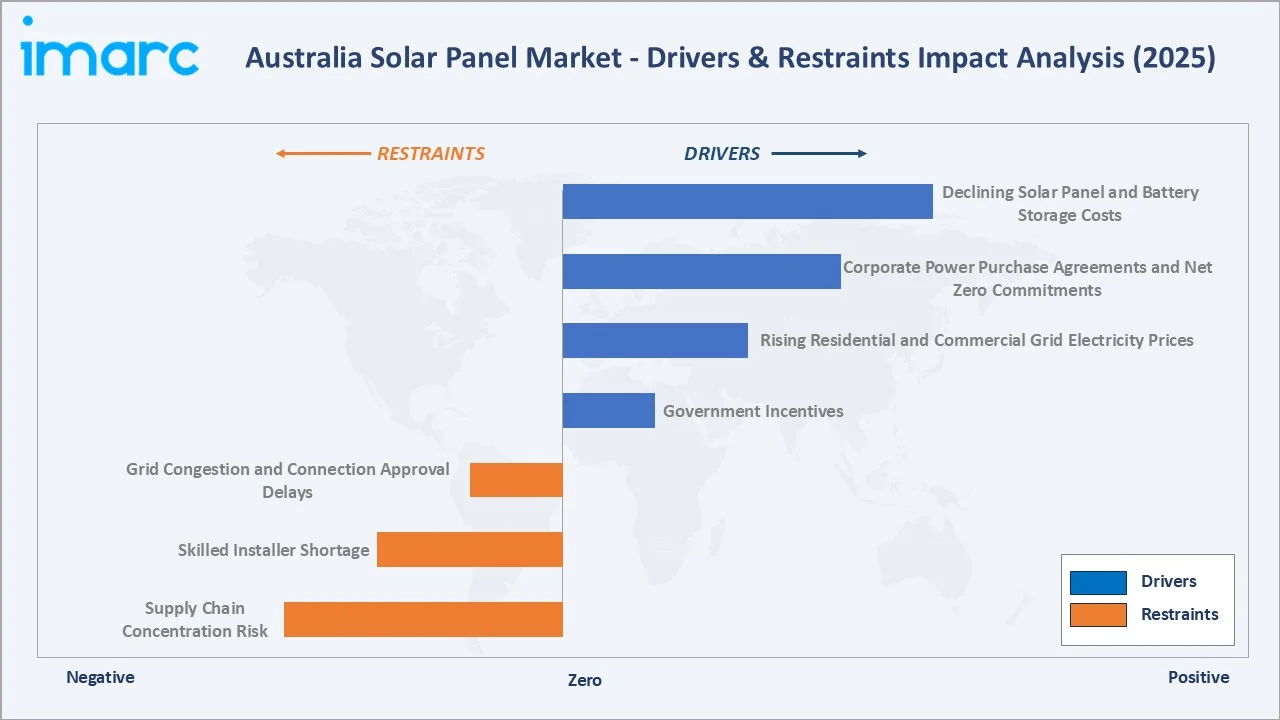
- Government Incentives: Australia's Small-scale Renewable Energy Scheme provides STCs that reduce the upfront cost of solar installations by approximately 30–40% on typical systems. Victoria's Solar Homes program offers additional AUD 1,400 rebates for eligible households, and Queensland's Solar for Rentals scheme is expanding access to renters.
- Rising Residential and Commercial Grid Electricity Prices: Average quarterly prices ranged from AUD 50 per MWh in Victoria to AUD 144 per MWh in South Australia, among the highest of any developed economy.
- Corporate Power Purchase Agreements and Net Zero Commitments: Major Australian corporates including BHP, Rio Tinto, Commonwealth Bank, and Woolworths have announced Science-Based Targets (SBTs) requiring near-100% renewable electricity by 2030.
- Declining Solar Panel and Battery Storage Costs: Rooftop solar installation costs per kilowatt of installed capacity fell 75% from 2010-11 to 2024-25. In 2024, turnkey energy storage system prices declined by approximately 40% year-on-year, reaching USD 165/kWh. This ongoing cost deflation continuously expands the addressable market to lower-income households and smaller-scale commercial properties.
Market Restraints
- Grid Congestion and Connection Approval Delays: As distributed solar penetration exceeds 50% of households in some Australian distribution networks, grid operators are imposing export curtailment limits, time-varying feed-in tariff restrictions, and delayed connection approval processes that reduce the financial return of solar installations.
- Skilled Installer Shortage: CEC-accredited solar installer capacity is constrained by the pool of qualified electricians completing the Certificate III in Electrotechnology, limiting the pace at which installation volume can grow to match demand peaks.
- Supply Chain Concentration Risk: Approximately 80–85% of solar panels originate from Chinese manufacturers. Geopolitical tensions, anti-dumping trade measures, or supply disruptions at major Chinese solar manufacturing facilities could cause panel price spikes or availability shortfalls that constrain Australian market growth, as experienced during the 2021–2022 supply chain disruption period.
Market Opportunities
- Virtual Power Plants and Battery Integration: The deployment of solar-battery virtual power plants (VPPs), as pioneered by SA Power Networks and AGL Energy, creates a new revenue stream for solar households, wholesale market participation revenues that supplement retail feed-in tariffs.
- Rewiring the Nation Program: The Australian Government has committed AUD 20 billion to the Clean Energy Finance Corporation (CEFC) to support Rewiring the Nation, a program that provides concessional finance to modernize the electricity grid and develop new and upgraded transmission infrastructure.
Market Challenges
- Solar Panel Waste Management: Australia currently lacks comprehensive solar panel recycling infrastructure, and the absence of a national PV recycling obligation creates environmental liability risk that may attract regulatory requirements, adding cost to the solar value chain.
- Consumer Price Erosion from Low-Quality Imports: The competitive pressure from ultra-low-cost solar panel imports from smaller Chinese manufacturers is compressing installer margins and incentivizing some installers to prioritize price over quality.
Emerging Market Trends
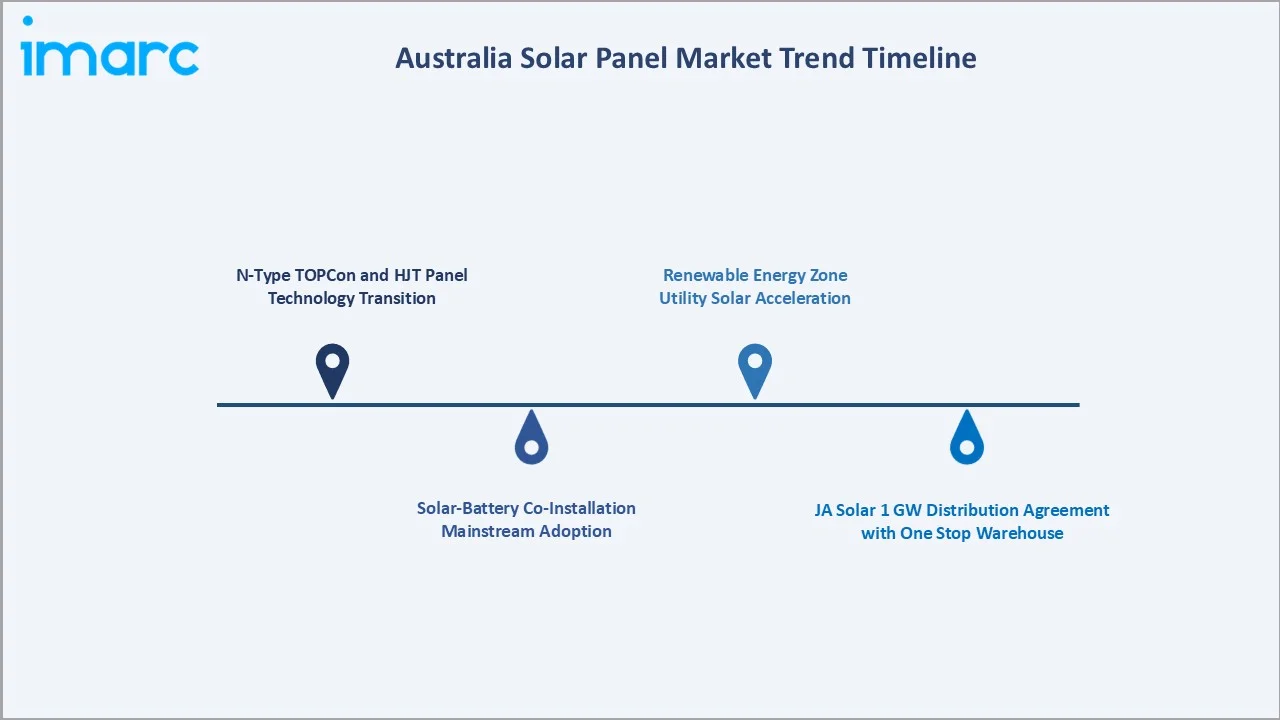
1. N-Type TOPCon and HJT Panel Technology Transition
Australian installers are rapidly transitioning from P-type PERC monocrystalline to N-type TOPCon and Heterojunction (HJT) technologies offering 21.5–23.5% module efficiency. Jinko Solar's Tiger Neo and LONGi's Hi-MO 6 captured a rapidly growing share of Australian residential installations in 2024–2025. N-type technologies offer lower temperature coefficients and lower Light-Induced Degradation (LID), delivering 3–5% more lifetime energy output than P-type equivalents.
2. Solar-Battery Co-Installation Mainstream Adoption
The proportion of new solar installations co-installed with battery storage reached approximately 25% in 2025 and is forecast to exceed 60% by 2030 as battery prices approach AUD 1,000/kWh installed. Battery storage transforms the solar value proposition from grid-export optimization to household energy independence, addressing the time-of-use tariff structures that reduce the value of daytime solar exports in most Australian distribution networks.
3. JA Solar 1 GW Distribution Agreement with One Stop Warehouse
In September 2024, JA Solar and One Stop Warehouse (OSW) signed a 1 GW PV module distribution agreement covering 2025–2027, the largest single-brand Australian solar distribution contract on record. This agreement secured JA Solar's position in Australia's largest distribution channel and signaled the market's maturation toward large-volume supply chain agreements that provide installer pricing certainty and supply reliability.
4. Renewable Energy Zone Utility Solar Acceleration
Australia's coordinated Renewable Energy Zone (REZ) planning framework is streamlining the development approval and grid connection of utility-scale solar farms in designated high-resource corridors including NSW's Central-West Orana REZ, Queensland's Central Queensland REZ, and WA's Collie REZ.
Industry Value Chain Analysis
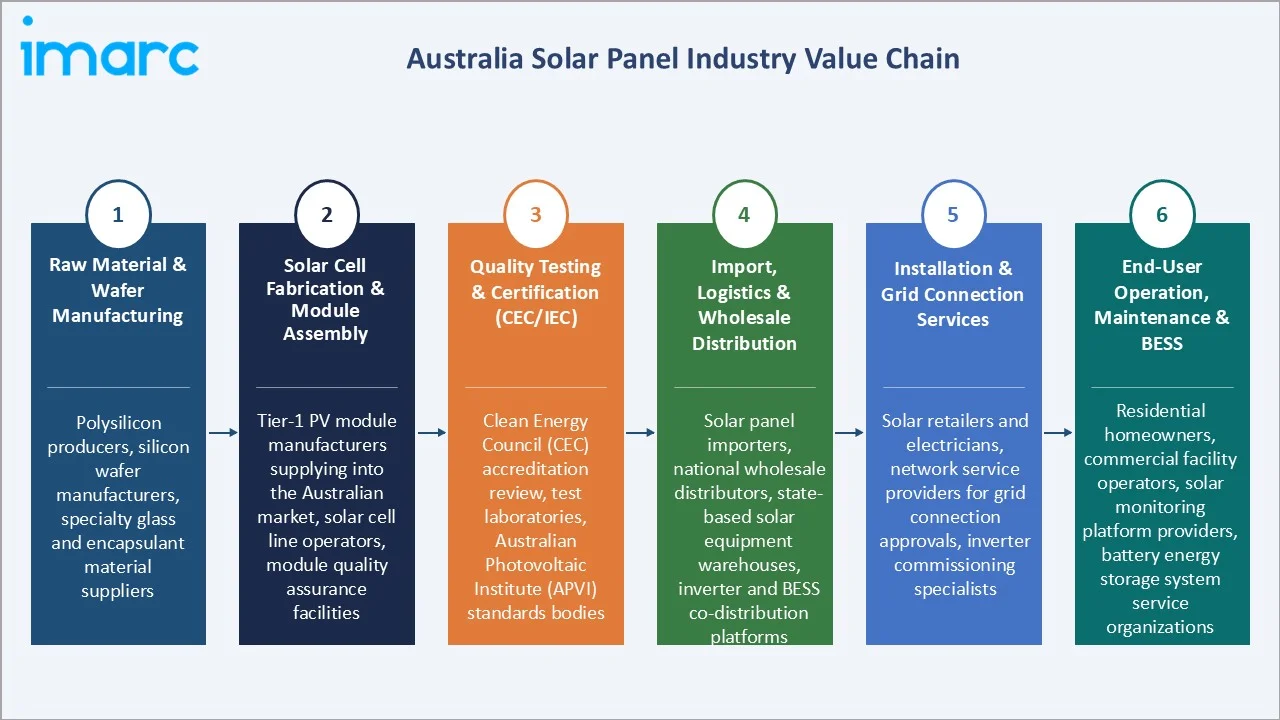
Australia's solar panel value chain extends from overseas semiconductor and module manufacturing through CEC-accredited domestic installation and long-term monitoring, with domestic value-add concentrated in distribution, installation, and battery integration services.
|
Stage |
Key Players / Examples |
|
Raw Material & Wafer Manufacturing |
Polysilicon producers, silicon wafer manufacturers, specialty glass and encapsulant material suppliers |
|
Solar Cell Fabrication & Module Assembly |
Tier-1 PV module manufacturers supplying into the Australian market, solar cell line operators, module quality assurance facilities |
|
Quality Testing & Certification (CEC/IEC) |
Clean Energy Council (CEC) accreditation review, test laboratories, Australian Photovoltaic Institute (APVI) standards bodies |
|
Import, Logistics & Wholesale Distribution |
Solar panel importers, national wholesale distributors, state-based solar equipment warehouses, inverter and BESS co-distribution platforms |
|
Installation & Grid Connection Services |
Solar retailers and electricians, network service providers for grid connection approvals, inverter commissioning specialists |
|
End-User Operation, Maintenance & BESS |
Residential homeowners, commercial facility operators, solar monitoring platform providers, battery energy storage system service organizations |
Technology Landscape in the Australia Solar Panel Industry
Monocrystalline Silicon (Mono-Si) Technology
Monocrystalline silicon panels hold a 41.6% market share in 2025, the dominant technology in the Australian market. The latest N-type TOPCon monocrystalline platforms from Jinko Solar (Tiger Neo), LONGi (Hi-MO 6), and Trinasolar (Vertex N) achieve module efficiencies of 21.5–23.5% and power outputs of 400–700 W per panel. These specifications maximize energy harvest from Australian residential rooftops, making higher-efficiency monocrystalline panels the preferred specification for installers seeking to maximize system output within constrained roof space.
Polycrystalline Silicon (Poly-Si) Technology
Polycrystalline silicon panels hold a 24.8% share in 2025, in structural decline as monocrystalline prices have fallen to near-parity. Poly-Si panels remain specified in cost-sensitive commercial and industrial utility-scale installations where efficiency per square meter is less critical than lowest installed cost per watt.
Crystal Silicon and Thin Film Technologies
Crystal silicon at 18.7% serves ground-mount solar farms where bifacial rear-side generation increases annual yield by 8–15%. Thin film at 9.9% is concentrated in utility-scale applications where CdTe technology is preferred for low-light and high-temperature performance in specific Australian climate zones.
Market Segmentation Analysis
The report covers the following segments:
|
Segment Category |
Leading Segment |
Market Share |
Year |
|
End Use |
Residential |
46.3% |
2025 |
|
Type |
Monocrystalline Silicon |
41.6% |
2025 |
|
Region |
ACT & New South Wales |
33.8% |
2025 |

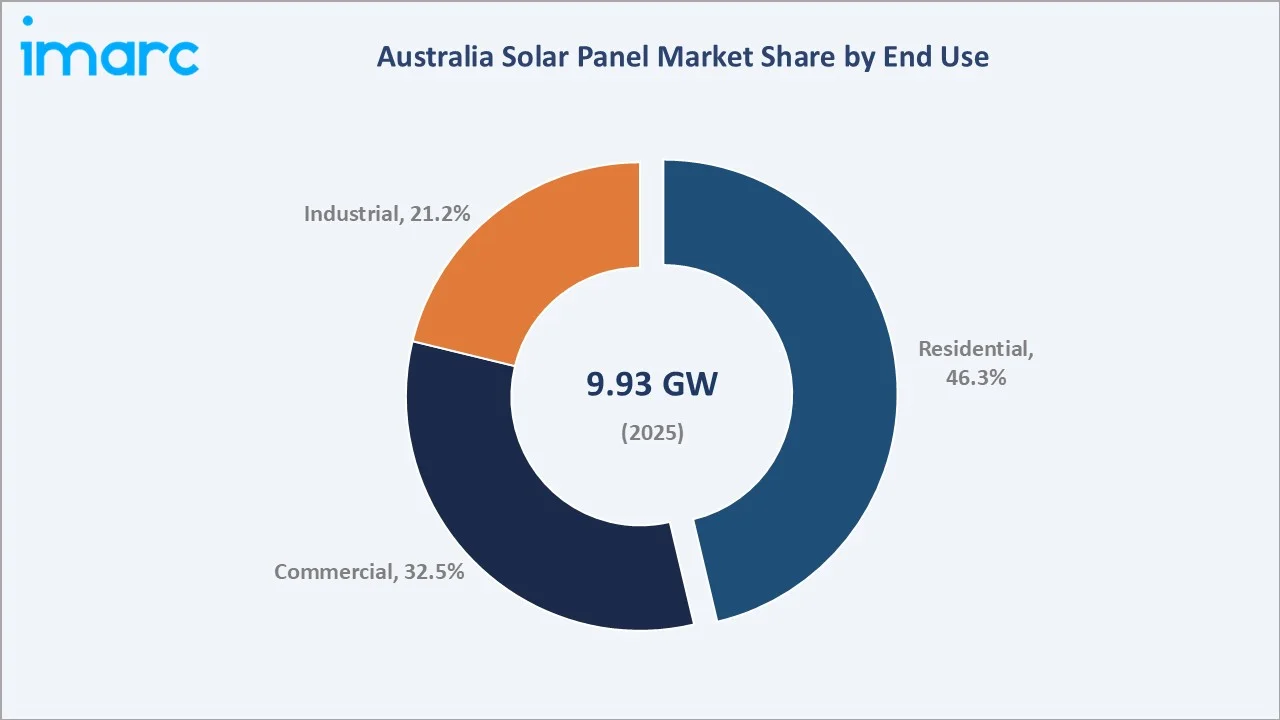
By End Use
Residential installations lead with a 46.3% market share in 2025. Australia's record household solar penetration is the primary demand driver. According to the Clean Energy Council, rooftop solar accounted for 12.8% of Australia’s electricity generation in the first half of 2025, and is on track to meet its 2030 rooftop solar targets.
To access detailed market analysis, Request Sample
Commercial end use at 32.5% encompasses small business premises, shopping centers, schools, hospitals, and large commercial facilities deploying rooftop solar to reduce operating costs and meet net zero commitments. Industrial installations at 21.2% include mining operations, manufacturing facilities, and large-scale utility solar farms connected to the National Electricity Market (NEM).
By Type
Monocrystalline silicon dominates with a 41.6% share in 2025 and is growing fastest at approximately 18.5% CAGR as N-type TOPCon and HJT technologies displace P-type PERC across all market segments. Australia's high retail electricity prices make the efficiency premium of monocrystalline panels commercially compelling, delivering payback on the technology premium within 2–3 years.
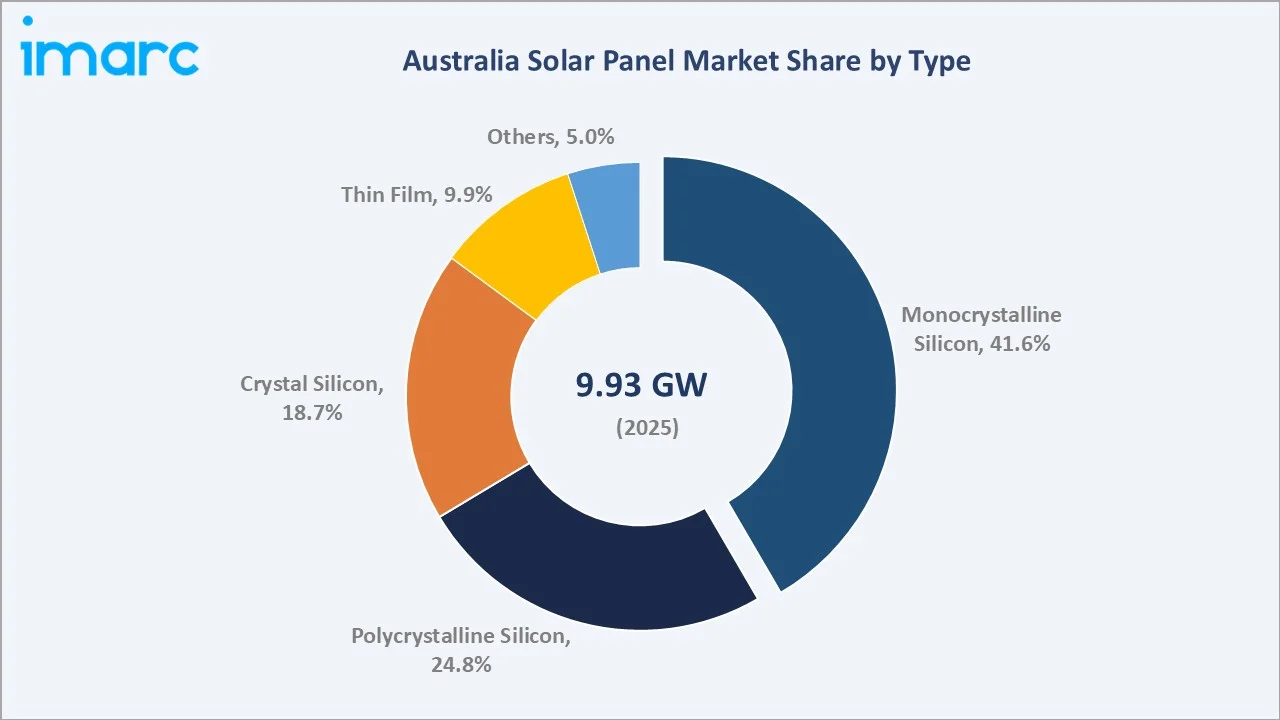
Polycrystalline silicon at 24.8% is in structural decline, losing share to monocrystalline as price parity narrows. Crystal silicon at 18.7% is gaining in utility-scale applications. Thin film panels at 9.9% maintain a niche in utility-scale First Solar CdTe projects, while others (5.0%) include emerging bifacial glass-glass modules and perovskite-silicon tandem cells entering early commercialization.
Regional Market Insights
Australia Capital Territory & New South Wales region leads with a 33.8% market share in 2025. Sydney's large population base and NSW's expanding renewable energy zones in the Central West, New England, and Hunter Valley create both residential rooftop and utility-scale solar demand. The ACT's world-leading 50%+ household solar penetration demonstrates the upper bound achievable under optimal policy conditions.
South Australia (within the Northern Territory & Southern Australia) is a global benchmark for solar-battery-grid integration, having achieved 100% renewable generation across multiple 30-minute intervals in 2024 and operating the world's largest virtual power plant network, with learnings directly shaping grid management in NSW, Victoria, and Queensland.
|
Region |
Share (2025) |
Key Growth Drivers |
|
Australia Capital Territory & New South Wales |
33.8% |
High residential density, elevated electricity tariffs, supportive renewable energy zone policies, and strong government commitments to clean energy targets driving sustained solar investment |
|
Queensland |
22.4% |
Favorable solar irradiance levels, rising household cooling demand boosting residential adoption, renewable energy zone development, and an expanding utility-scale solar project pipeline |
|
Victoria & Tasmania |
18.9% |
Dense urban rooftop potential, expanding interstate transmission infrastructure, and growing renewable energy export ambitions |
|
Western Australia |
14.7% |
Strong solar resource potential, rising residential uptake, industrial demand for diesel displacement in the mining sector, and a standalone utility-scale solar development pipeline |
|
Northern Territory & Southern Australia |
10.2% |
Advanced grid flexibility initiatives, growing virtual power plant (VPP) adoption, abundant solar resources, remote community solar deployment, and progressive battery-storage integration policies |
Competitive Landscape
The Australia solar panel supply market is highly concentrated at the manufacturing level, with Chinese tier-1 manufacturers supplying an estimated 85–90% of installed panel capacity. Jinko Solar, LONGi, Trinasolar, and Canadian Solar collectively hold an estimated 45–55% of Australian solar panel installation volume.
|
Company Name |
Brand |
Market Position |
Core Strength |
|
Jinko Solar |
Tiger Neo 3.0, Tiger Pro |
Market Leader |
Advanced N-type TOPCon technology, broad locally-approved module range, established distribution partnerships, and strong installer preference |
|
LONGi |
Hi-MO 5, Hi-MO 6, Hi-MO X6 |
Market Leader |
High-efficiency TOPCon platform, large-scale mono-Si wafer production capability, leading module efficiency pipeline, and significant global R&D investment |
|
Trinasolar |
Vertex |
Strong Challenger |
N-type TOPCon module series, multiple efficiency milestones, strong local accreditation portfolio, and a competitive commercial product range |
|
Canadian Solar |
HiKu6, TOPHiKu6, BiHiKu, TOPBiHiKu |
Strong Challenger |
Large-format module offerings, extensive global delivery track record, and active involvement in regional utility-scale project development |
|
JA Solar |
DeepBlue 5.0 and DeepBlue 4.0 Pro |
Challenger |
Established local distribution agreements, advanced bifacial module range, and a strong commercial portfolio targeting the utility-scale solar segment |
Competition centers on module efficiency, price-per-watt, warranty terms, CEC-approved product listing status, and distributor relationship depth.
Key Company Profiles
Jinko Solar
Jinko Solar is the world's largest PV module manufacturer and the most widely installed solar panel brand in Australia. Jinko Solar's Tiger Neo N-type TOPCon platform is one of the leading technology specifications for Australian residential and commercial installations.
- Product Portfolio: Tiger Neo N-Type TOPCon, Tiger Pro PERC, and Bifacial Tiger Neo for ground-mount installations in Australian utility solar farms.
- Recent Developments: In October 2025, Jinko Solar launched its Tiger Neo 3.0 48-cell rooftop module and SunGiga 261 kWh liquid-cooled energy storage system at All Energy Australia 2025, targeting Australia’s distributed solar market.
- Strategic Focus: Tiger Neo global volume scale-up, Australian residential premium brand positioning, utility-scale bifacial module supply to REZ projects, and next-generation TOPCon 2.0 technology introduction for the 2026 Australian season.
LONGi
LONGi is one of the world's largest monocrystalline silicon wafer and module producers. LONGi's vertically integrated supply chain gives it unique cost and quality control advantages that support its competitive pricing in the Australian market.
- Product Portfolio: Hi-MO 5M PERC (residential) and Hi-MO X6 bifacial for utility-scale.
- Recent Developments: In May 2026, LONGi and Origin signed an MOU to expand collaboration on commercial solar supply, customer engagement, and market development across Australia’s commercial and industrial energy sector.
- Strategic Focus: Mono-Si global leadership, Hi-MO 6 Australian market penetration, BC (Back Contact) solar cell technology R&D differentiation, and strategic partnerships with major Australian solar retailers for volume supply agreements.
Market Concentration Analysis
The Australian solar panel market is highly concentrated at the manufacturing level, with Chinese tier-1 manufacturers supplying approximately 85–90% of installed capacity. Jinko Solar and LONGi together account for an estimated 30–35% of Australian panel installations. Concentration at the distribution level is also significant.
The installation market is highly fragmented, with approximately 4,000+ CEC-accredited solar retailers and installers operating nationally. Consolidation at the retail and installation level is underway, with larger national installers growing share through consumer brand recognition, national warranty programs, and volume purchasing advantages.
Investment & Growth Opportunities
Fastest Growing Segments
Monocrystalline N-type TOPCon and HJT (~18.5% CAGR), utility-scale solar farm installations in REZs, solar-battery co-installation, and agrivoltaic systems represent the highest-growth investment vectors through 2034. The 46.61 GW installed capacity target implies approximately 4–5 GW of new annual installations by 2034, requiring proportional growth in Australian installation capacity, grid infrastructure, and panel supply chain.
Emerging Market Expansion
Western Australia's mining sector represents a significant incremental solar opportunity as major miners replace diesel generation with solar-battery-wind hybrid systems at remote operations. Fortescue's commitment to green iron production by 2030 implies 3+ GW of dedicated solar capacity for Pilbara operations alone.
Venture and Institutional Investment Trends
- Clean Energy Finance Corporation (CEFC) committed AUD 1+ Billion to solar and storage projects in FY2024–2025, providing concessional debt for utility-scale solar farms and commercial-scale solar-battery projects that de-risk institutional solar investment.
- Battery storage co-located with solar farms is attracting significant infrastructure fund investment from IFM Investors, AustralianSuper, and Macquarie Group, as the combination of solar generation and battery storage enables participation in both energy and ancillary services markets.
Future Market Outlook (2026-2034)
The Australia solar panel market is positioned for sustained, policy-backed, exponential growth through 2034. From 9.93 GW in 2025, the market will reach 46.61 GW by 2034, adding 36.68 GW of cumulative installed solar capacity at a 16.13% CAGR. This trajectory is secured by Australia's bipartisan commitment to renewable energy targets, the compelling economics of solar at current tariff levels, and the accelerating pace of utility-scale REZ project development.
Solar-battery co-installation will become the default residential specification, and utility-scale solar farms co-located with BESS will account for a growing share of total capacity additions as Australia builds toward a near-100% renewable grid.
Research Methodology
Primary Research
Primary research comprised interviews with over 80 industry participants in 2024–2025, including solar panel distributors, CEC-accredited installers, utility-scale developers, grid planners, and energy policy specialists across all Australian states. Expert input validated market sizing, technology adoption trends, and regional deployment dynamics.
Secondary Research
Secondary research encompassed AEMO generation statistics, CEC solar installation data, APVI solar map data, Clean Energy Regulator STC creation data, ARENA project database, panel manufacturer annual reports, and trade publications including SolarQuotes, RenewEconomy, PV Magazine Australia, and the Clean Energy Council's annual Solar Report.
Forecasting Models
Market size estimations used bottom-up forecasting incorporating annual residential, commercial, and utility-scale installation volumes, average system size per segment, replacement and upgrade demand modelling, and government-confirmed pipeline data from the AEMO ISP and state-level REZ project registers.
Australia Solar Panel Market Report Coverage:
| Report Features | Details |
|---|---|
| Base Year of the Analysis | 2025 |
| Historical Period | 2020-2025 |
| Forecast Period | 2026-2034 |
| Units | Gigawatt |
| Scope of the Report |
Exploration of Historical Trends and Market Outlook, Industry Catalysts and Challenges, Segment-Wise Historical and Future Market Assessment:
|
| Types Covered | Crystal Silicon, Monocrystalline Silicon, Polycrystalline Silicon, Thin Film, Others |
| End Uses Covered | Commercial, Residential, Industrials |
| Regions Covered | Australia Capital Territory & New South Wales, Victoria & Tasmania, Queensland, Northern Territory & Southern Australia, Western Australia |
| Companies Covered | Jinko Solar, LONGi, Trinasolar, Canadian Solar, JA Solar, etc. |
| Customization Scope | 10% Free Customization |
| Post-Sale Analyst Support | 10-12 Weeks |
| Delivery Format | PDF and Excel through Email (We can also provide the editable version of the report in PPT/Word format on special request) |
Key Benefits for Stakeholders:
- IMARC’s industry report offers a comprehensive quantitative analysis of various market segments, historical and current market trends, market forecasts, and dynamics of the Australia solar panel market from 2020-2034.
- The research report provides the latest information on the market drivers, challenges, and opportunities in the Australia solar panel market.
- Porter's five forces analysis assist stakeholders in assessing the impact of new entrants, competitive rivalry, supplier power, buyer power, and the threat of substitution. It helps stakeholders to analyze the level of competition within the Australia solar panel industry and its attractiveness.
- Competitive landscape allows stakeholders to understand their competitive environment and provides an insight into the current positions of key players in the market.
Frequently Asked Questions About the Australia Solar Panel Market Report
The market reached 9.93 GW in 2025 and is projected to reach 46.61 GW by 2034, growing at a CAGR of 16.13%.
Australia Capital Territory & New South Wales lead with a 33.8% share in 2025, driven by Sydney's residential density, high tariffs, and NSW's expanding renewable energy zones.
Residential installations lead at 46.3% in 2025, reflecting Australia's world-record household solar penetration rate of approximately 35% of all homes.
Monocrystalline silicon panels lead at 41.6% in 2025, growing fastest at ~18.5% CAGR as N-type TOPCon and HJT technologies become the Australian market standard.
Jinko Solar, LONGi, Trinasolar, Canadian Solar, and JA Solar, are some of the major players in Australia.
Government incentives (SRES/STCs), rising electricity prices, corporate net zero commitments, and declining solar and battery storage costs are the primary drivers.
Grid congestion and connection delays, skilled installer shortages, and supply chain concentration in Chinese manufacturers are key challenges.
Battery co-installation rates reached approximately 25% in 2025 and are forecast to exceed 60% by 2030, transforming solar from a grid-export to an energy independence solution.
Need more help?
- Speak to our experienced analysts for insights on the current market scenarios.
- Include additional segments and countries to customize the report as per your requirement.
- Gain an unparalleled competitive advantage in your domain by understanding how to utilize the report and positively impacting your operations and revenue.
- For further assistance, please connect with our analysts.
 Request Customization
 Speak to an Analyst
 Request Brochure
 Inquire Before Buying
Benefits of Customization
- Personalize this research
- Triangulate with your data
- Get data as per your format and definition
- Gain a deeper dive into a specific application, geography, customer, or competitor
- Any level of personalization
Get in Touch With Us
UNITED STATES
Phone: +1-201-971-6302
INDIA
Phone: +91-120-433-0800
UNITED KINGDOM
Phone: +44-753-714-6104
Email: [email protected]
Client Testimonials


.webp)


