
Bioburden Testing Market Report by Product (Consumables, Instruments), Test Type (Aerobic Count Testing, Anaerobic Count Testing, Fungi/Mold Count Testing, Spores Count Testing, and Others), Application (Raw Material Testing, Medical Devices Testing, In-process Testing, Sterilization Validation Testing, and Others), End User (Pharmaceutical and Biotechnology Companies, Medical Device Companies, Contract Manufacturing Organizations (CMOs), Food and Beverages Companies, and Others), and Region 2026-2034
Bioburden Testing Market Size:
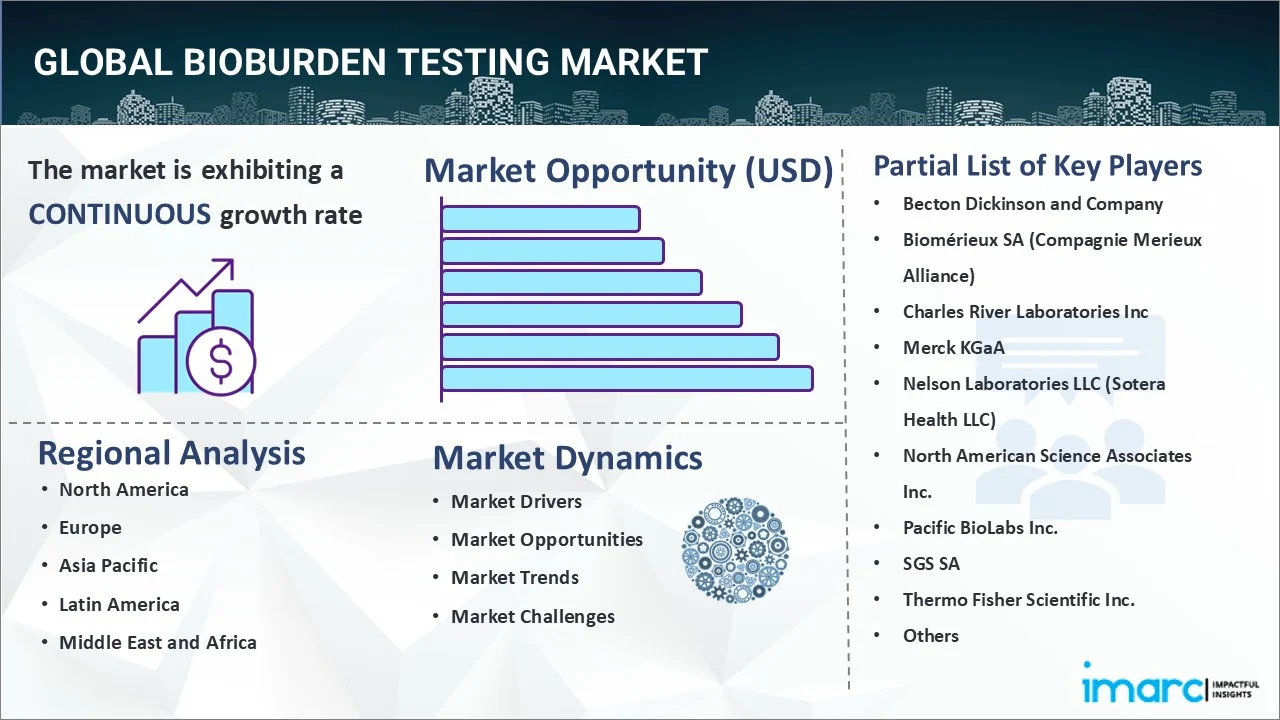
The global bioburden testing market size reached USD 1.6 Billion in 2025. Looking forward, IMARC Group expects the market to reach USD 5.2 Billion by 2034, exhibiting a growth rate (CAGR) of 13.36% during 2026-2034. The market is propelled by the increasing regulations and stringent safety standards in the pharmaceutical and biotechnology industries, rising focus on product safety and quality across numerous industries, significant advancements in microbial testing technologies, rapid expansion of the healthcare sector, and increasing adoption of automation and robotics in testing procedures.
|
Report Attribute
|
Key Statistics
|
|---|---|
|
Base Year
|
2025
|
|
Forecast Years
|
2026-2034
|
|
Historical Years
|
2020-2025
|
| Market Size in 2025 | USD 1.6 Billion |
| Market Forecast in 2034 | USD 5.2 Billion |
| Market Growth Rate 2026-2034 | 13.36% |
Bioburden Testing Market Analysis:
- Major Market Drivers: Increasing regulations and stringent safety standards within the pharmaceutical industry, increasing emphasis on product safety and quality, and developments in microbial testing technologies are some of the major factors driving the market growth.
- Key Market Trends: Growing adoption of automation and robotics in testing procedures, growing utilization of rapid microbiological methods (RMMs), and rising preference for outsourcing bioburden testing are some of the key market trends responsible for the bioburden testing market growth.
- Geographical Trends: The stringent regulatory environment, advanced healthcare infrastructure, and significant technological advancements are factors creating a positive bioburden testing market outlook.
- Competitive Landscape: Some of the major market players in the bioburden testing industry include Becton Dickinson and Company, Biomerieux SA (Compagnie Merieux Alliance), Charles River Laboratories Inc., Merck KGaA, Nelson Laboratories LLC (Sotera Health LLC), North American Science Associates Inc., Pacific BioLabs Inc, SGS SA, Thermo Fisher Scientific Inc., and Wuxi Apptec, among many others.
- Challenges and Opportunities: Some of the challenges include rising costs of bioburden testing procedures, difficulty in complying with numerous international standards, and restricted availability of skilled professionals in microbiological testing. Whereas, introduction of more cost-effective and rapid testing methods, expansion into merging markets with increasing regulatory requirements, and integration of Ai and machine learning for better data analysis and testing accuracy are some of the opportunities of the industry.
To get more information on this market Request Sample
Bioburden Testing Market Trends:
Growth in Pharmaceutical and Medical Devices Industries
The expansion of the pharmaceutical and medical devices sectors is a critical driver for the bioburden testing market. As global populations age and the prevalence of chronic diseases rises, there is an increased demand for pharmaceutical products and medical devices. For instance, the pharmaceutical industry in India is projected to reach US$ 65 Billion by 2024 and US$ 130 Billion by 2030. This demand necessitates stringent quality control measures, including thorough bioburden testing, to ensure that all products are free from harmful microbial contamination before reaching consumers. This expansion directly translates into higher demand for bioburden testing, as more products need to be evaluated to meet regulatory standards and ensure patient safety, thereby contributing to a positive bioburden testing market revenue.
Increased Focus on Outsourcing
Outsourcing bioburden testing to specialized third-party laboratories is becoming an increasingly popular strategy among pharmaceutical and medical device manufacturers. This trend is driven by the desire to reduce costs, increase operational efficiency, and leverage specialized expertise that third-party labs offer. By outsourcing, companies can focus more on their core competencies, such as product development and innovation, while ensuring that their testing needs are met by experts. According to the NATIONAL INSTITUE OF HEALTH (NIH), globally around one-third of the drug development procedures are outsourced, highlighting the growing reliance on external partners for maintaining product safety and regulatory compliance.
Rising Incidence of Hospital-Acquired Infections (HAIs)
The increasing incidence of hospital-acquired infections is another significant driver for the bioburden testing market. HAIs are infections that patients acquire during the course of receiving treatment for other conditions within a healthcare setting. As per the CENTERS FOR DISEASE CONTROL AND PREVENTION (CDC), about 1 in 31 hospital patients has at least one healthcare-associated infection, emphasizing the critical need for stringent bioburden control measures in medical settings to protect patient health. These infections are often related to surgical procedures or the use of medical devices, which must be free from microbial contamination. The demand for effective bioburden testing of medical devices, surgical instruments, and pharmaceuticals has been heightened by the need to prevent these infections.
Bioburden Testing Market Segmentation:
IMARC Group provides an analysis of the key trends in each segment of the market, along with forecasts at the global, regional, and country levels for 2026-2034. Our report has categorized the market based on product, test type, application, and end user.
Breakup by Product:
To get detailed segment analysis of this market Request Sample
- Consumables
- Culture Media
- Reagents
- Others
- Instruments
- Automated Microbial Identification Systems
- Polymerase Chain Reaction Systems
- Microscopes
- Others
Consumables accounts for the majority of the market share
The bioburden testing research report has provided a detailed breakup and analysis of the market based on the product. This includes consumables (culture media, reagents, and others), and instruments (automated microbial identification systems, polymerase chain reaction systems, microscopes, and others). According to the report, consumables represented the largest segment.
The consumables segment is the largest in the market breakup by product in bioburden testing due to their fundamental role and recurring need throughout the testing process. Consumables, which include culture media, reagents, kits, and disposable instruments, are integral to conducting bioburden tests. They are used once and then discarded, which necessitates their frequent repurchase, driving a consistent demand in the market. This recurring need contrasts with capital equipment such as autoclaves and spectrophotometers, which represent a one-time purchase and are used over a long period. Moreover, the nature of bioburden testing, which requires strict adherence to standards to avoid contamination and ensure accuracy, further amplifies the demand for high-quality, sterile consumables. Each testing cycle demands fresh consumables to maintain the integrity of the test environment and results.
Breakup by Test Type:
- Aerobic Count Testing
- Anaerobic Count Testing
- Fungi/Mold Count Testing
- Spores Count Testing
- Others
Aerobic count testing holds the largest share of the industry
A detailed breakup and analysis of the market based on the test type have also been provided in the report. This includes aerobic count testing, anaerobic count testing, fungi/mold count testing, spores count testing, and others. According to the report, aerobic count testing accounted for the largest aerobic count testing market share.
Aerobic count testing holds the largest segment in the market breakup by test type primarily due to its fundamental role in assessing the overall microbial load of samples in a wide range of industries, including pharmaceuticals, cosmetics, and food and beverage. This type of testing is crucial for determining the number of viable microorganisms that can grow and reproduce under oxygen-rich conditions. The significance of aerobic count testing stems from its ability to quickly and effectively ensure the safety and compliance of products, as the presence of aerobic microorganisms can indicate spoilage, contamination, or the potential for disease transmission.
Breakup by Application:
- Raw Material Testing
- Medical Devices Testing
- In-process Testing
- Sterilization Validation Testing
- Others
Raw material testing represents the leading market segment
The report has provided a detailed breakup and analysis of the market based on the application. This includes raw material testing, medical devices testing, in-process testing, sterilization validation testing, and others. According to the report, raw material testing represented the largest segment.
Raw material testing constitutes the largest segment in the market breakup by application primarily due to its critical role in ensuring the safety and quality of end products in industries such as pharmaceuticals, biotechnology, and medical devices. This testing is essential because impurities or contaminants in raw materials can significantly compromise the efficacy, safety, and stability of the final product. Regulatory bodies, including the FDA and EMA, enforce stringent standards that require thorough testing of all raw materials used in production to prevent any potential health risks to consumers. For instance, in the pharmaceutical industry, raw materials must be tested for a variety of contaminants including microbes, endotoxins, and particulate matter before they can be used in drug manufacturing.
Breakup by End User:
- Pharmaceutical and Biotechnology Companies
- Medical Device Companies
- Contract Manufacturing Organizations (CMOs)
- Food and Beverages Companies
- Others
Contract manufacturing organizations (CMOs) exhibits a clear dominance in the market
A detailed breakup and analysis of the market based on the end user have also been provided in the report. This includes pharmaceutical and biotechnology companies, medical device companies, contract manufacturing organizations (CMOs), food and beverages companies, and others. According to the report, contract manufacturing organizations (CMOs) accounted for the largest market share.
Contract Manufacturing Organizations (CMOs) represent the largest end user segment in the bioburden testing industry primarily due to the growing trend of outsourcing in the pharmaceutical and medical devices sectors. CMOs offer comprehensive production services, from product development through to full-scale production, including quality assurance and regulatory compliance testing such as bioburden assessment. As pharmaceutical companies and medical device manufacturers focus increasingly on core competencies such as research and product innovation, outsourcing non-core activities to CMOs enables them to optimize their resource allocation and reduce operational costs.
Breakup by Region:
To get more information on the regional analysis of this market Request Sample
- North America
- United States
- Canada
- Asia Pacific
- China
- Japan
- India
- South Korea
- Australia
- Indonesia
- Others
- Europe
- Germany
- France
- United Kingdom
- Italy
- Spain
- Russia
- Others
- Latin America
- Brazil
- Mexico
- Others
- Middle East and Africa
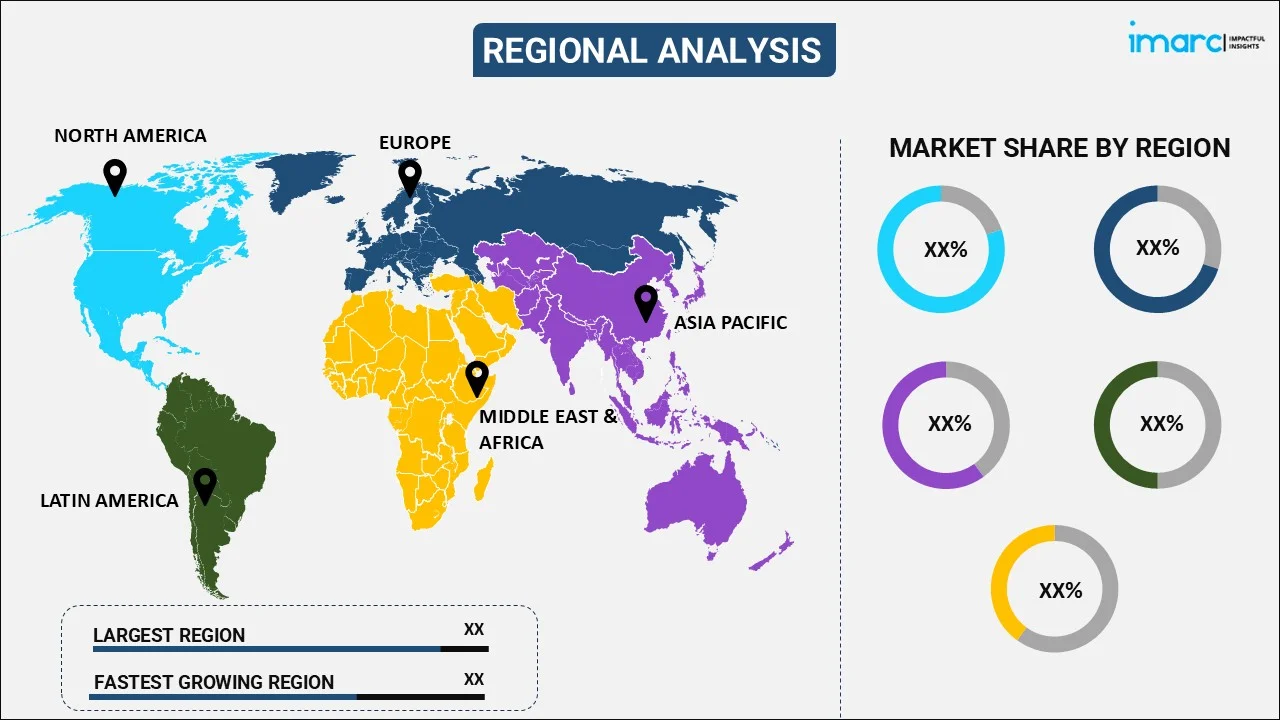
North America leads the market, accounting for the largest bioburden testing market share
The report has also provided a comprehensive analysis of all the major regional markets, which include North America (the United States and Canada); Europe (Germany, France, the United Kingdom, Italy, Spain, Russia, and others); Asia Pacific (China, Japan, India, South Korea, Australia, Indonesia, and others); Latin America (Brazil, Mexico, and others); and the Middle East and Africa. According to the report, North America was the largest regional market for bioburden testing.
North America holds the largest market share in the bioburden testing sector, primarily due to its advanced healthcare infrastructure, stringent regulatory environment, robust pharmaceutical and medical device industries, and high emphasis on healthcare quality and patient safety. The region is home to some of the largest pharmaceutical companies globally and medical device manufacturers, which are subject to rigorous regulatory standards set by agencies such as the U.S. Food and Drug Administration (FDA) and Health Canada. These agencies enforce strict guidelines that require comprehensive bioburden testing to ensure that all products are free of microbial contamination before they can be approved for market entry. Additionally, North America is a leader in technological innovation, including the development and adoption of rapid microbial methods (RMMs), which enhance the efficiency and accuracy of bioburden testing.
Competitive Landscape:
- The market research report has also provided a comprehensive analysis of the competitive landscape in the market. Detailed profiles of all major companies have also been provided. Some of the major market players in the bioburden testing industry include Becton Dickinson and Company, Biomerieux SA (Compagnie Merieux Alliance), Charles River Laboratories Inc., Merck KGaA, Nelson Laboratories LLC (Sotera Health LLC), North American Science Associates Inc., Pacific BioLabs Inc, SGS SA, Thermo Fisher Scientific Inc., and Wuxi Apptec.
(Please note that this is only a partial list of the key players, and the complete list is provided in the report.)
- Key players in the global bioburden testing market are actively driving growth through a series of strategic initiatives that cater to evolving industry demands and regulatory requirements. These companies are heavily investing in research and development to introduce innovative testing solutions that offer greater accuracy, faster results, and lower costs. Emphasizing technological advancements, they are pioneering the integration of automation and digital technologies in microbial detection, such as real-time bioburden testing and advanced data analytics, enhancing the efficiency of quality control processes. Moreover, market leaders are expanding their geographic footprint by establishing facilities and collaborations in emerging markets, which are increasingly adopting stricter regulations for pharmaceutical and medical device manufacturing. This expansion widens their market reach and also helps in navigating diverse regulatory landscapes more effectively.
Bioburden Testing Market News:
- March 21, 2024: According to the European Pharmaceutical Review, biopharma and bioprocessing experts have proposed an approach that uses a two-tiered control strategy for rapid bioburden testing, that can beneficially leverage faster detection times. It comprises of a fast (but possibly less sensitive) test for process monitoring which then initiates action for a second, longer duration test which is used to confirm and quantify the presence of bioburden and identify the microbial organism.
Bioburden Testing Market Report Scope:
| Report Features | Details |
|---|---|
| Base Year of the Analysis | 2025 |
| Historical Period | 2020-2025 |
| Forecast Period | 2026-2034 |
| Units | Billion USD |
| Scope of the Report | Exploration of Historical Trends and Market Outlook, Industry Catalysts and Challenges, Segment-Wise Historical and Future Market Assessment:
|
| Products Covered |
|
| Test Types Covered | Aerobic Count Testing, Anaerobic Count Testing, Fungi/Mold Count Testing, Spores Count Testing, Others |
| Applications Covered | Raw Material Testing, Medical Devices Testing, In-process Testing, Sterilization Validation Testing, Others |
| End Users Covered | Pharmaceutical and Biotechnology Companies, Medical Device Companies, Contract Manufacturing Organizations (CMOs), Food and Beverages Companies, Others |
| Regions Covered | Asia Pacific, Europe, North America, Latin America, Middle East and Africa |
| Countries Covered | United States, Canada, Germany, France, United Kingdom, Italy, Spain, Russia, China, Japan, India, South Korea, Australia, Indonesia, Brazil, Mexico |
| Companies Covered | Becton Dickinson and Company, Biomérieux SA (Compagnie Merieux Alliance), Charles River Laboratories Inc, Merck KGaA, Nelson Laboratories LLC (Sotera Health LLC), North American Science Associates Inc., Pacific BioLabs Inc., SGS SA, Thermo Fisher Scientific Inc., Wuxi Apptec, etc. |
| Customization Scope | 10% Free Customization |
| Post-Sale Analyst Support | 10-12 Weeks |
| Delivery Format | PDF and Excel through Email (We can also provide the editable version of the report in PPT/Word format on special request) |
Key Benefits for Stakeholders:
- IMARC’s industry report offers a comprehensive quantitative analysis of various market segments, historical and current market trends, market forecasts, and dynamics of the bioburden testing market from 2020-2034.
- The research report provides the latest information on the market drivers, challenges, and opportunities in the global bioburden testing market.
- The study maps the leading, as well as the fastest-growing, regional markets. It further enables stakeholders to identify the key country-level markets within each region.
- Porter's five forces analysis assists stakeholders in assessing the impact of new entrants, competitive rivalry, supplier power, buyer power, and the threat of substitution. It helps stakeholders to analyze the level of competition within the bioburden testing industry and its attractiveness.
- The competitive landscape allows stakeholders to understand their competitive environment and provides insight into the current positions of key players in the market.
Frequently Asked Questions About the Bioburden Testing Market Report
We expect the global bioburden testing market to exhibit a CAGR of 13.36% during 2026-2034.
The increasing demand for bioburden testing as a routine quality control process for medical devices, along with the growing focusing on producing safe products and achieving sterility assurance, is primarily driving the global bioburden testing market.
The sudden outbreak of the COVID-19 pandemic has led to the rising demand for bioburden testing to meet the sterilization requirement of medical devices for ensuring the safety of testing kits and drugs that are being developed to treat the coronavirus infection.
Based on the product, the global bioburden testing market has been segmented into consumables and instruments, where consumables currently hold the majority of the total market share.
Based on the test type, the global bioburden testing market can be divided into aerobic count testing, anaerobic count testing, fungi/mold count testing, spores count testing, and others. Currently, aerobic count testing exhibits a clear dominance in the market.
Based on the application, the global bioburden testing market has been categorized into raw material testing, medical devices testing, in-process testing, sterilization validation testing, and others. Among these, raw material testing currently accounts for the majority of the global market share.
Based on the end user, the global bioburden testing market can be segregated into pharmaceutical and biotechnology companies, medical device companies, Contract Manufacturing Organizations (CMOs), food and beverages companies, and others. Currently, Contract Manufacturing Organizations (CMOs) hold the largest market share.
On a regional level, the market has been classified into North America, Asia Pacific, Europe, Latin America, and Middle East and Africa, where North America currently dominates the global market.
Some of the major players in the global bioburden testing market include Becton Dickinson and Company, Biomérieux SA (Compagnie Merieux Alliance), Charles River Laboratories Inc, Merck KGaA, Nelson Laboratories LLC (Sotera Health LLC), North American Science Associates Inc., Pacific BioLabs Inc., SGS SA, Thermo Fisher Scientific Inc, and Wuxi Apptec.
Need more help?
- Speak to our experienced analysts for insights on the current market scenarios.
- Include additional segments and countries to customize the report as per your requirement.
- Gain an unparalleled competitive advantage in your domain by understanding how to utilize the report and positively impacting your operations and revenue.
- For further assistance, please connect with our analysts.
 Request Customization
 Speak to an Analyst
 Request Brochure
 Inquire Before Buying
Benefits of Customization
- Personalize this research
- Triangulate with your data
- Get data as per your format and definition
- Gain a deeper dive into a specific application, geography, customer, or competitor
- Any level of personalization
Get in Touch With Us
UNITED STATES
Phone: +1-201-971-6302
INDIA
Phone: +91-120-433-0800
UNITED KINGDOM
Phone: +44-753-714-6104
Email: [email protected]
Client Testimonials


.webp)


