
Biofertilizer Production Cost Analysis Report 2026: Industry Trends, Plant Setup, Machinery, Raw Materials, Investment Opportunities, Cost and Revenue
Biofertilizer Production Cost Analysis Report (DPR) Summary:
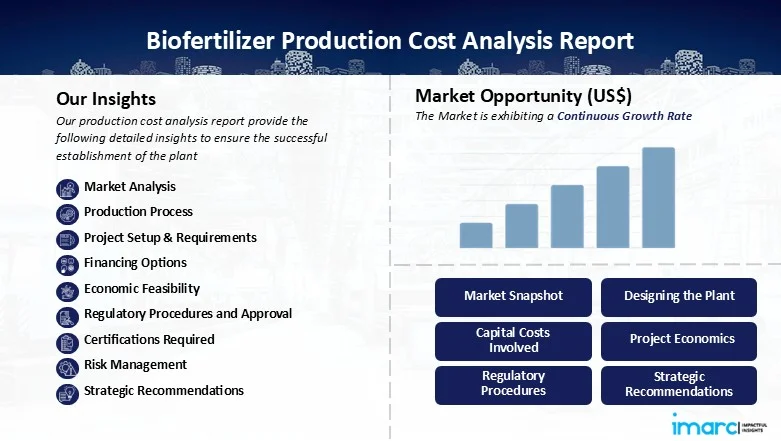
IMARC Group's comprehensive DPR report, titled "Biofertilizer Production Cost Analysis Report 2026: Industry Trends, Plant Setup, Machinery, Raw Materials, Investment Opportunities, Cost and Revenue," provides a complete roadmap for setting up a biofertilizer production unit. The biofertilizer market is driven by the increasing demand for sustainable and organic farming solutions, the rising adoption of eco-friendly agricultural practices, government initiatives promoting organic inputs, and growing awareness of soil health and crop productivity. The global biofertilizer market size was valued at USD 3.76 Billion in 2025. According to IMARC Group estimates, the market is expected to reach USD 9.33 Billion by 2034, exhibiting a CAGR of 10.6% from 2026 to 2034.
This feasibility report covers a comprehensive market overview to micro-level information such as unit operations involved, raw material requirements, utility requirements, infrastructure requirements, machinery and technology requirements, manpower requirements, packaging requirements, transportation requirements, etc.
The biofertilizer production setup cost is provided in detail, covering project economics, capital investments (CapEx), project funding, operating expenses (OpEx), income and expenditure projections, fixed costs vs. variable costs, direct and indirect costs, expected ROI, and net present value (NPV), profit and loss account, financial analysis, etc.
To gain detailed insights into the report, Request Sample
What is Biofertilizer?
Biofertilizers are natural products containing living microorganisms that are beneficial to the plants' nutrient uptake and, at the same time, are a good source of sustainable soil fertility. There are quite a few types of biofertilizers that can be found on the market such as those that are comprised of bacteria that symbiotically fix nitrogen, bacteria that dissolve phosphate, microbes that dissolve potassium, and mycorrhizal fungi. These products are said to cut chemical fertilizer dependence, yield healthier crops, keep soil in good condition, and promote the eco-friendliness of agricultural practices. Biofertilizers come in various forms, such as powder, liquid, or granules; they are suitable for application by both smallholder and large-scale farmers. The continuous application of fertilizers will always lead to the same amount of nutrients, faster plant growth, and less pollution of the environment. Due to the rising global consciousness about organic farming and sustainable agriculture practices, biofertilizers are slowly but surely being adopted in the areas of horticulture, cereals, pulses, and plantation crops, besides their commercial and ecological advantages.
Key Investment Highlights
- Process Used: Microbial cultures preparation, fermentation, blending, carrier material incorporation, quality testing, drying, packaging, and labeling.
- End-use Industries: Agriculture and horticulture, organic farming, commercial plantations, and government-supported sustainable farming projects.
- Applications: Nutrient enrichment for soil, crop growth enhancement, organic farming input, soil rehabilitation, and integrated nutrient management programs.
Biofertilizer Plant Capacity:
The proposed production facility is designed with an annual production capacity ranging between 5,000 - 10,000 MT, enabling economies of scale while maintaining operational flexibility.
Biofertilizer Plant Profit Margins:
The project demonstrates healthy profitability potential under normal operating conditions. Gross profit margins typically range between 40-50%, supported by stable demand and value-added applications.
- Gross Profit: 40-50%
- Net Profit: 15-25%
Biofertilizer Plant Cost Analysis:
The operating cost structure of a biofertilizer production cost is primarily driven by raw material consumption, particularly microbial cultures, which account for approximately 50-60% of total operating expenses (OpEx).
- Raw Materials: 50-60% of OpEx
- Utilities: 20-25% of OpEx
Financial Projection:
The financial projections for the proposed project have been developed based on realistic assumptions related to capital investment, operating costs, production capacity utilization, pricing trends, and demand outlook. These projections provide a comprehensive view of the project’s financial viability, ROI, profitability, and long-term sustainability.
Major Applications:
- Agriculture and Horticulture: Using microbial formulations, the soil is enriched, and the harvests are increased.
- Organic Farming Sector: Enables farmers to comply with organic certification standards while reducing chemical fertilizer dependency.
- Plantation and Commercial Farming: The productivity in big plantations is increased along with the nutrient uptake.
- Government-Supported Soil Management Programs: Supports initiatives for sustainable soil health and integrated nutrient management.
Why Biofertilizer Production?
✓ Growing Demand for Sustainable Agriculture: The planet's eco-friendliness is the reason for the increasing demand for inputs that are chemical-fertilizer-free.
✓ Improved Soil Health and Productivity: Biofertilizers enhance nutrient availability and microbial activity, ensuring long-term soil fertility.
✓ Expanding Organic Farming Sector: To meet the demand for biofertilizers of high quality, the area cultivated with organic crops sees the greatest growth.
✓ Customization Opportunities: Manufacturers can develop crop-specific, region-specific, or multi-nutrient formulations for targeted applications.
✓ Scalable and Cost-Efficient Production: Capital investment in fermentation and blending processes is thus moderated since they allow production volumes to be flexible.
Transforming Vision into Reality:
This report provides the comprehensive blueprint needed to transform your biofertilizer production vision into a technologically advanced and highly profitable reality.
Biofertilizer Industry Outlook 2026:
The biofertilizer market is driven by a worldwide movement towards eco-friendly farming, the adoption of organic farming practices, and regulations that favor the use of inputs that are less harmful to the environment. For instance, in 2024, World Bank-supported agriculture and food projects enabled nearly 4.7 million farmers to adopt improved, climate-smart practices, including water-efficient methods and resilient cropping systems. This shift toward sustainable farming has boosted demand for biofertilizers, driving growth in the sector as farmers seek eco-friendly solutions. The agriculture sector is getting away from synthetic fertilizers and is more inclined to the use of organic nutrient sources for the main benefits of improving soil fertility, decreasing the load on the environment, and higher agricultural yields. Moreover, governmental measures like providing financial support, subsidies, and organic farming promotions will drive the market.
Leading Biofertilizer Producers:
Leading producers in the global biofertilizer industry include several multinational companies with extensive production capacities and diverse application portfolios. Key players include:
- Gujarat State Fertilizers & Chemicals Limited (GSFC)
- IPL Biologicals Limited
- Kiwa Bio-Tech Products Group Corporation
- Madras Fertilizers Limited (MFL)
- National Fertilizers Limited (NFL)
all of which serve end-use sectors such as agriculture, horticulture, organic farming, and the commercial plantations segment.
How to Setup a Biofertilizer Production Plant?
Setting up a biofertilizer production cost requires evaluating several key factors, including technological requirements and quality assurance.
Some of the critical considerations include:
- Detailed Process Flow: The production process is a multi-step operation that involves several unit operations, material handling, and quality checks. Below are the main stages involved in the biofertilizer production process flow:
- Unit Operations Involved
- Mass Balance and Raw Material Requirements
- Quality Assurance Criteria
- Technical Tests
- Site Selection: The location must offer easy access to key raw materials such as microbial cultures and carriers. Proximity to target markets will help minimize distribution costs. The site must have robust infrastructure, including reliable transportation, utilities, and waste management systems. Compliance with local zoning laws and environmental regulations must also be ensured.
- Plant Layout Optimization: The layout should be optimized to enhance workflow efficiency, safety, and minimize material handling. Separate areas for raw material storage, production, quality control, and finished goods storage must be designated. Space for future expansion should be incorporated to accommodate business growth.
- Equipment Selection: High-quality, corrosion-resistant machinery tailored for biofertilizer production must be selected. Essential equipment includes fermenters, mixers, drying units, screening equipment, packaging machines, and quality inspection systems. All machinery must comply with industry standards for safety, efficiency, and reliability.
- Raw Material Sourcing: Reliable suppliers must be secured for raw materials like microbial cultures and carriers to ensure consistent production quality. Minimizing transportation costs by selecting nearby suppliers is essential. Sustainability and supply chain risks must be assessed, and long-term contracts should be negotiated to stabilize pricing and ensure a steady supply.
- Safety and Environmental Compliance: Safety protocols must be implemented throughout the production process of biofertilizer. Advanced monitoring systems should be installed to detect leaks or deviations in the process. Effluent treatment systems are necessary to minimize environmental impact and ensure compliance with emission standards.
- Quality Assurance Systems: A comprehensive quality control system should be established throughout production. Analytical instruments must be used to monitor product concentration, purity, and stability. Documentation for traceability and regulatory compliance must be maintained.
Project Economics:
Establishing and operating a biofertilizer production cost involves various cost components, including:
- Capital Investment: The total capital investment depends on plant capacity, technology, and location. This investment covers land acquisition, site preparation, and necessary infrastructure.
- Equipment Costs: Equipment costs, such as those for fermenters, mixers, drying units, screening equipment, packaging machines, and quality inspection systems, represent a significant portion of capital expenditure. The scale of production and automation level will determine the total cost of machinery.
- Raw Material Expenses: Raw materials, including microbial cultures and carriers, are a major part of operating costs. Long-term contracts with reliable suppliers will help mitigate price volatility and ensure a consistent supply of materials.
- Infrastructure and Utilities: Costs associated with land acquisition, construction, and utilities (electricity, water, steam) must be considered in the financial plan.
- Operational Costs: Ongoing expenses for labor, maintenance, quality control, and environmental compliance must be accounted for. Optimizing processes and providing staff training can help control these operational costs.
- Financial Planning: A detailed financial analysis, including income projections, expenditures, and break-even points, must be conducted. This analysis aids in securing funding and formulating a clear financial strategy.
Capital Expenditure (CapEx) and Operational Expenditure (OpEx) Analysis:
Capital Investment (CapEx): Machinery costs account for the largest portion of the total capital expenditure. The cost of land and site development, including charges for land registration, boundary development, and other related expenses, forms a substantial part of the overall investment. This allocation ensures a solid foundation for safe and efficient plant operations.
Operating Expenditure (OpEx): In the first year of operations, the operating cost for the biofertilizer production is projected to be significant, covering raw materials, utilities, depreciation, taxes, packing, transportation, and repairs and maintenance. By the fifth year, the total operational cost is expected to increase substantially due to factors such as inflation, market fluctuations, and potential rises in the cost of key materials. Additional factors, including supply chain disruptions, rising consumer demand, and shifts in the global economy, are expected to contribute to this increase.
.webp)
Capital Expenditure Breakdown:
| Particulars | Cost (in US$) |
|---|---|
| Land and Site Development Costs | XX |
| Civil Works Costs | XX |
| Machinery Costs | XX |
| Other Capital Costs | XX |
To access CapEx Details, Request Sample
Operational Expenditure Breakdown:
| Particulars | In % |
|---|---|
| Raw Material Cost | 50-60% |
| Utility Cost | 20-25% |
| Transportation Cost | XX |
| Packaging Cost | XX |
| Salaries and Wages | XX |
| Depreciation | XX |
| Taxes | XX |
| Other Expenses | XX |
To access OpEx Details, Request Sample
Profitability Analysis:
| Particulars | Unit | Year 1 | Year 2 | Year 3 | Year 4 | Year 5 | Average |
|---|---|---|---|---|---|---|---|
| Total Income | US$ | XX | XX | XX | XX | XX | XX |
| Total Expenditure | US$ | XX | XX | XX | XX | XX | XX |
| Gross Profit | US$ | XX | XX | XX | XX | XX | XX |
| Gross Margin | % | XX | XX | XX | XX | XX | 40-50% |
| Net Profit | US$ | XX | XX | XX | XX | XX | XX |
| Net Margin | % | XX | XX | XX | XX | XX | 15-25% |
To access Financial Analysis, Request Sample
Latest Industry Developments:
- June 2025: MVAC and DPH Biologicals introduced TerraTrove AmplAphex, a liquid biofertilizer, which received the Organic Materials Review Institute (OMRI) Listed seal for certified organic use. The product demonstrated improvements in soil structure, nutrient uptake, and crop stress resilience, supporting sustainable agriculture across the Western and Southern U.S. with verified organic certification.
- May 2025: Syngenta completed the acquisition of Intrinsyx Bio, strengthening its global leadership in the biologicals sector and expanding its biofertilizer portfolio. The deal combines Intrinsyx Bio’s nutrient use efficiency products, including NUELLO iN, with Syngenta’s R&D and commercial reach, supporting higher crop yields, sustainable farming, and growth in the fastest-growing Nutrient Use Efficiency (NUE) market.
Report Coverage:
| Report Features | Details |
|---|---|
| Product Name | Biofertilizer |
| Report Coverage | Detailed Process Flow: Unit Operations Involved, Quality Assurance Criteria, Technical Tests, Mass Balance, and Raw Material Requirements Land, Location and Site Development: Selection Criteria and Significance, Location Analysis, Project Planning and Phasing of Development, Environmental Impact, Land Requirement and Costs Plant Layout: Importance and Essentials, Layout, Factors Influencing Layout Plant Machinery: Machinery Requirements, Machinery Costs, Machinery Suppliers (Provided on Request) Raw Materials: Raw Material Requirements, Raw Material Details and Procurement, Raw Material Costs, Raw Material Suppliers (Provided on Request) Packaging: Packaging Requirements, Packaging Material Details and Procurement, Packaging Costs, Packaging Material Suppliers (Provided on Request) Other Requirements and Costs: Transportation Requirements and Costs, Utility Requirements and Costs, Energy Requirements and Costs, Water Requirements and Costs, Human Resource Requirements and Costs Project Economics: Capital Costs, Techno-Economic Parameters, Income Projections, Expenditure Projections, Product Pricing and Margins, Taxation, Depreciation Financial Analysis: Liquidity Analysis, Profitability Analysis, Payback Period, Net Present Value, Internal Rate of Return, Profit and Loss Account, Uncertainty Analysis, Sensitivity Analysis, Economic Analysis Other Analysis Covered in The Report: Market Trends and Analysis, Market Segmentation, Market Breakup by Region, Price Trends, Competitive Landscape, Regulatory Landscape, Strategic Recommendations, Case Study of a Successful Venture |
| Currency | US$ (Data can also be provided in the local currency) |
| Customization Scope | The report can also be customized based on the requirement of the customer |
| Post-Sale Analyst Support | 10-12 Weeks |
| Delivery Format | PDF and Excel through email (We can also provide the editable version of the report in PPT/Word format on special request) |
Report Customization
While we have aimed to create an all-encompassing biofertilizer production plant project report, we acknowledge that individual stakeholders may have unique demands. Thus, we offer customized report options that cater to your specific requirements. Our consultants are available to discuss your business requirements, and we can tailor the report's scope accordingly. Some of the common customizations that we are frequently requested to make by our clients include:
- The report can be customized based on the location (country/region) of your plant.
- The plant’s capacity can be customized based on your requirements.
- Plant machinery and costs can be customized based on your requirements.
- Any additions to the current scope can also be provided based on your requirements.
Why Buy IMARC Reports?
- The insights provided in our reports enable stakeholders to make informed business decisions by assessing the feasibility of a business venture.
- Our extensive network of consultants, raw material suppliers, machinery suppliers and subject matter experts spans over 100+ countries across North America, Europe, Asia Pacific, South America, Africa, and the Middle East.
- Our cost modeling team can assist you in understanding the most complex materials. With domain experts across numerous categories, we can assist you in determining how sensitive each component of the cost model is and how it can affect the final cost and prices.
- We keep a constant track of land costs, construction costs, utility costs, and labor costs across 100+ countries and update them regularly.
- Our client base consists of over 3000 organizations, including prominent corporations, governments, and institutions, who rely on us as their trusted business partners. Our clientele varies from small and start-up businesses to Fortune 500 companies.
- Our strong in-house team of engineers, statisticians, modeling experts, chartered accountants, architects, etc. has played a crucial role in constructing, expanding, and optimizing sustainable production plants worldwide.
Need more help?
- Speak to our experienced analysts for insights on the current market scenarios.
- Include additional segments and countries to customize the report as per your requirement.
- Gain an unparalleled competitive advantage in your domain by understanding how to utilize the report and positively impacting your operations and revenue.
- For further assistance, please connect with our analysts.


Factory Setup Services
IMARC Group's factory setup services streamline the entire establishment process, ensuring efficient planning, seamless execution, and optimal operational readiness for your manufacturing facility.


Site Selection Services
IMARC Group's site selection services optimize location choices for businesses, ensuring strategic, cost-effective, and efficient manufacturing operations.


Factory Audit Services
IMARC Group's plant audit services offer comprehensive evaluations of your industrial facility's health, efficiency, and regulatory compliance.


Regulatory Approvals, and Licensing Services
IMARC Group's regulatory approval and licensing services ensure businesses meet all compliance requirements, facilitating smooth and timely market entry.
 Inquire Before Buying
 Speak to an Analyst
 Request Brochure
 Request Customization
Related Reports
Frequently Asked Questions
Capital requirements generally include land acquisition, construction, equipment procurement, installation, pre-operative expenses, and initial working capital. The total amount varies with capacity, technology, and location.
To start a biofertilizer production business, one needs to conduct a market feasibility study, secure required licenses, arrange funding, select suitable land, procure equipment, recruit skilled labor, and establish a supply chain and distribution network.
Biofertilizer production requires microbial strains like Rhizobium or Azotobacter, along with carrier materials such as peat or lignite to support them. It also involves growth media, additives, and water to culture, stabilize, and package the final product effectively.
The biofertilizer factory typically requires fermenters or bioreactors for microbial cultivation, autoclaves for sterilization, and blending units for mixing carriers and cultures. Additional equipment includes filtration systems, drying units, packaging machines, and quality control instruments to ensure microbial viability and product consistency.
The main steps generally include:
-
Selection and cultivation of microbial strains
-
Preparation and sterilization of carrier materials
-
Inoculation and mixing of microbes with carriers
-
Curing and incubation
-
Packaging under sterile conditions
-
Quality testing and labelling
-
Storage and distribution
Usually, the timeline can range from 12 to 24 months to start a biofertilizer production plant, depending on factors like plant scale, equipment setup, regulatory approvals, and availability of microbial strains and infrastructure.
Challenges may include high capital requirements, securing regulatory approvals, ensuring raw material supply, competition, skilled manpower availability, and managing operational risks.
Typical requirements include business registration, environmental clearances, factory licenses, fire safety certifications, and industry-specific permits. Local/state/national regulations may apply depending on the location.
The top biofertilizer manufactures are:
-
Gujarat State Fertilizers & Chemicals Limited (GSFC)
-
IPL Biologicals Limited
-
Kiwa Bio-Tech Products Group Corporation
-
Madras Fertilizers Limited (MFL)
-
National Fertilizers Limited (NFL)
-
Rashtriya Chemicals and Fertilizers Limited (RCF)
-
Rizobacter Argentina SA (Bioceres S.A.)
-
Symborg SL (Corteva, Inc)
-
T. Stanes and Company Limited
Profitability depends on several factors including market demand, production efficiency, pricing strategy, raw material cost management, and operational scale. Profit margins usually improve with capacity expansion and increased capacity utilization rates.
Cost components typically include:
-
Land and Infrastructure
-
Machinery and Equipment
-
Building and Civil Construction
-
Utilities and Installation
-
Working Capital
Break even in a biofertilizer production business range from 3 to 5 years, depending on production scale, raw material costs, market demand, and regulatory support. Efficient operations and growing demand for organic farming can help accelerate returns.
Governments may offer incentives such as capital subsidies, tax exemptions, reduced utility tariffs, export benefits, or interest subsidies to promote production under various national or regional industrial policies.
Financing can be arranged through term loans, government-backed schemes, private equity, venture capital, equipment leasing, or strategic partnerships. Financial viability assessments help identify optimal funding routes.