
Botanical Ingredients Market Size, Share, Trends and Forecast by Source, Form, Application, and Region, 2026-2034
Botanical Ingredients Market Size and Share:
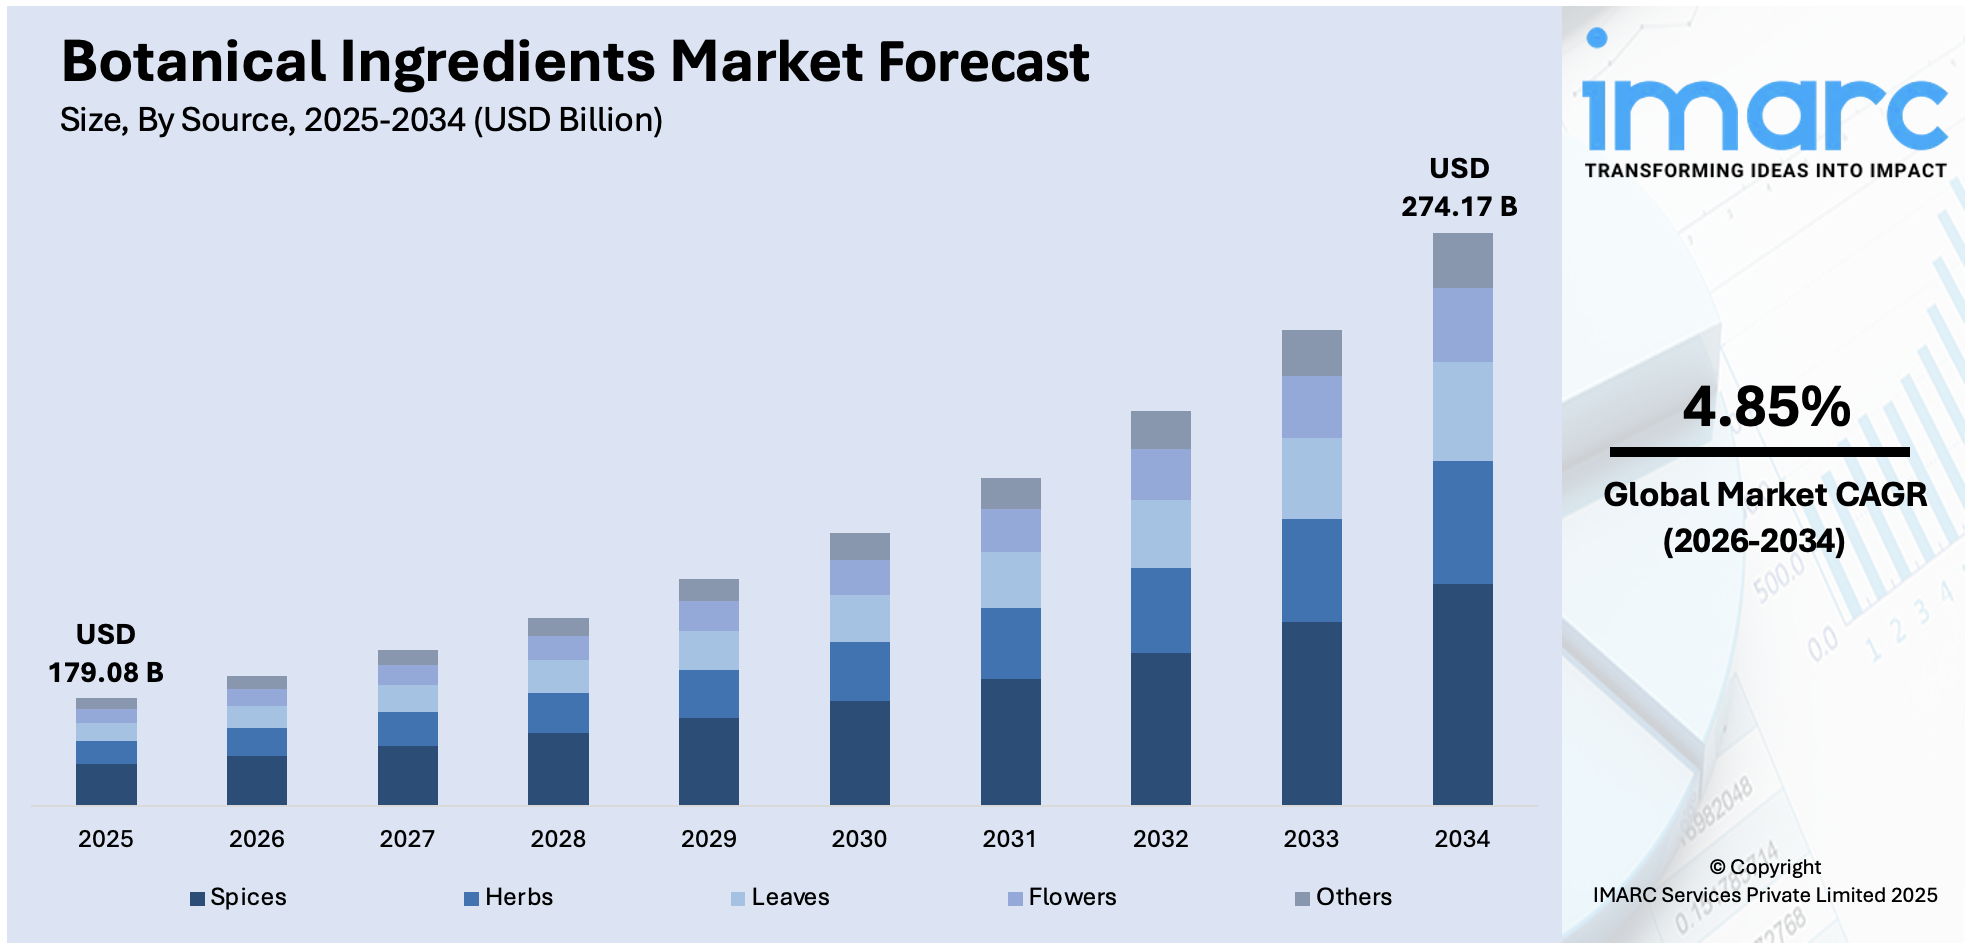
The global botanical ingredients market size was valued at USD 179.08 Billion in 2025. Looking forward, IMARC Group estimates the market to reach USD 274.17 Billion by 2034, exhibiting a CAGR of 4.85% during 2026-2034. North America currently dominates the market, holding a significant market share of 34.8% in 2025. This dominance is attributed to rising consumer demand for natural and clean-label products, a well-established nutraceutical and personal care industry, and increasing awareness of the health benefits associated with botanical-based formulations and supplements. These factors collectively and ultimately strengthen the botanical ingredients market share.
|
Report Attribute
|
Key Statistics
|
|---|---|
|
Base Year
|
2025
|
|
Forecast Years
|
2026-2034
|
|
Historical Years
|
2020-2025
|
|
Market Size in 2025
|
USD 179.08 Billion |
|
Market Forecast in 2034
|
USD 274.17 Billion |
| Market Growth Rate 2026-2034 | 4.85% |
The growth of the global botanical ingredients market is primarily driven by the increasing preference for plant-based alternatives in food, cosmetics, and pharmaceutical applications. For instance, in January 2024, Lipoid Kosmetik partnered with the NATRUE label, reinforcing its commitment to quality, sustainability, and innovation in natural and organic cosmetics. This collaboration complements the company’s existing COSMOS-compliant portfolio, with the addition of NATRUE-certified and NATRUE-approved products. NATRUE is a globally respected independent certification body known for its stringent standards on purity and transparency. The partnership enhances Lipoid Kosmetik’s credibility and supports its mission to offer authentic, high-quality natural beauty ingredients to consumers worldwide. Heightened awareness of the adverse effects associated with synthetic chemicals has prompted industries to explore safer, naturally derived components. Moreover, the expansion of clean beauty and organic food trends has amplified demand for traceable and sustainably sourced botanical inputs. Advancements in extraction technologies have also improved ingredient purity and efficacy, fostering wider adoption across sectors. In addition, the rise in lifestyle-related disorders has led consumers to seek preventive health solutions, further propelling the integration of botanical ingredients into functional foods, dietary supplements, and wellness products globally.
To get more information on this market Request Sample
The United States botanical ingredients market growth is being fueled by a surge in consumer demand for transparency and authenticity in product sourcing and composition. Regulatory support for natural and organic labeling standards has strengthened market confidence and encouraged innovation. For instance, in April 2024, Evonik Industries launched a new Botanicals & Natural Actives segment to enhance its biosolutions offering, combining expertise from legacy products and recent acquisitions. This segment focuses on meeting the increasing demand for botanical extracts and natural actives in beauty and personal care. With acquisitions like Novachem and Botanica, Evonik now offers sustainable, plant-based biotech ingredients. The segment emphasizes sustainability, traceability, and innovation, positioning Evonik as a leading global partner in the beauty and personal care market. The country’s strong research infrastructure enables rapid development of novel botanical applications in therapeutics and functional nutrition. Additionally, shifting consumer demographics, particularly among millennials and Gen Z, reflect a clear preference for wellness-centric and eco-conscious products, bolstering the inclusion of botanicals. Growth in e-commerce and direct-to-consumer health brands has also expanded access to botanical products. Moreover, the integration of traditional herbal knowledge with modern science is gaining traction, promoting broader market expansion.
Botanical Ingredients Market Trends
Increasing health awareness among consumers
The surge in health awareness among consumers across the globe is acting as a primary factor driving the market growth. According to an industry report, 84% of consumers prioritize health and wellness when buying fresh food, and 65% prefer natural ingredients in their food products. In line with this, the growing consciousness about health and wellness, where consumers are increasingly vigilant about the ingredients in their products, is supporting the market growth. Botanical ingredients, derived from plants, are perceived as safer and more beneficial for health due to their natural origin. Additionally, scientific research underscoring the health benefits of plant-based compounds, including antioxidants, vitamins, and minerals, is bolstering the market growth. Furthermore, the growing product demand spans across various sectors, such as F&B, where consumers seek natural flavorings and nutritional additives, is strengthening the market growth.
Rising demand for natural products in the cosmetics and personal care industry
The demand for natural products in the cosmetics and personal care industry, due to increasing consumer awareness of the harmful effects of synthetic chemicals and artificial additives used in traditional cosmetics, is favoring the botanical ingredients market outlook positively. Botanical ingredients, known for their gentleness and efficacy, are increasingly favored for their skin-friendly and therapeutic properties. Furthermore, consumers are becoming more informed and discerning, seeking products that are not only effective but also safe and environmentally sustainable. It has led cosmetic manufacturers to reformulate their products to include natural botanical extracts, oils, and essences, catering to the growing market demand. Moreover, the emerging clean beauty movement, which emphasizes transparency in ingredient sourcing and production, is favoring the market growth. An industry report showed that 68% of consumers seek skincare products with clean ingredients, while 41% are influenced by platforms like Instagram in choosing clean beauty options.
Rapid expansion in the food and beverage (F&B) industry
Botanical ingredients are extensively used in the F&B industry for various applications, including flavoring, coloring, and nutritional additives. Furthermore, the growing consumer inclination towards natural, organic, and health-oriented food products is acting as another growth-inducing factor. Botanical ingredients, derived from plants, such as herbs, spices, and fruits, are valued for their natural flavor profiles and perceived health benefits. They are increasingly being used in a wide array of products ranging from beverages, teas, and functional foods to natural sweeteners and plant-based alternatives. Additionally, the rise in dietary restrictions and preferences, such as veganism, gluten-free, and organic diets, which emphasize natural and plant-based ingredients, is strengthening the market growth. An industry analysis found that 52.2% of respondents changed their diet in the past two years, with 41.8% increasing plant-based meals and alternative proteins, and 29.2% reducing red meat, highlighting rising health and environmental awareness.
Widespread product utilization in pharmaceutical applications
The pharmaceutical sector is widely utilizing plant-based compounds due to their medicinal properties and the growing awareness of the side effects associated with synthetic drugs. An industry analysis reported that around 80% of the global population uses herbal medicines, while 40% of approved pharmaceutical products are derived from natural sources. Furthermore, consumers are increasingly seeking natural remedies and supplements that offer therapeutic benefits without the adverse effects often associated with conventional pharmaceuticals. It has led to a resurgence in the popularity of traditional medicine systems, which rely heavily on botanical ingredients. Besides this, pharmaceutical companies are also investing in research and innovation to explore the therapeutic potentials of various plants and herbs. It includes the development of botanical drugs, standardized herbal extracts, and plant-based supplements that are used in treating a range of conditions, from common ailments to chronic diseases.
Growing emphasis on sustainability and ethical sourcing
Consumers are prioritizing sustainable practices due to increasing awareness of environmental issues and social responsibility. The 2024 Peoples’ Climate Vote showed that 56% of the global population thinks about climate change daily or weekly, and 53% are more concerned about it than a year ago, based on a survey representing 87% of the world’s population. This trend is evident in the demand for botanical ingredients that are sourced ethically and sustainably. Furthermore, consumers are not only concerned about the quality and safety of the ingredients in their products but also about the impact of their production on the environment and local communities. It has led to a greater emphasis on traceability and transparency in the supply chain. Additionally, companies are being urged to adopt practices that ensure the sustainable cultivation and harvesting of botanical ingredients, minimizing environmental impact, and preserving biodiversity. Besides this, they are practicing ethical sourcing, ensuring that farmers and workers involved in the cultivation and collection of botanical ingredients are compensated fairly and work under good conditions.
Botanical Ingredients Industry Segmentation:
IMARC Group provides an analysis of the key trends in each segment of the global botanical ingredients market, along with forecasts at the global, regional, and country levels from 2026-2034. The market has been categorized based on source, form, and application.
Analysis by Source:
- Herbs
- Leaves
- Spices
- Flowers
- Others
Spices stand as the largest source in 2025, holding around 39.2% of the market. The botanical ingredients market forecast anticipates the segment’s continuous dominance due to a multitude of factors, including its wide range of product offerings like pepper, cinnamon, turmeric, ginger, and cardamom. These spices are widely used for their flavoring, preservative, and medicinal properties. Furthermore, the extensive use of spices in culinary applications across various cuisines worldwide is contributing to the market growth. Additionally, the health benefits associated with spices, such as anti-inflammatory and antioxidant properties, leading to their increased use in dietary supplements and pharmaceuticals, are bolstering the market growth. Besides this, the growing ethnic diversity and culinary experimentation globally is fueling the market growth.
Analysis by Form:
- Powder
- Liquid
Powder leads the market with around 60.5% of market share in 2025. The powder segment holds the largest share of the botanical ingredients market due to its versatility and ease of use. Powdered botanical ingredients are obtained by drying and grinding various parts of plants, including leaves, roots, seeds, and bark. They are highly favored in various industries due to their long shelf life, ease of storage, and convenience in handling and transportation. Furthermore, powdered botanicals are widely used as flavorings, colorings, and nutritional additives in the F&B industry. Additionally, they are utilized for their medicinal properties in the formulation of tablets, capsules, and health supplements.
Analysis by Application:
Access the comprehensive market breakdown Request Sample
- Food and Beverages
- Dietary Supplements
- Cosmetics and Personal Care
- Pharmaceuticals
- Other
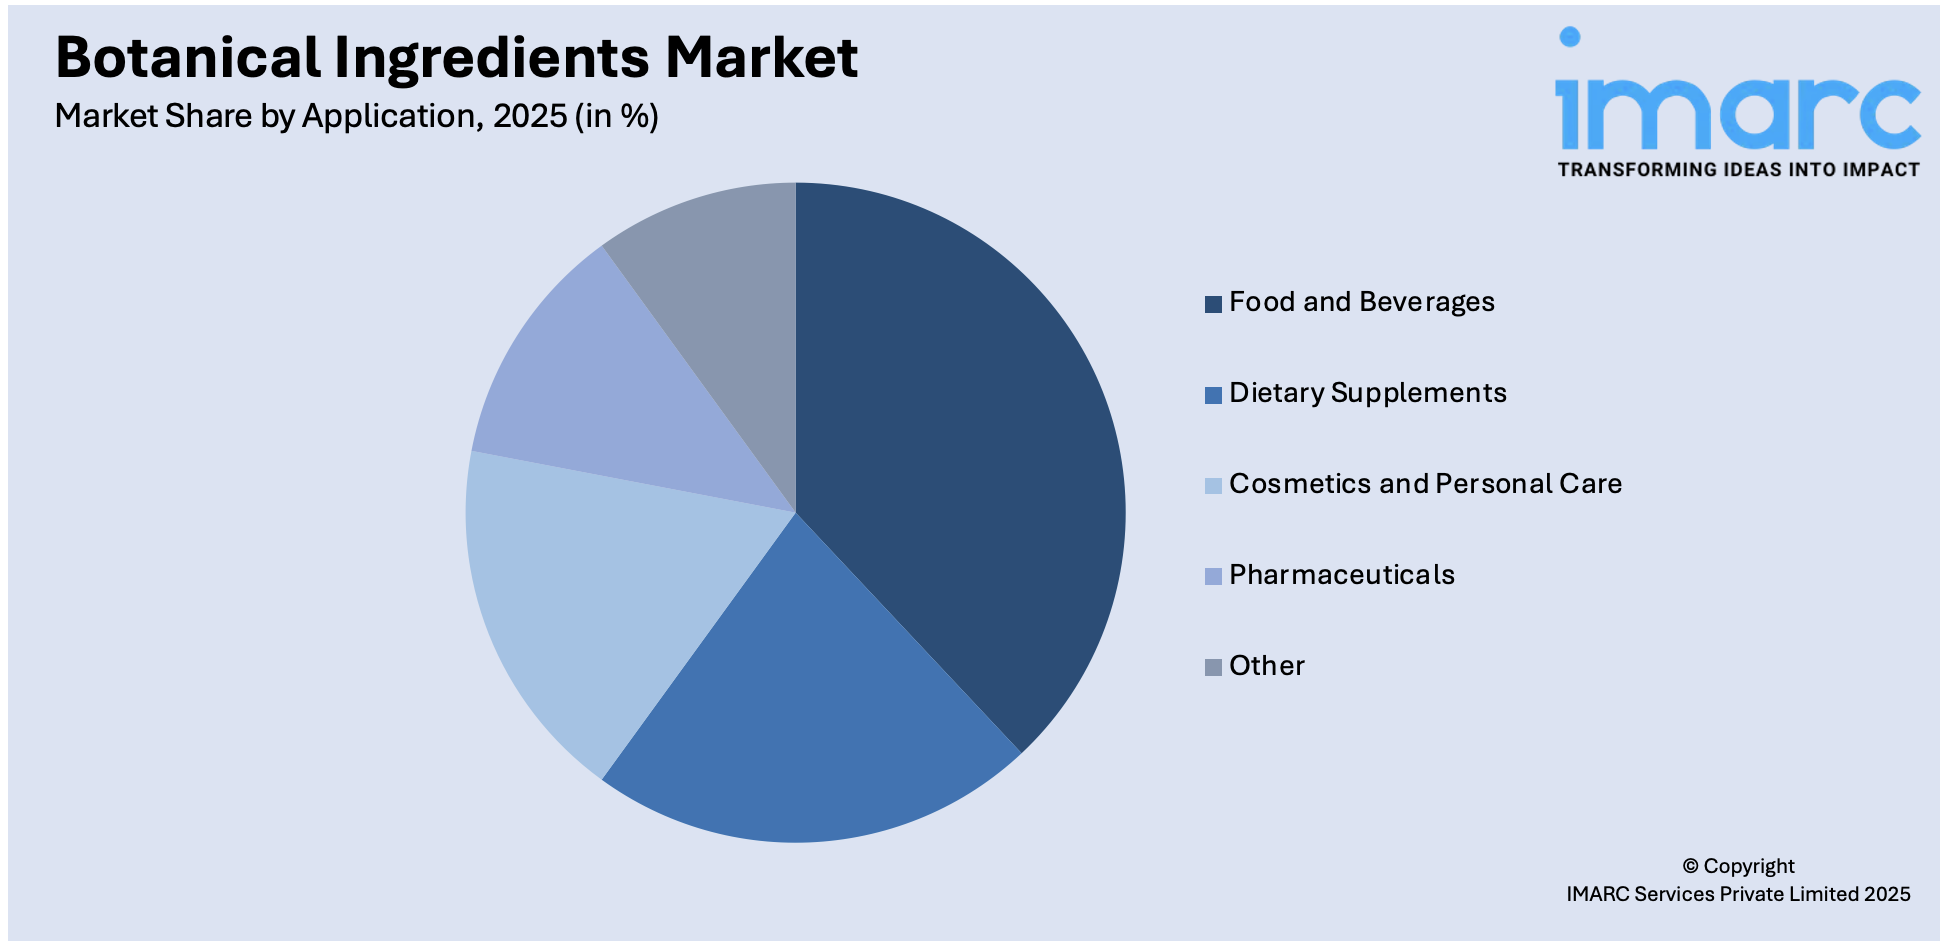
Food and beverages lead the market in 2025 due to the widespread use of botanicals in flavoring, coloring, and enhancing the nutritional value of food and drink products. It involves a diverse range of applications, from using herbs and spices in cooking to incorporating plant extracts in beverages like teas, juices, and health drinks. Furthermore, the rising consumer demand for natural, organic, and health-oriented food products is contributing to the market growth. Additionally, botanical ingredients are preferred for their natural flavor profiles and perceived health benefits, aligning with the global trend toward clean-label products.
Regional Analysis:

To get more information on the regional analysis of this market Request Sample
- North America
- United States
- Canada
- Asia Pacific
- China
- Japan
- India
- South Korea
- Australia
- Indonesia
- Others
- Europe
- Germany
- France
- United Kingdom
- Italy
- Spain
- Russia
- Others
- Latin America
- Brazil
- Mexico
- Others
- Middle East and Africa
In 2025, North America accounted for the largest market share of 34.8%. North America represents the largest market segment, driven by a combination of advanced manufacturing capabilities, high consumer awareness, and stringent regulatory standards promoting natural and organic products. Additionally, the growing demand for botanical ingredients across various sectors, including food and beverages (F&B), pharmaceuticals, cosmetics, and dietary supplements, fueled by the growing consumer preference for natural and healthy products, is driving the market growth. Besides this, the presence of major market players and continuous research and development (R&D) activities in the region is contributing to the market growth. For instance, in December 2024, Tate & Lyle PLC partnered with BioHarvest Sciences to develop plant-derived food and beverage ingredients, focusing on sweeteners. BioHarvest's botanical synthesis technology enables the production of plant-based molecules without growing the entire plant. This partnership aims to create innovative, non-GMO ingredients that meet the increasing consumer demand for healthier products. The collaboration marks a significant milestone in BioHarvest’s R&D journey to scale production of plant-derived molecules for the food industry.
Key Regional Takeaways:
United States Botanical Ingredients Market Analysis
In 2024, the United States held a market share of around 75.50% in North America. The United States botanical ingredients market is primarily driven by rising demand for functional foods and beverages with immune and digestive benefits. In line with this, increasing preference for clean-label formulations free from synthetic additives is promoting the use of botanical alternatives in the food, beverage, and supplement industries. Nielsen data showed that 93% of the households in the United States buy clean-label products at grocery stores, with 50% of all shopping trips including at least one clean-label item. The enhanced extraction and processing technologies delivering higher potency and bioavailability, widening application in high-performance formulations, are impelling the market. Furthermore, continual regulatory advancements, including FDA support for botanical drug development, are encouraging innovation in natural therapeutics. The aging population’s increasing interest in cognitive and anti-inflammatory support is contributing to bolstered market demand. Similarly, the growing exploration of ethnobotanical sources is introducing new plant varieties to mainstream use and fostering market expansion. Additionally, digital commerce growth is improving access to plant-based formulations, thereby accelerating market reach. Moreover, strategic collaborations between suppliers and brands are expediting product innovation and market penetration.
Europe Botanical Ingredients Market Analysis
The market in Europe is experiencing growth due to increasing regulatory support for natural formulations aligned with the EU Green Deal and sustainable sourcing directives. In accordance with this, the widespread acceptance of phytotherapy and traditional herbal medicine across European populations is reinforcing consumer confidence in botanical-based solutions. Similarly, the rise in organic-certified food and beverage products across the region, expanding the use of botanical actives for clean-label applications, is stimulating market appeal. The rising demand for dietary supplements focused on stress, sleep, and hormonal balance is fueling market growth. In 2023, Europe’s food supplements market was valued at USD 40.7 billion and is projected to grow at 7.0% annually between 2024-2030. Food Supplements Europe reported that 52% of European consumers use supplements for overall health maintenance. Furthermore, ongoing advancements in encapsulation and delivery systems are enhancing the efficacy of botanical ingredients are strengthening their role in complex product development. The growing preference for vegan and allergen-free personal care formulations is accelerating the shift toward botanical alternatives. Besides this, enhanced traceability and ethical sourcing frameworks are building supply chain transparency, thereby creating lucrative market opportunities.
Asia Pacific Botanical Ingredients Market Analysis
The Asia Pacific botanical ingredients market is majorly propelled by the strong influence of traditional medicine systems such as Ayurveda, Traditional Chinese Medicine (TCM), and Kampo. According to IBEF, MSMEs in the AYUSH industry grew from 38,216 in August 2021 to 53,023 by January 2023, a nearly 40% increase, highlighting rising interest and potential in the sector. In addition to this, rising incomes and health awareness among the middle class are driving demand for premium plant-based supplements and personal care products, which is impelling the market. Similarly, expanding urbanization coupled with greater exposure to global natural beauty and nutrition trends is supporting botanical ingredient integration across functional categories. Furthermore, government-led standardization and herbal cultivation programs, enhancing domestic production capabilities, are fostering industry growth. Moreover, the growing penetration of digital retail platforms, enabling access to diverse botanical formulations, is contributing to market expansion. Apart from this, strategic partnerships between local ingredient producers and multinational brands, accelerating product development and regional distribution, are further strengthening market presence.
Latin America Botanical Ingredients Market Analysis
In Latin America, the market is progressing, attributed to the region’s vast biodiversity, enabling the commercial extraction of native medicinal plants with therapeutic potential. CIFOR-ICRAF reported that Latin America holds over 40% of global biodiversity, nearly one-third of the world’s freshwater, 57% of primary forests, and more than a quarter of global mangrove coverage. Similarly, increasing consumer preference for herbal remedies and natural health products is fostering the uptake of plant-based formulations in dietary supplements and traditional medicine. Furthermore, favorable regulatory frameworks promoting the formal integration of indigenous botanical knowledge into modern health and nutraceutical applications are supporting product innovation. Moreover, growing investments in sustainable sourcing and traceability standards, strengthening international confidence in Latin American botanical ingredient supply chains, are providing an impetus to the market.
Middle East and Africa Botanical Ingredients Market Analysis
The market in the Middle East and Africa is significantly influenced by increasing reliance on traditional medicine systems such as Unani and African ethnobotany. Furthermore, the rise in wellness tourism across destinations like Morocco and the UAE, encouraging the use of botanical actives in spa therapies and aromatherapy, is augmenting the market growth. Additionally, favorable government-backed initiatives promoting the cultivation and commercialization of indigenous medicinal plants are reinforcing local production capabilities. Besides this, the growing demand for halal-certified, plant-based cosmetic and food ingredients aligned with ethical sourcing standards is accelerating market development. According to Agriculture and Agri-Food Canada, the UAE’s plant-based protein market doubled between 2019 and 2023, reaching USD 14.94 Million with a 20.1% CAGR. It is projected to grow to USD 27.04 Million by 2028, driven by rising health, sustainability, and ethical food awareness.
Competitive Landscape:
Major market players are heavily investing in research and innovation to improve the quality and efficacy of their botanical ingredients. Furthermore, they are exploring new sources of botanicals, developing advanced extraction and processing technologies, and creating novel applications for these ingredients in various industries. Additionally, several leading companies are expanding their product portfolios and entering new markets. It includes diversifying its range of botanical ingredients to cater to different industries, such as F&B, cosmetics, pharmaceuticals, and dietary supplements. For instance, in November 2024, OmniActive Health Technologies, a Mumbai-based nutraceutical company, acquired ENovate Biolife, a botanical ingredients developer, using internal accruals. ENovate is known for innovative products like Muvz, RedNite, and Oxyjun. The acquisition supports OmniActive’s growth strategy to diversify its product portfolio, expand its global reach, and double its revenue to ₹2,000 crores in 5–6 years. The deal enhances its capabilities in clinically researched, plant-based health solutions and strengthens its market position. Besides this, major producers are focusing on sustainable practices to meet consumer demand for environmentally friendly and ethically sourced products.
The report provides a comprehensive analysis of the competitive landscape in the botanical ingredients market with detailed profiles of all major companies, including
- Ambe Phytoextracts Pvt Ltd.
- Bell Flavors & Fragrances
- Berje Inc.
- International Flavors & Fragrances Inc.
- Lipoid Kosmetik AG
- New Directions Aromatics Inc.
- Prakruti Products Pvt. Ltd.
- PT. Indesso Aroma
- Rutland Biodynamics Ltd.
- Saba Botanical of Usa Inc.
- The Green Labs LLC
- The Herbarie at Stoney Hill Farm Inc.
Latest News and Developments:
- April 2025: BASF unveiled Verdessence Maize (hydrolyzed corn starch), Lamesoft OP Plus (coconut-derived wax dispersion), and Dehyton PK45 GA/RA (Rainforest Alliance-certified coconut betaine). These biodegradable, plant-based innovations support eco-conscious personal care without compromising performance, aligning with BASF’s Longevity Ecosystem and sustainable formulation strategy.
- April 2025: Manus and Inscripta merged to form an industrial biomanufacturing company focused on botanical ingredients. By combining Inscripta’s genome engineering with Manus’ fermentation technology, the new entity aims to accelerate the development and commercialization of sustainable, plant-based ingredients for food, beauty, and wellness sectors.
- April 2025: Univar Solutions partnered with Italy’s Phenbiox to distribute its plant-derived cosmetic actives and extracts in Brazil. Phenbiox’s organic, bioactive ingredients, sourced from Mediterranean plants using patented extraction methods, support eco-conscious skin and hair care formulations, aligning with Univar’s commitment to sustainability and high-performance botanical innovations.
- March 2025: Symrise AG launched Mindera, a 100% plant-based product protection platform featuring four patent-backed ingredients with antimicrobial, antioxidant, and soothing properties. Using botanical substances from the food industry, Mindera enables natural, multifunctional protection for personal care formulations, supporting clean beauty and sustainability in cosmetic product development.
- March 2025: Finzelberg announced the launch of AGILIROSE BEAUTY at Vitafoods Europe, highlighting rosehip-collagen synergy for skin health. The company also showcased botanical ingredients like CONCENTAL (Greek mountain tea), 360GUT (Thymus serpyllum), and MENTALIFY (Lemon verbena), targeting brain health, gut balance, and youth behavior support.
- February 2025: Layn Natural Ingredients expanded its precision fermentation facility in Guangxi, China, to launch Galacan, a next-generation beta-glucan ingredient. Produced via fermentation, Galacan offers a water-soluble, highly bioavailable alternative to traditional beta-glucans from mushrooms or oats. Its structure enhances immune interaction, supporting gut health, metabolic balance, energy, and skin repair.
Botanical Ingredients Market Report Scope:
| Report Features | Details |
|---|---|
| Base Year of the Analysis | 2025 |
| Historical Period | 2020-2025 |
| Forecast Period | 2026-2034 |
| Units | Billion USD |
| Scope of the Report |
Exploration of Historical Trends and Market Outlook, Industry Catalysts and Challenges, Segment-Wise Historical and Future Market Assessment:
|
| Sources Covered | Herbs, Leaves, Spices, Flowers, Others |
| Forms Covered | Powder, Liquid |
| Applications Covered | Food and Beverages, Dietary Supplements, Cosmetics and Personal Care, Pharmaceuticals, Others |
| Regions Covered | Asia Pacific, Europe, North America, Latin America, Middle East and Africa |
| Countries Covered | United States, Canada, Germany, France, United Kingdom, Italy, Spain, Russia, China, Japan, India, South Korea, Australia, Indonesia, Brazil, Mexico |
| Companies Covered | Ambe Phytoextracts Pvt Ltd., Bell Flavors & Fragrances, Berje Inc., International Flavors & Fragrances Inc., Lipoid Kosmetik AG, New Directions Aromatics Inc., Prakruti Products Pvt. Ltd., PT. Indesso Aroma, Rutland Biodynamics Ltd., Saba Botanical of Usa Inc., The Green Labs LLC, The Herbarie at Stoney Hill Farm Inc., etc. |
| Customization Scope | 10% Free Customization |
| Post-Sale Analyst Support | 10-12 Weeks |
| Delivery Format | PDF and Excel through Email (We can also provide the editable version of the report in PPT/Word format on special request) |
Key Benefits for Stakeholders:
- IMARC’s industry report offers a comprehensive quantitative analysis of various market segments, historical and current market trends, market forecasts, and dynamics of the botanical ingredients market from 2020-2034.
- The research report provides the latest information on the market drivers, challenges, and opportunities in the global botanical ingredients market.
- The study maps the leading, as well as the fastest-growing, regional markets. It further enables stakeholders to identify the key country-level markets within each region.
- Porter's five forces analysis assists stakeholders in assessing the impact of new entrants, competitive rivalry, supplier power, buyer power, and the threat of substitution. It helps stakeholders to analyze the level of competition within the botanical ingredients industry and its attractiveness.
- The competitive landscape allows stakeholders to understand their competitive environment and provides insight into the current positions of key players in the market.
Frequently Asked Questions About the Botanical Ingredients Market Report
The botanical ingredients market was valued at USD 179.08 Billion in 2025.
The botanical ingredients market is projected to exhibit a CAGR of 4.85% during 2026-2034, reaching a value of USD 274.17 Billion by 2034.
The botanical ingredients market is driven by rising consumer preference for natural and organic products, growing demand for clean-label and sustainable options, and increasing awareness of the health benefits associated with plant-based ingredients. Additionally, innovations in extraction technologies and expanding applications in cosmetics and pharmaceuticals support market growth.
In 2025, North America dominated the botanical ingredients market, holding a market share of over 34.8%. This dominance is driven by the increasing consumer demand for natural and sustainable products in food, beverages, and personal care. North America's advanced research and development capabilities, coupled with strong regulatory frameworks and growing awareness of the benefits of plant-based ingredients, further fuel market growth and innovation.
Some of the major players in the botanical ingredients market include Ambe Phytoextracts Pvt Ltd., Bell Flavors & Fragrances, Berje Inc., International Flavors & Fragrances Inc., Lipoid Kosmetik AG, New Directions Aromatics Inc., Prakruti Products Pvt. Ltd., PT. Indesso Aroma, Rutland Biodynamics Ltd., Saba Botanical of Usa Inc., The Green Labs LLC, The Herbarie at Stoney Hill Farm Inc., etc.
Need more help?
- Speak to our experienced analysts for insights on the current market scenarios.
- Include additional segments and countries to customize the report as per your requirement.
- Gain an unparalleled competitive advantage in your domain by understanding how to utilize the report and positively impacting your operations and revenue.
- For further assistance, please connect with our analysts.
 Request Customization
 Speak to an Analyst
 Request Brochure
 Inquire Before Buying
Benefits of Customization
- Personalize this research
- Triangulate with your data
- Get data as per your format and definition
- Gain a deeper dive into a specific application, geography, customer, or competitor
- Any level of personalization
Get in Touch With Us
UNITED STATES
Phone: +1-201-971-6302
INDIA
Phone: +91-120-433-0800
UNITED KINGDOM
Phone: +44-753-714-6104
Email: [email protected]
Client Testimonials


.webp)


