
Bus Rapid Transit Systems (BRT) Market Size, Share, Trends and Forecast by Bus Type, System Type, Fuel Type, and Region, 2026-2034
Bus Rapid Transit Systems (BRT) Market Size, Share, Trends & Forecast (2026-2034)
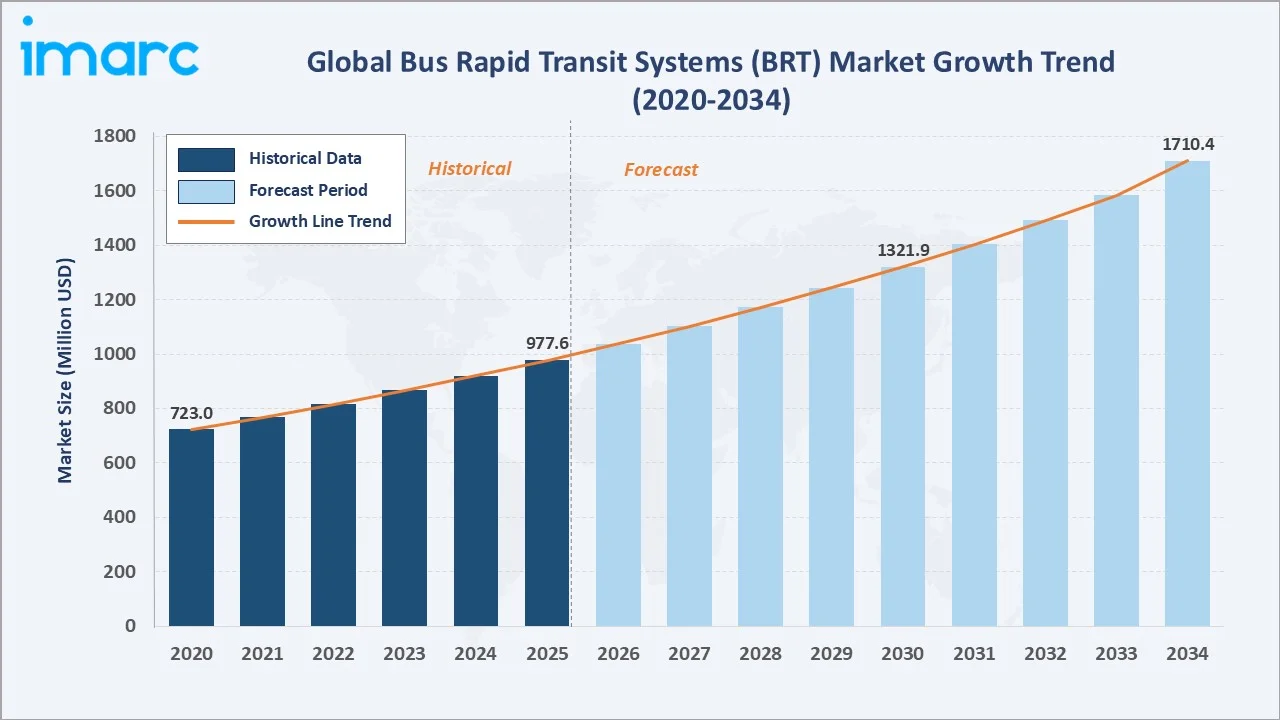
The bus rapid transit systems (BRT) market grew from USD 977.6 Million in 2025 to USD 1,038.4 Million in 2026 and is projected to reach USD 1,710.4 Million by 2034, growing at a CAGR of 6.22% during 2026-2034. The ongoing expansion of urban populations and growing government mandates for low-emission public transportation are the primary drivers shaping market growth.
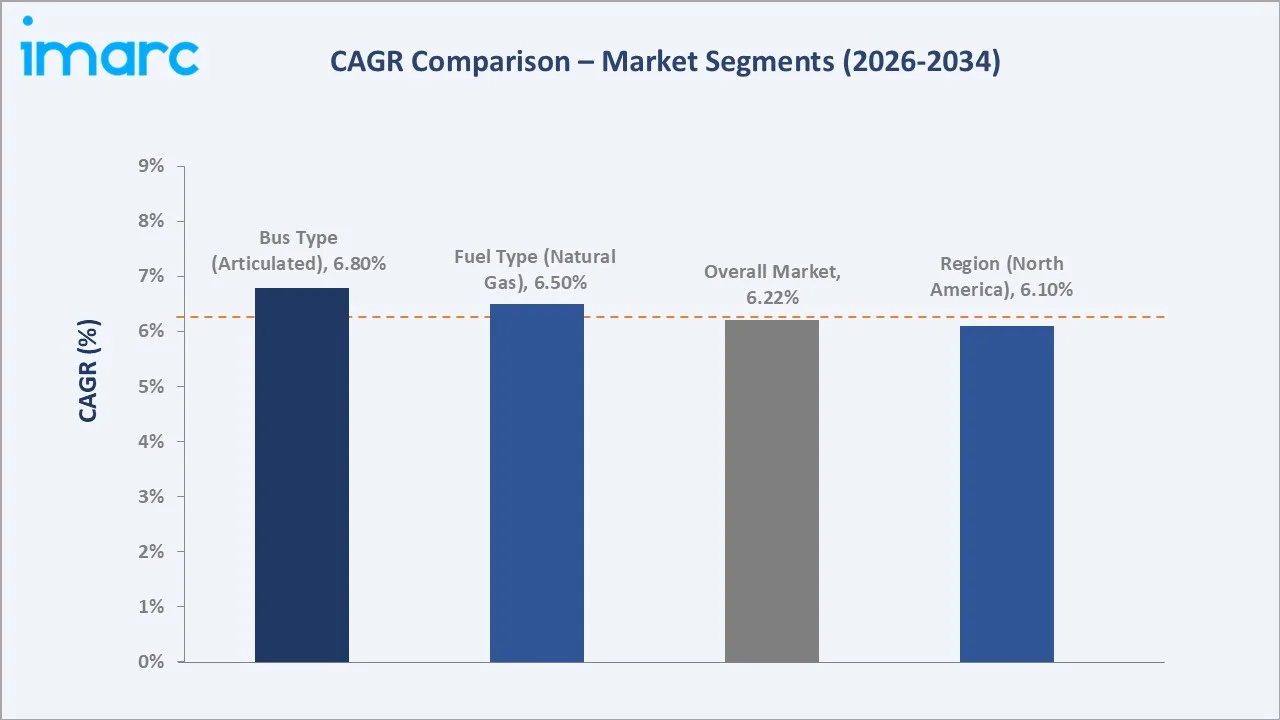
Articulated leads the bus type segment at 46.8%, natural gas dominates the fuel type segment at 45.7%, and North America commands 34.6% of regional share.
Market Snapshot
|
Metric |
Value |
|
Base Year Market Size (2025) |
USD 977.6 Million |
|
Market Size (2026) |
USD 1,038.4 Million |
|
Forecast Market Size (2034) |
USD 1,710.4 Million |
|
CAGR (2026-2034) |
6.22% |
|
Base Year |
2025 |
|
Historical Period |
2026-2034 |
|
Forecast Period |
2026-2034 |
|
Largest Region |
North America (34.6%, 2025) |
|
Second Largest Region |
Asia-Pacific (27.8%, 2025) |
|
Leading Bus Type |
Articulated (46.8%, 2025) |
|
Leading Fuel Type |
Natural Gas (45.7%, 2025) |
The bus rapid transit systems (BRT) market size increased from USD 723.0 Million in 2020 to USD 977.6 Million in 2025 and is estimated to reach USD 1,038.4 Million in 2026. The market is further expected to grow to USD 1321.9 Million by 2030 and USD 1710.4 Million by 2034, supported by accelerating adoption of clean fuel variants, smart BRT technology integration, and growing urbanization across Asia-Pacific and Latin America.
To get more information on this market, Request Sample
CAGR trajectories across bus type and fuel type sub-segments, together with regional patterns, show Asia-Pacific and natural gas expanding faster than the overall 6.22% market CAGR, driven by rapid urbanization, growing government BRT infrastructure investment, and accelerating clean-fuel fleet adoption across emerging and established markets.
Executive Summary
The bus rapid transit systems (BRT) market expanded from USD 977.6 Million in 2025 to an estimated USD 1038.4 Million in 2026, reflecting continued momentum across urban transit investment globally. The market has evolved from a transit supplement to a core urban mobility infrastructure tool, with BRT corridors now serving as high-capacity, cost-effective alternatives to rail in cities across North America, Asia-Pacific, Latin America, and Europe.
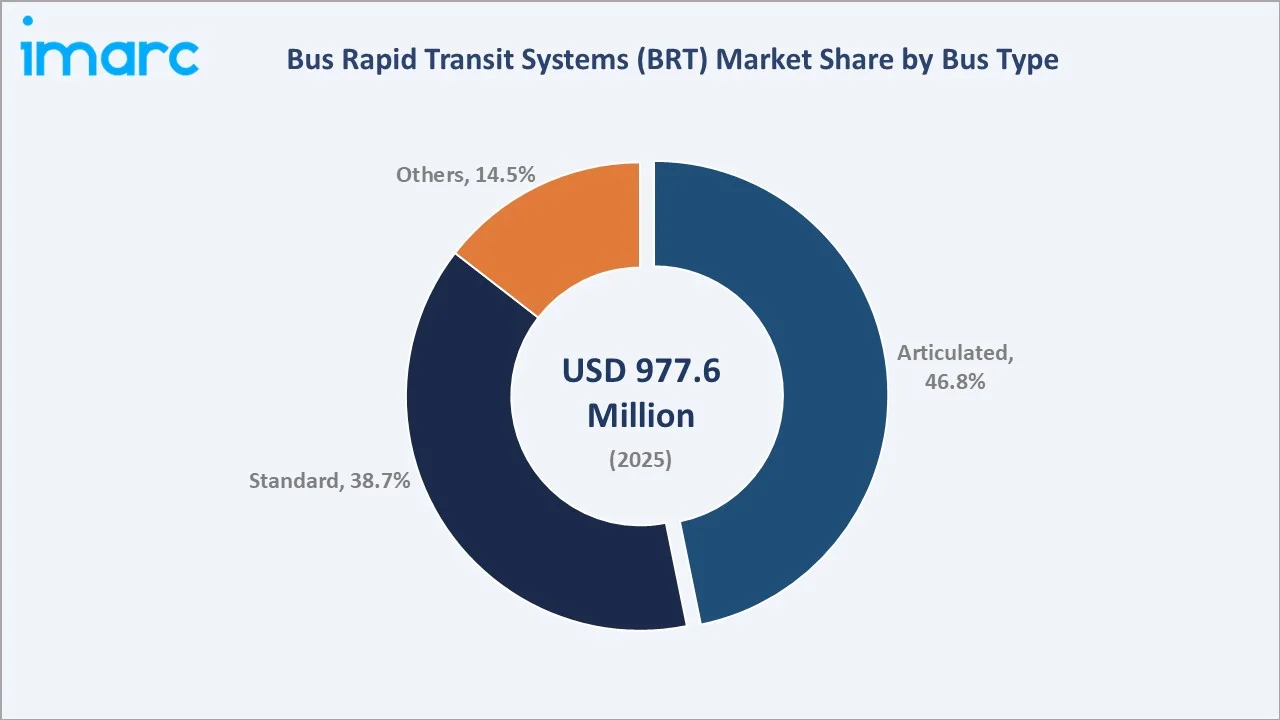
Articulated dominates the bus type segment at 46.8% in 2025, driven by high passenger capacity and operational efficiency on dedicated BRT lanes. Natural gas leads the fuel type segment at 45.7%, reflecting the transition from conventional diesel fleets toward lower-emission alternatives. North America commands 34.6% of regional share, underpinned by extensive BRT corridor networks in the United States and Canada.
Key Market Insights
|
Insight |
Data |
|
Leading Bus Type |
Articulated - 46.8% share (2025) |
|
Second Largest Bus Type |
Standard - 38.7% share (2025) |
|
Leading Fuel Type |
Natural Gas - 45.7% share (2025) |
|
Second Largest Fuel Type |
Diesel - 39.8% share (2025) |
|
Leading Region |
North America - 34.6% share (2025) |
|
Second Largest Region |
Asia-Pacific - 27.8% share (2025) |
|
Top Companies |
AB Volvo, Zhengzhou Yutong Group Co., Ltd., BYD Company Limited, Volkswagen AG |
Key Analytical Observations Expanding On the Data Above:
- Articulated dominance at 46.8% is supported by high passenger throughput requirements in dense urban BRT corridors, where articulated buses enable operators to serve peak-hour demand efficiently with fewer vehicle deployments.
- Standard share at 38.7% reflects continued deployment on secondary BRT routes and lower-density corridors where articulated capacity is not operationally necessary, ensuring fleet diversity across BRT networks.
- Natural gas leadership at 45.7% is driven by the availability of CNG infrastructure, favorable fuel economics, and lower emissions compared to diesel, making it the dominant fuel transition pathway for BRT operators.
- Diesel at 39.8% is supported by its established fueling infrastructure, broad fleet availability, and suitability for high-utilization BRT operations, particularly in networks where alternative-fuel infrastructure remains limited.
- North America at 34.6% leads regional share, anchored by extensive established BRT corridors in major metropolitan areas across the United States and Canada, supported by sustained federal and municipal transit funding.
Bus Rapid Transit Systems (BRT) Market Overview
Bus rapid transit systems (BRT) refer to high-capacity public transportation systems that use dedicated busways and other transit-priority features to provide faster and more reliable urban mobility. BRT systems typically integrate specialized bus vehicles, elevated boarding platforms, pre-board fare collection, signal priority systems, and real-time passenger information to deliver reliable, fast, and high-capacity urban mobility.
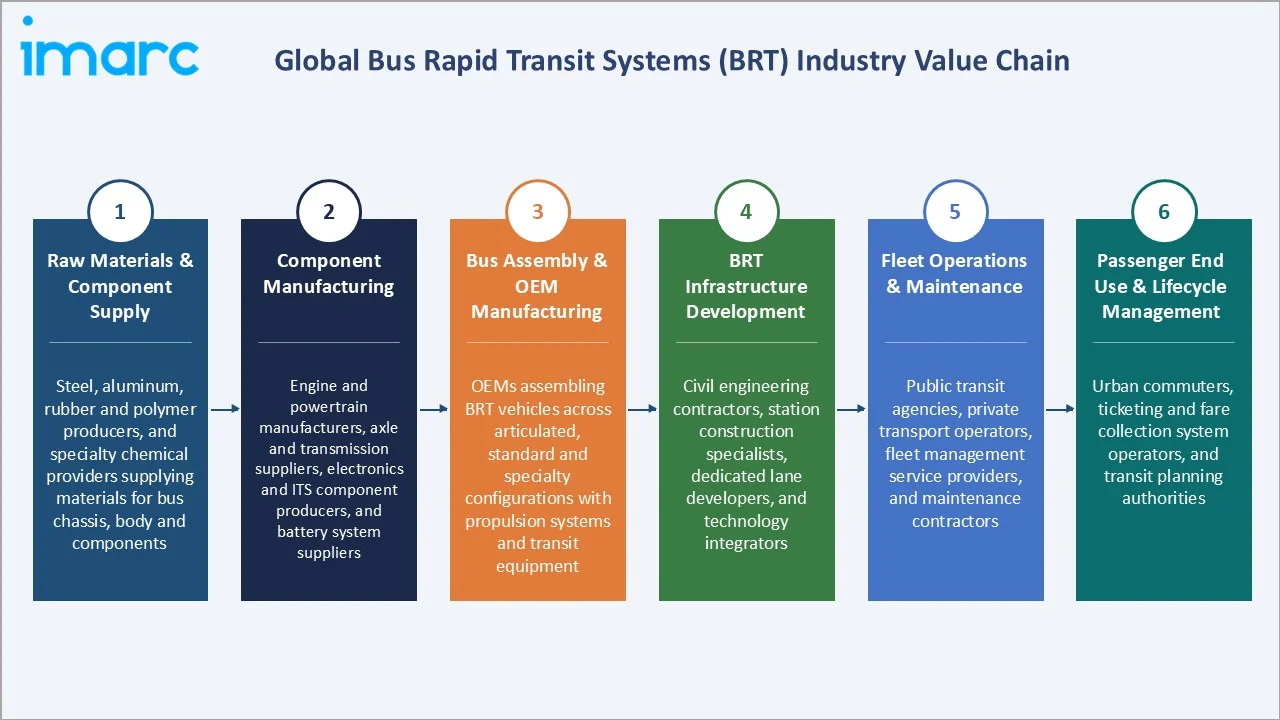
The bus rapid transit systems (BRT) ecosystem spans bus manufacturers supplying articulated, standard, and specialized vehicles; component and technology providers delivering propulsion systems, chassis, and ITS solutions; infrastructure developers constructing dedicated corridors and stations; transit operators managing daily fleet and passenger operations; fuel and energy suppliers including natural gas, diesel, and electricity providers; regulatory authorities setting operational and environmental standards; and financing entities including multilateral development banks, public-private partnerships, and government transit agencies.
Market Dynamics
To evaluate market opportunities, Request Sample
Market Drivers
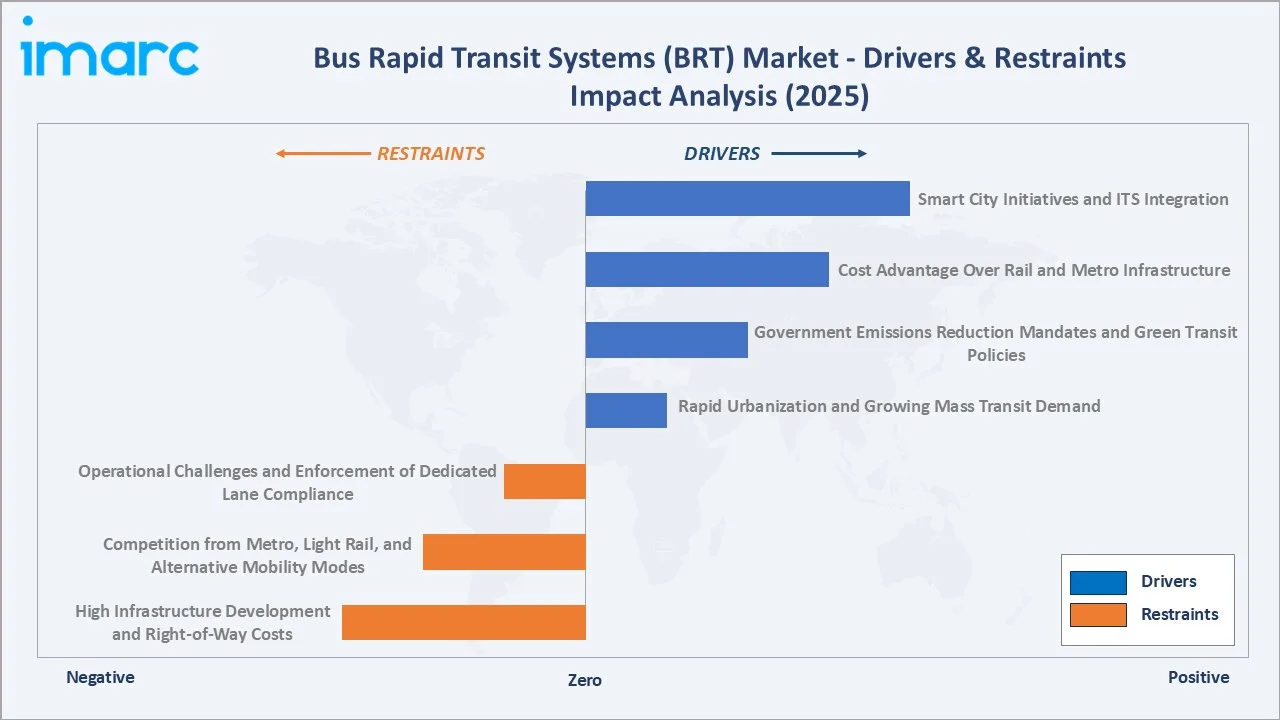
- Rapid Urbanization and Growing Mass Transit Demand: Accelerating urban population growth across Asia-Pacific, Latin America, and Africa is generating significant demand for high-capacity, cost-effective public transportation solutions. According to the Economic Survey 2023-24, it is anticipated that over 40% of India's population will reside in urban regions by 2030. Governments are prioritizing dedicated bus-based transit systems over capital-intensive metro networks to expand urban transit coverage faster and at lower cost, supporting consistent fleet procurement and corridor expansion in the bus rapid transit market.
- Government Emissions Reduction Mandates and Green Transit Policies: Increasingly stringent national and municipal carbon emissions standards are compelling transit authorities to retire diesel-heavy fleets and adopt natural gas, hybrid, and electric BRT vehicles.
- Cost Advantage Over Rail and Metro Infrastructure: BRT systems offer a compelling economic advantage over rail, requiring substantially lower capital investment per kilometer while delivering comparable passenger capacity. This cost-effectiveness is particularly influential in emerging economies where infrastructure budgets are constrained, enabling broader deployment of BRT across secondary and tertiary cities.
- Smart City Initiatives and ITS Integration: Growing investment in intelligent transportation systems (ITS), including real-time fleet monitoring, signal priority, digital ticketing, and passenger information systems, is improving BRT operational efficiency and passenger experience, encouraging broader adoption and further corridor development across global metropolitan areas.
Market Restraints
- High Infrastructure Development and Right-of-Way Costs: Establishing dedicated BRT lanes requires significant right-of-way acquisition, road reconstruction, and station construction, representing a substantial capital outlay that can delay or limit BRT deployment in congested or commercially dense urban corridors.
- Competition from Metro, Light Rail, and Alternative Mobility Modes: In higher-income urban markets, rail-based transit systems, ride-hailing services, and emerging micro-mobility options provide alternative transportation choices that can reduce the perceived urgency of BRT investment and limit ridership growth in certain corridors.
- Operational Challenges and Enforcement of Dedicated Lane Compliance: Unauthorized use of BRT lanes by private vehicles remains a persistent operational challenge in several markets, undermining the speed and reliability advantages that make BRT systems attractive, and reducing return on infrastructure investment.
Market Opportunities
- Electrification of BRT Fleets: Growing availability of high-capacity electric buses, improvements in battery technology, and declining per-unit costs are encouraging transit agencies to transition their fleets toward zero-emission vehicles, creating new growth opportunities in the bus rapid transit vehicle market. This shift is further supported by international climate financing and government incentive programs.
- Integration with Multimodal Urban Transport Networks: Increasing focus on seamless multimodal connectivity, linking BRT with metro systems, commuter rail, cycling infrastructure, and ride-hailing platforms, is expanding BRT's role within integrated urban mobility ecosystems and increasing the strategic value of BRT investment.
Market Challenges
- Land Acquisition and Urban Space Constraints: In densely built urban environments, finding adequate right-of-way for dedicated BRT lanes without significantly disrupting mixed traffic flows or displacing existing land uses presents a significant planning and execution challenge for city governments.
- Financing and Budget Constraints in Developing Economies: While BRT is less capital-intensive than rail, upfront infrastructure costs can still be challenging for governments in lower-income markets to finance without multilateral or concessional lending support, creating deployment bottlenecks in high-growth opportunity regions.
Emerging Market Trends
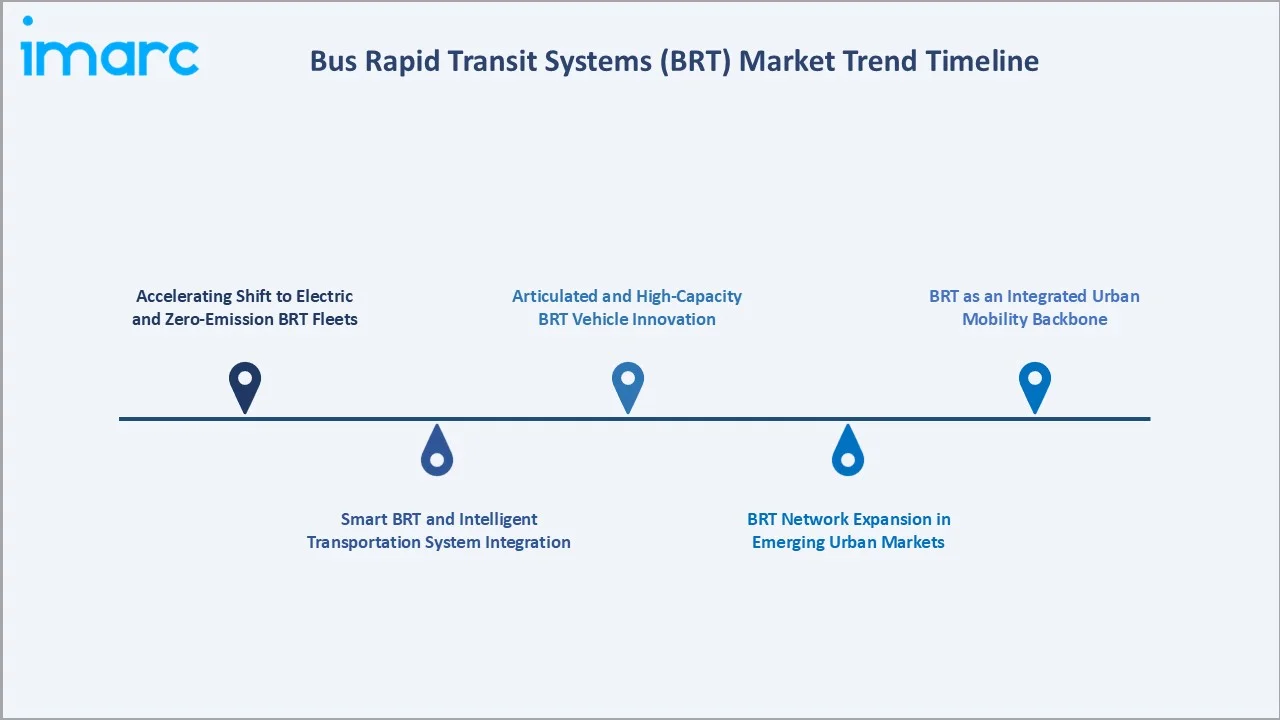
1. Accelerating Shift to Electric and Zero-Emission BRT Fleets
Transit authorities globally are accelerating the electrification of BRT fleets, supported by improving battery technology, expanding charging infrastructure, and increasing regulatory pressure to eliminate tailpipe emissions. This transition is also encouraging investments in fleet modernization and depot charging infrastructure, strengthening the long-term adoption of electric buses across urban transit networks.
2. Smart BRT and Intelligent Transportation System Integration
Advanced ITS technologies, including real-time passenger information, automated signal priority, predictive fleet maintenance, and integrated digital ticketing, are being embedded across BRT systems to improve punctuality, passenger experience, and operational efficiency. Smart BRT implementations are increasingly serving as urban mobility platforms connecting with city-wide transportation management systems.
3. BRT Network Expansion in Emerging Urban Markets
Rapid urbanization in Asia-Pacific, Sub-Saharan Africa, and Latin America is driving large-scale BRT corridor investment in secondary cities that lack metro-scale transit infrastructure. Multilateral development banks are actively financing BRT expansion in high-growth emerging markets, creating substantial procurement demand for both vehicles and infrastructure components within the bus rapid transit systems (BRT) market.
4. Articulated and High-Capacity BRT Vehicle Innovation
Bus manufacturers are investing in next-generation articulated and bi-articulated BRT vehicles with improved passenger capacity, lower floor access, enhanced passenger flow design, and advanced driver assistance systems. These innovations are enabling BRT systems to approach rail-equivalent capacity on high-volume corridors while maintaining the operational flexibility and lower cost structure of bus-based transit.
5. BRT as an Integrated Urban Mobility Backbone
City planners and transit authorities are increasingly positioning BRT corridors as the structural backbone of integrated urban mobility networks, connecting with feeder bus routes, shared mobility platforms, and active transport infrastructure. This multimodal integration is elevating the strategic importance of BRT investment and supporting higher ridership through improved first- and last-mile connectivity.
Industry Value Chain Analysis
The bus rapid transit systems (BRT) value chain spans six core stages, from raw material and component sourcing through vehicle manufacturing, infrastructure development, fleet operations, and end-user passenger engagement. Vehicle manufacturing and BRT infrastructure development capture the highest value-add within the chain, while fleet operations and maintenance represent the most significant ongoing cost and revenue-generation stages for transit operators.
|
Stage |
Key Players / Examples |
|
Raw Materials & Component Supply |
Steel suppliers, aluminum manufacturers, rubber and polymer producers, and specialty chemical providers supplying primary materials for bus chassis, body, and component fabrication |
|
Component Manufacturing |
Engine and powertrain manufacturers, axle and transmission suppliers, electronics and ITS component producers, and battery system suppliers for electric and hybrid BRT vehicles |
|
Bus Assembly & OEM Manufacturing |
OEMs assembling BRT vehicles across articulated, standard, and specialty configurations, incorporating propulsion systems, body designs, and transit-specific equipment |
|
BRT Infrastructure Development |
Civil engineering contractors, station construction specialists, dedicated lane developers, and technology integrators building BRT corridors, stations, depots, and passenger information systems |
|
Fleet Operations & Maintenance |
Public transit agencies, private transport operators, fleet management service providers, and maintenance contractors managing daily BRT operations and vehicle lifecycle servicing |
|
Passenger End Use & Lifecycle Management |
Urban commuters and passengers, customer service and grievance management teams, ticketing and fare collection system operators, and transit planning authorities |
Vertically integrated OEMs with proprietary powertrain and body technologies, combined with established relationships with transit authorities, are positioned to capture greater value than component-level suppliers or infrastructure-only contractors.
Technology Landscape in the Bus Rapid Transit Systems (BRT) Industry
Electric and Alternative Propulsion Systems
Battery-electric and hydrogen fuel-cell propulsion technologies are increasingly being integrated into BRT fleets, replacing conventional diesel and natural gas powertrains. Improvements in battery energy density, charging speed, and operating range are making electric BRT economically viable across a wider range of corridor types, supporting the transition toward zero-emission transit networks.
ITS and Signal Priority
Advanced ITS technologies, including transit signal priority, automated vehicle location, real-time passenger information displays, and integrated fare management systems, are enhancing the speed, reliability, and passenger experience of BRT services. ITS integration is enabling dynamic route management, predictive maintenance, and seamless multimodal connectivity within urban transportation networks.
Connected and Autonomous Vehicle Technologies
Connected vehicle platforms and early-stage autonomous driving technologies are being tested on BRT corridors in several cities, enabling platooning, improved spacing management, and reduced driver workload on dedicated lanes. Connected vehicle features are progressively improving fleet operational efficiency and safety performance.
Fleet Management and Predictive Maintenance Platforms
Cloud-based fleet management systems integrating IoT sensors, telematics, and predictive analytics are enabling BRT operators to monitor vehicle health in real time, anticipate maintenance requirements, and reduce unplanned downtime. These platforms are improving fleet availability, extending vehicle lifecycle, and reducing operational costs across large BRT networks.
Market Segmentation Analysis
The report covers the following segments:
|
Segment Category |
Leading Segment |
Market Share |
Year |
|
Bus Type |
Articulated |
46.8% |
2025 |
|
System Type |
Closed BRT System |
🔒 |
2025 |
|
Fuel Type |
Natural Gas |
45.7% |
2025 |
|
Region |
North America |
34.6% |
2025 |

By Bus Type
Articulated commands a 46.8% majority share in 2025, driven by the high passenger capacity requirements of primary BRT corridors in major metropolitan areas. Articulated configurations enable transit operators to maximize throughput per vehicle movement on dedicated BRT lanes, reducing operating costs per passenger while maintaining service frequency. The segment benefits from continued infrastructure investment in high-volume BRT corridors across North America, Latin America, and Asia-Pacific.
To access detailed market analysis, Request Sample
Standard at 38.7% serves a critical role in secondary BRT corridors and feeder routes where full articulated capacity is not required. Standard configurations offer greater fleet flexibility, lower per-unit cost, and easier maneuverability in mixed-traffic urban environments.
By Fuel Type
Natural gas leads the fuel type segment with 45.7% share in 2025, reflecting widespread adoption of compressed natural gas (CNG) as the preferred lower-emission alternative to diesel across BRT fleets in North America, Asia-Pacific, and Latin America.
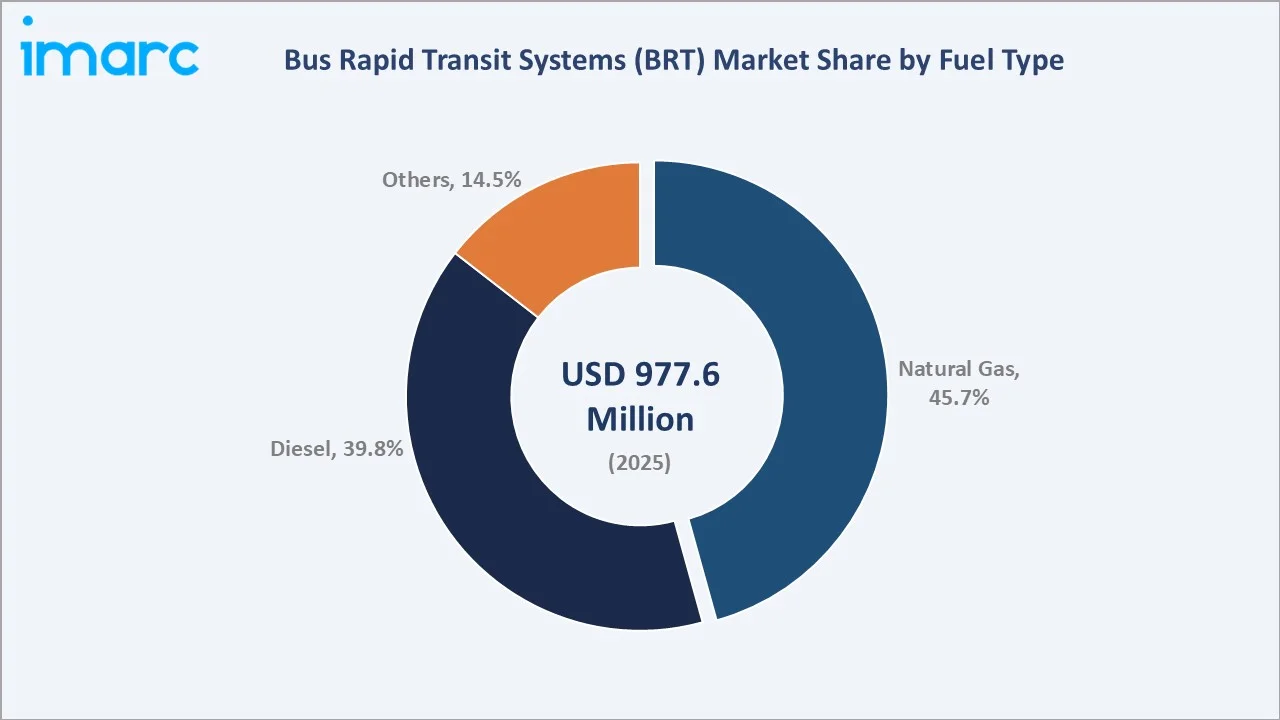
Diesel at 39.8% remains significant among transit agencies operating in markets where natural gas infrastructure is limited or where fleet replacement timelines extend beyond near-term.
Regional Market Insights
|
Region |
Share (2025) |
Key Growth Drivers |
|
North America |
34.6% |
Established BRT corridor networks, strong federal and municipal transit funding, high urban transit ridership, fleet electrification mandates, and ongoing BRT expansion in major metropolitan areas |
|
Asia-Pacific |
27.8% |
Rapid urbanization, large-scale government investment in urban mass transit, expanding BRT networks in China and India, rising smart city development, and increasing adoption of clean-fuel BRT fleets |
|
Europe |
21.4% |
Strong emissions reduction targets, urban sustainability policies, BRT integration with cycling and rail networks, public transit investment programs, and growing electric BRT adoption |
|
Latin America |
9.7% |
Growing urban populations, cost-effective BRT as primary mass transit option, multilateral development bank financing, expanding CNG bus deployments, and BRT corridor development in major cities |
|
Middle East and Africa |
6.5% |
Emerging urban transit infrastructure investment, growing government smart city programs, expansion of BRT in Gulf Cooperation Council cities and Sub-Saharan Africa urban corridors |
North America at 34.6% in 2025 leads the regional landscape, supported by an extensive established network of BRT corridors across major cities in the United States and Canada. A mature transit funding framework, high per-capita transit ridership in leading metropolitan areas, and growing fleet electrification mandates underpin sustained regional leadership.
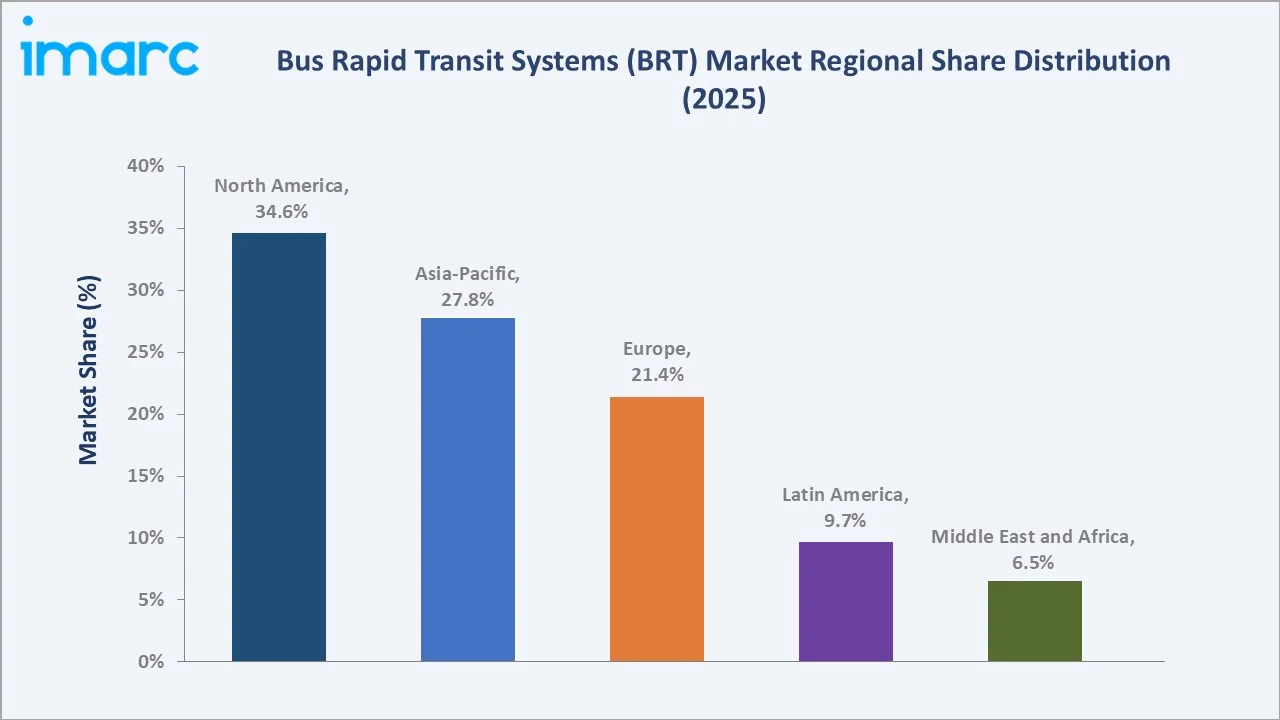
Asia-Pacific, while the second largest region at 27.8%, is expanding at the fastest pace as rapid urbanization and large-scale government investment in urban infrastructure drive BRT corridor development across China, India, Indonesia, and the broader Southeast Asian region.
Competitive Landscape
The bus rapid transit systems (BRT) market is moderately concentrated, with established global bus OEMs and regional manufacturers competing on vehicle technology, fleet capacity, fuel type versatility, and aftermarket service capability. Technology depth, BRT-specific vehicle design expertise, and established relationships with transit authorities and government procurement bodies form the key competitive differentiators across the industry.
| Company | Key Offerings | Market Position | Core Strength |
|---|---|---|---|
| AB Volvo | Volvo BZRT / 7800 Electric | Leader | Expanding electric and hybrid BRT product portfolio and growing partnerships with transit authorities in North America, Latin America, and Europe |
| Zhengzhou Yutong Group Co., Ltd. | Yutong ZK Series BRT | Leader | Growing global BRT fleet supply through competitive pricing, broad product range, and expanding electric bus capabilities across emerging market deployments |
| BYD Company Limited | BYD K Series BRT | Leader | Accelerating zero-emission BRT adoption through battery-electric vehicle innovation and expanding supply agreements with transit agencies seeking fleet electrification |
| Volkswagen AG | MAN Lion's City / Scania Citywide | Challenger | Deepening BRT product development with electric and CNG variants and growing European and international urban transit authority partnerships |
Key players include AB Volvo, Zhengzhou Yutong Group Co., Ltd., BYD Company Limited, and Volkswagen AG, among others.
Key Company Profiles
AB Volvo
AB Volvo is a Swedish multinational industrial group headquartered in Gothenburg, Sweden, and one of the world's leading manufacturers of trucks, buses, construction equipment, and marine and industrial engines. The group supplies BRT and urban transit vehicles across North America, Latin America, Europe, Asia, and other global markets, with a dedicated product range specifically designed for high-capacity BRT corridor operations.
- Product Portfolio: BRT vehicle range including the BZRT, the 7800 Electric, and CNG and diesel articulated chassis for BRT and urban transit operations globally.
- Recent Developments: AB Volvo has been actively expanding its electric BRT product range and securing new fleet contracts with transit operators across multiple regions, reinforcing its position in the zero-emission urban transit segment.
- Strategic Focus: Strengthening zero-emission BRT capabilities globally and cultivating long-term procurement relationships with urban transit authorities pursuing fleet decarbonization and clean energy transition goals.
Zhengzhou Yutong Group Co., Ltd.
Zhengzhou Yutong Group Co., Ltd. is a large-scale Chinese commercial vehicle group headquartered in Zhengzhou, Henan, China, and one of the world's largest bus manufacturers by volume. The group supplies a comprehensive range of BRT and urban transit vehicles to markets across China, Asia, Latin America, Africa, Europe, and the Middle East, with a particularly strong presence in high-growth emerging market BRT corridor deployments.
- Product Portfolio: Comprehensive BRT bus range under the ZK series, including articulated CNG, diesel, and battery-electric configurations, standard urban transit buses, and specialized BRT-optimized vehicle variants engineered for high-capacity corridor operations globally.
- Recent Developments: Zhengzhou Yutong Group Co., Ltd. has been progressively extending its international BRT fleet footprint, introducing new energy bus products and expanding its service and support network across key emerging markets.
- Strategic Focus: Deepening penetration across high-growth international BRT markets by continuously widening its new energy vehicle product line and reinforcing procurement relationships with government transit agencies.
BYD Company Limited
BYD Company Limited is a Chinese multinational conglomerate headquartered in Shenzhen, Guangdong, China, and one of the world's largest new energy vehicle manufacturers. Its electric bus division operates across markets in Asia, Europe, North America, and Latin America, supplying battery-electric BRT and urban transit buses to public transit authorities and fleet operators globally, backed by proprietary battery technology and integrated energy management systems.
- Product Portfolio: Battery-electric BRT and urban transit buses under the K series, including articulated and standard configurations, featuring BYD's proprietary Blade Battery technology, integrated battery management systems, and fleet charging infrastructure solutions for BRT corridor operations.
- Recent Developments: BYD Company Limited has been steadily expanding its electric bus presence across global transit markets, securing fleet supply agreements with public transport operators and growing its BRT-specific product deployments internationally.
- Strategic Focus: Accelerating the global transition to zero-emission BRT fleets by capitalizing on proprietary battery innovation and delivering competitive lifecycle cost propositions to government transit procurement programs.
Market Concentration Analysis
The bus rapid transit systems (BRT) market is moderately concentrated, with a small number of established global OEMs led by AB Volvo, Zhengzhou Yutong Group Co., Ltd., and BYD Company Limited commanding a significant combined share of global BRT vehicle procurement. These leaders benefit from scale economies, established transit authority relationships, broad product portfolios spanning multiple fuel types, and strong aftermarket service networks.
Barriers to entry are meaningful, driven by high product development and homologation costs, the scale required to participate in large government procurement tenders, the need for established local service and parts networks, and the long certification timelines required for BRT-specific vehicle variants. These factors favor established OEMs with existing fleet references and procurement track records over new entrants.
Consolidation is gradually increasing as larger OEMs acquire niche technology providers and regional bus manufacturers to expand product range and geographic coverage. Strategic partnerships between bus manufacturers, technology suppliers, and transit operators are further shaping competitive positioning, particularly in the electric and smart BRT segments where technology differentiation is becoming a key procurement criterion.
Investment & Growth Opportunities
Fastest-Growing Segments
Natural gas represents the fastest growing fuel type, supported by lower operating emissions than conventional diesel buses, improving fuel efficiency, and the growing availability of natural gas refueling infrastructure. This trend is further supported by transit agencies seeking cost-efficient alternatives that can reduce fuel expenses while meeting increasingly stringent urban emission standards.
Emerging Markets
Asia-Pacific is the fastest growing region, supported by large-scale urban transit investment in China, India, Indonesia, and Vietnam, where rapid urbanization is generating sustained BRT corridor development demand. Middle East and Africa represents significant longer-term growth opportunity as Gulf city governments and Sub-Saharan African urban administrations scale up BRT investment alongside broader urban development programs.
Venture & Investment Trends
Investment is concentrating in electric BRT vehicle technology, smart transit platforms, and integrated BRT infrastructure development. Capital is flowing toward OEMs and technology providers developing next-generation battery-electric and hydrogen BRT vehicles, and toward ITS and fleet management platform developers enabling smarter, more efficient BRT operations. Multilateral development bank financing and green bond instruments are increasingly used to fund BRT infrastructure development in emerging markets.
Future Market Outlook (2026-2034)
The bus rapid transit systems (BRT) market is projected to grow from USD 977.6 Million in 2025 to USD 1,038.4 Million in 2026, reaching USD 1,710.4 Million by 2034, registering a CAGR of 6.22% during 2026-2034.
Four forces will shape the market through 2034: accelerating fleet electrification as zero-emission mandates tighten across North America, Europe, and leading Asia-Pacific markets; continued BRT corridor development in high-growth emerging cities; deeper integration of smart transit technologies enhancing BRT system performance and passenger experience; and growing BRT deployment as the preferred transit investment in secondary and tertiary cities seeking cost-effective mass transit solutions.
By 2034, the bus rapid transit systems (BRT) market is expected to be characterized by a diversified fleet mix with a substantially higher share of electric and alternative-fuel vehicles, fully integrated smart transit capabilities, and expanding geographic presence across emerging markets in Asia-Pacific, Latin America, and Africa. Articulated bus configurations and natural gas and electric fuel types will continue to anchor their respective segment leadership positions, while new technologies reshape the competitive landscape among vehicle OEMs.
Research Methodology
Primary Research
Primary research included structured interviews with bus manufacturers, transit authority procurement officers, urban transport planners, fleet operators, and BRT infrastructure developers, validating market sizing, segment mix, and regional demand patterns.
Secondary Research
Secondary sources included national transport ministry publications, multilateral development bank BRT project databases, International Association of Public Transport (UITP) data, World Resources Institute BRT Data reports, annual reports and investor presentations from leading OEMs, and publicly available government transit procurement records.
Forecasting Models
Market forecasts used top-down and bottom-up models combining BRT corridor expansion data, vehicle procurement trends, fleet renewal cycle analysis, and macroeconomic variables. Scenario analysis addressed regulatory developments, electrification pace, urbanization trajectories, and infrastructure investment trends across key regional markets.
Bus Rapid Transit Systems (BRT) Market Report Coverage:
| Report Features | Details |
|---|---|
| Base Year of the Analysis | 2025 |
| Historical Period | 2020-2025 |
| Forecast Period | 2026-2034 |
| Units | Million USD |
| Scope of the Report |
Exploration of Historical Trends and Market Outlook, Industry Catalysts and Challenges, Segment-Wise Historical and Future Market Assessment:
|
| Bus Types Covered | Standard, Articulated, and Others |
| System Types Covered | Open BRT System, Closed BRT System, Hybrid BRT System |
| Fuel Types Covered | Diesel, Natural Gas, and Others |
| Regions Covered | Asia Pacific, Europe, North America, Latin America, Middle East and Africa |
| Countries Covered | United States, Canada, Germany, France, United Kingdom, Italy, Spain, Russia, China, Japan, India, South Korea, Australia, Indonesia, Brazil, Mexico |
| Companies Covered | AB Volvo, Zhengzhou Yutong Group Co., Ltd., BYD Company Limited, Volkswagen AG, etc. |
| Customization Scope | 10% Free Customization |
| Post-Sale Analyst Support | 10-12 Weeks |
| Delivery Format | PDF and Excel through Email (We can also provide the editable version of the report in PPT/Word format on special request) |
Frequently Asked Questions About the Bus Rapid Transit Systems (BRT) Market Report
The bus rapid transit systems (BRT) market size is estimated at USD 1,038.4 Million in 2026, driven by urban transit infrastructure investment, government emissions mandates, and growing demand for cost-effective high-capacity public transportation globally.
The market is projected to grow at a CAGR of 6.22% from 2026-2034, reaching USD 1,710.4 Million, supported by fleet electrification, BRT corridor expansion, and continued urbanization across emerging markets.
Articulated leads the bus type segment at 46.8% in 2025, driven by high passenger capacity requirements of primary BRT corridors and the operational efficiency benefits of articulated configurations on dedicated BRT lanes.
Natural gas leads the fuel type segment at 45.7% in 2025, reflecting widespread CNG adoption as a lower-emission alternative to diesel across BRT fleets in North America, Asia-Pacific, and Latin America.
North America commands 34.6% share in 2025, anchored by an extensive established BRT corridor network in the United States and Canada, supported by strong federal and municipal transit funding and fleet renewal programs.
Asia-Pacific is the fastest growing region, driven by rapid urbanization, large-scale government investment in urban mass transit, and expanding BRT networks across China, India, and Southeast Asia through the forecast period.
Leading players include AB Volvo, Zhengzhou Yutong Group Co., Ltd., BYD Company Limited, and Volkswagen AG, among others.
Key drivers include rapid urbanization and growing mass transit demand, government emissions reduction mandates, the cost advantage of BRT over rail infrastructure, expanding smart city initiatives, and the electrification of BRT fleets driven by global net-zero commitments and transit decarbonization programs.
Need more help?
- Speak to our experienced analysts for insights on the current market scenarios.
- Include additional segments and countries to customize the report as per your requirement.
- Gain an unparalleled competitive advantage in your domain by understanding how to utilize the report and positively impacting your operations and revenue.
- For further assistance, please connect with our analysts.
 Request Customization
 Speak to an Analyst
 Request Brochure
 Inquire Before Buying
Benefits of Customization
- Personalize this research
- Triangulate with your data
- Get data as per your format and definition
- Gain a deeper dive into a specific application, geography, customer, or competitor
- Any level of personalization
Get in Touch With Us
UNITED STATES
Phone: +1-201-971-6302
INDIA
Phone: +91-120-433-0800
UNITED KINGDOM
Phone: +44-753-714-6104
Email: [email protected]
Client Testimonials












Related Reports

Choose your plan
*Please note that the prices mentioned below are starting prices for each bundle type. Kindly contact our team for further details.*
Single User License
- 1 User License, Access on 2 Devices
- PDF Report + Excel Dataset (Password Protected)
- Lifetime Access
- No Printing Rights
- 10% Free Report Customization
- 10–12 Weeks of Analyst Support
Five User License
- Access for 5 Users, 2 Devices per User
- PDF Report + Excel Dataset (Password Protected)
- Lifetime Access
- Dedicated Account Manager
- 12–14 Weeks of Analyst Support
- No Printing Rights
- 15% Free Report Customization
- 25% Discount on Your Next Purchase
Corporate User License
- Unlimited User Access (Within Your Organization)
- PDF Report + Excel Dataset
- Lifetime Access
- Dedicated Account Manager
- 14–20 Weeks of Analyst Support
- No Printing Rights
- 20% Free Report Customization
- 30% Discount on Your Next Purchase
Essential Insights
What's included:
3 reports
- Lifetime Access
- PDF Reports
- Excel Datasets
- 2 Weeks of Free Analyst Support
- 2 User Licenses
- Access on 2 Devices
- Printing Rights
- Complimentary PowerPoint (PPT) Version
- Complimentary License Upgrade
Professional Access
What's included:
5 reports
- Lifetime Access
- PDF Reports
- Excel Datasets
- 8 Weeks of Free Analyst Support
- 2 User Licenses
- Access on 2 Devices
- Printing Rights
- Complimentary PowerPoint (PPT) Version
- Complimentary License Upgrade
Business Advantage
What's included:
8 reports
- Lifetime Access
- PDF Reports
- Excel Datasets
- 14 Weeks of Free Analyst Support
- 2 User Licenses
- Access on 2 Devices
- Printing Rights
- Complimentary PowerPoint (PPT) Version
- Complimentary License Upgrade
Enterprise Intelligence
What's included:
10 reports
- Lifetime Access
- PDF Reports
- Excel Datasets
- 20 Weeks of Free Analyst Support
- 2 User Licenses
- Access on 2 Devices
- Printing Rights
- Complimentary PowerPoint (PPT) Version
- Complimentary License Upgrade