
Chlorinated Paraffin Prices, Trend, Chart, Demand, Market Analysis, News, Historical and Forecast Data Report 2026 Edition
Chlorinated Paraffin Price Trend, Index and Forecast
Track real-time and historical chlorinated paraffin prices across global regions. Updated monthly with market insights, drivers, and forecasts.
Chlorinated Paraffin Prices May 2026
| Region | Price (USD/KG) | Latest Movement |
|---|---|---|
| Northeast Asia | 0.85 | 9.0% ↑ Up |
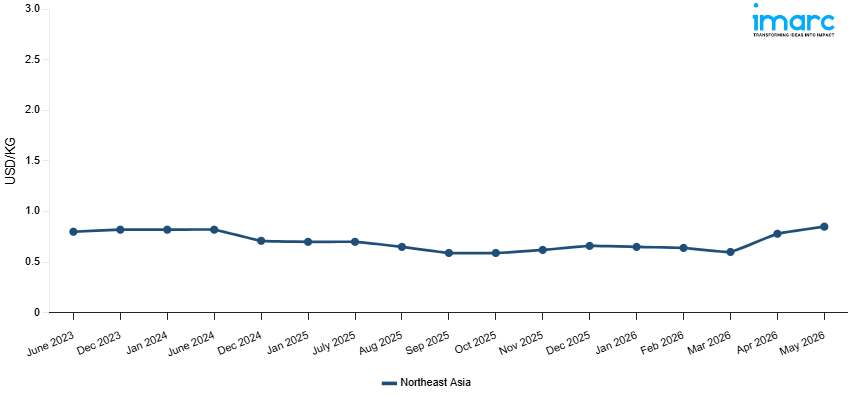
Chlorinated Paraffin Price Index (USD/KG):
The chart below highlights monthly chlorinated paraffin prices across different regions.
Get Access to Monthly/Quarterly/Yearly Prices, Request Sample
Market Overview Q1 Ending March 2026
Northeast Asia: The chlorinated paraffin prices in Northeast Asia reached 0.6 USD/KG in March 2026. The downward pricing movement registered between December and March 2026 was 9.1%. However, the marked decline in prices can be mainly attributed to the weakened downstream demand from the PVC plasticizer, metal working fluid, and flame retardants production sectors, which lowered the procurement volumes due to the sluggish industrial and construction activity prevailing in the region. The declining prices of raw materials such as paraffin wax and chlorine feedstocks lowered production costs, supporting manufacturers in the region. The high inventory levels among key manufacturers increased competitive pressure to discount prices and stimulate inventory liquidation. In addition, the increased scrutiny on the environment regulations pertaining to chlorinated paraffins lowered the consumption activity as the downstream manufacturers began to explore alternatives for the plasticizers. The sluggish export inquiries from traditional markets offered limited support for prices, while the conservative approach of downstream buyers to procure material in anticipation of further price decreases sustained the high bearish prices prevailing during the quarter.
Market Overview Q4 Ending December 2025
Northeast Asia: The chlorinated paraffin prices in Northeast Asia reached 0.66 USD/KG in December 2025. The upward pricing movement registered between September and December 2025 was 12.1%. Firm upstream paraffin wax and chlorine feedstock costs were the main drivers of the significant price increase, which raised production costs at all of the region's key manufacturing plants. As downstream industries kept active procurement schedules to meet year-end production commitments, consumption was supported by sustained demand from the PVC plasticizer and metalworking fluids sectors. Furthermore, regional availability was constrained by tighter supply stemming from production curtailments at specific Chinese plants to meet environmental compliance requirements, further strengthening the bullish pricing momentum. Key customers' strategic inventory building in anticipation of ongoing supply constraints increased procurement competitiveness and kept the market rate higher throughout the quarter.
Market Overview Q3 Ending September 2025
Northeast Asia: The downward pressure on prices was largely influenced by a combination of demand-side and supply-side factors. On the demand side, slower industrial activity in key manufacturing hubs temporarily reduced procurement volumes from sectors such as coatings, plastics, and rubber processing. On the supply side, local producers increased output in anticipation of stable global demand, contributing to a temporary surplus in the market. Regulatory compliance costs for chemical handling and environmental measures continued to be a factor, though they did not offset the overall price decline. International shipping costs for imported raw materials remained relatively steady, ensuring that supply chains were not significantly disrupted.
Chlorinated Paraffin Price Trend, Market Analysis, and News
IMARC's latest publication, “Chlorinated Paraffin Prices, Trend, Chart, Demand, Market Analysis, News, Historical and Forecast Data Report 2026 Edition,” presents a detailed examination of the chlorinated paraffin market, providing insights into both global and regional trends that are shaping prices. This report delves into the spot price of chlorinated paraffin at major ports and analyzes the composition of prices, including FOB and CIF terms. It also presents detailed chlorinated paraffin prices trend analysis by region, covering North America, Europe, Asia Pacific, Latin America, and Middle East and Africa. The factors affecting chlorinated paraffin pricing, such as the dynamics of supply and demand, geopolitical influences, and sector-specific developments, are thoroughly explored. This comprehensive report helps stakeholders stay informed with the latest market news, regulatory updates, and technological progress, facilitating informed strategic decision-making and forecasting.
Chlorinated Paraffin Market Analysis
The global chlorinated paraffin industry size reached USD 2.25 Billion in 2025. By 2034, IMARC Group expects the market to reach USD 3.07 Billion, at a projected CAGR of 3.48% during 2026-2034. The market is driven by the increased use of chlorinated paraffins as plasticizers and flame retardants, rising demand from construction and automotive sectors, expanding applications in metalworking fluids, and ongoing investments in polymer and coating industries.
Latest developments in the chlorinated paraffin industry:
- June 2025: Lords Chloro Alkali announced plans to expand its chlorinated paraffin wax capacity to 100 TPD, aiming to meet rising demand from plastics, rubber, coatings, and metalworking industries. The expansion was expected to strengthen the company’s market position, improve operational efficiency, and enhance supply reliability for key customers.
- May 2024: Unid announced the expansion of its chlorinated paraffin wax (CPs) facility with a scale of about 90,000 tons in its subsidiary UNID Jiangsu Chemical Co., Ltd.
- March 2023: Payal Group announced the expansion of its chlorinated paraffin production capacity by 35 kilo tonnes per annum (KTA) at its integrated plant in Dahej, Gujarat, raising its total capacity to 70 KTA and positioning it among the top three producers in India. This expansion aims to support the growing downstream PVC industry in the region and enhance exports of secondary plasticizers.
Product Description
Chlorinated paraffin is an industrial chemical produced by the chlorination of paraffin wax, consisting of hydrocarbons that contain 10 to 30 carbon atoms. Due to their high chlorine content, chlorinated paraffins have low volatility, which reduces the risk of vapor loss at high temperatures. This property is particularly important in applications like PVC plasticizers and metalworking fluids, where stability under heat is crucial. Chlorinated paraffins are chemically stable, which makes them suitable for use in harsh environments where chemical reactions are a concern. This stability contributes to the longevity and durability of products containing these compounds. Besides this, they are also utilized as flame retardants as they contain chlorine, especially in the application of fabrics, rubber, and sealants. It is widely used in metal working fluids where it functions as an EP or extreme pressure agent to enhance the fluidity of the substance and minimize the wear of the tools.
Report Coverage
| Key Attributes | Details |
|---|---|
| Product Name | Chlorinated Paraffin |
| Report Features | Exploration of Historical Trends and Market Outlook, Industry Demand, Industry Supply, Gap Analysis, Challenges, Chlorinated Paraffin Price Analysis, and Segment-Wise Assessment. |
| Currency/Units | US$ (Data can also be provided in local currency) or Metric Tons |
| Region/Countries Covered | The current coverage includes analysis at the global and regional levels only. Based on your requirements, we can also customize the report and provide specific information for the following countries: Asia Pacific: China, India, Indonesia, Pakistan, Bangladesh, Japan, Philippines, Vietnam, Thailand, South Korea, Malaysia, Nepal, Taiwan, Sri Lanka, Hongkong, Singapore, Australia, and New Zealand Europe: Germany, France, United Kingdom, Italy, Spain, Russia, Turkey, Netherlands, Poland, Sweden, Belgium, Austria, Ireland, Switzerland, Norway, Denmark, Romania, Finland, Czech Republic, Portugal and Greece North America: United States and Canada Latin America: Brazil, Mexico, Argentina, Columbia, Chile, Ecuador, and Peru Middle East & Africa: Saudi Arabia, UAE, Israel, Iran, South Africa, Nigeria, Oman, Kuwait, Qatar, Iraq, Egypt, Algeria, and Morocco The list of countries presented is not exhaustive. Information on additional countries can be provided if required by the client. |
| Information Covered for Key Suppliers |
|
| Customization Scope | The report can be customized as per the requirements of the customer |
| Report Price and Purchase Option |
Plan A: Monthly Updates - Annual Subscription
Plan B: Quarterly Updates - Annual Subscription
Plan C: Biannually Updates - Annual Subscription
|
| Post-Sale Analyst Support | 360-degree analyst support after report delivery |
| Delivery Format | PDF and Excel through email (We can also provide the editable version of the report in PPT/Word format on special request) |
Key Benefits for Stakeholders:
- IMARC’s report presents a detailed analysis of chlorinated paraffin pricing, covering global and regional trends, spot prices at key ports, and a breakdown of Ex Works, FOB, and CIF prices.
- The study examines factors affecting chlorinated paraffin price trend, including raw material costs, supply-demand shifts, geopolitical impacts, and industry developments, offering insights for informed decision-making.
- The competitive landscape review equips stakeholders with crucial insights into the latest market news, regulatory changes, and technological advancements, ensuring a well-rounded, strategic overview for forecasting and planning.
- IMARC offers various subscription options, including monthly, quarterly, and biannual updates, allowing clients to stay informed with the latest market trends, ongoing developments, and comprehensive market insights. The chlorinated paraffin price charts ensure our clients remain at the forefront of the industry.
Frequently Asked Questions About the Chlorinated Paraffin Prices Report
The chlorinated paraffin prices in May 2026 were 0.85 USD/Kg in Northeast Asia.
The chlorinated paraffin pricing data is updated on a monthly basis.
We provide the pricing data primarily in the form of an Excel sheet and a PDF.
Yes, our report includes a forecast for chlorinated paraffin prices.
The regions covered include North America, Europe, Asia Pacific, Middle East, and Latin America. Countries can be customized based on the request (additional charges may be applicable).
Yes, we provide both FOB and CIF prices in our report.
Need more help?
- Speak to our experienced analysts for insights on the current market scenarios.
- Include additional segments and countries to customize the report as per your requirement.
- Gain an unparalleled competitive advantage in your domain by understanding how to utilize the report and positively impacting your operations and revenue.
- For further assistance, please connect with our analysts.
 Request Customization
 Inquire Before Buying
 Speak to an Analyst
 Request Brochure
Benefits of Customization
- Personalize this research
- Triangulate with your data
- Get data as per your format and definition
- Gain a deeper dive into a specific application, geography, customer, or competitor
- Any level of personalization
Get in Touch With Us
UNITED STATES
Phone: +1-201-971-6302
INDIA
Phone: +91-120-433-0800
UNITED KINGDOM
Phone: +44-753-714-6104
Email: [email protected]
Client Testimonials


.webp)


Why Choose Us
IMARC offers trustworthy, data-centric insights into commodity pricing and evolving market trends, enabling businesses to make well-informed decisions in areas such as procurement, strategic planning, and investments. With in-depth knowledge spanning more than 1000 commodities and a vast global presence in over 150 countries, we provide tailored, actionable intelligence designed to meet the specific needs of diverse industries and markets.
1000
+Commodities
150
+Countries Covered
3000
+Clients
20
+Industry
Robust Methodologies & Extensive Resources
IMARC delivers precise commodity pricing insights using proven methodologies and a wealth of data to support strategic decision-making.
Subscription-Based Databases
Our extensive databases provide detailed commodity pricing, import-export trade statistics, and shipment-level tracking for comprehensive market analysis.
Primary Research-Driven Insights
Through direct supplier surveys and expert interviews, we gather real-time market data to enhance pricing accuracy and trend forecasting.
Extensive Secondary Research
We analyze industry reports, trade publications, and market studies to offer tailored intelligence and actionable commodity market insights.
Trusted by 3000+ industry leaders worldwide to drive data-backed decisions. From global manufacturers to government agencies, our clients rely on us for accurate pricing, deep market intelligence, and forward-looking insights.