
Clams, Cockles, Ark Shells Market Size, Share, Trends and Forecast by Type, Packaging Form, End User, and Region, 2026-2034
Clams, Cockles, Ark Shells Market Size, Share, Trends & Forecast (2026-2034)
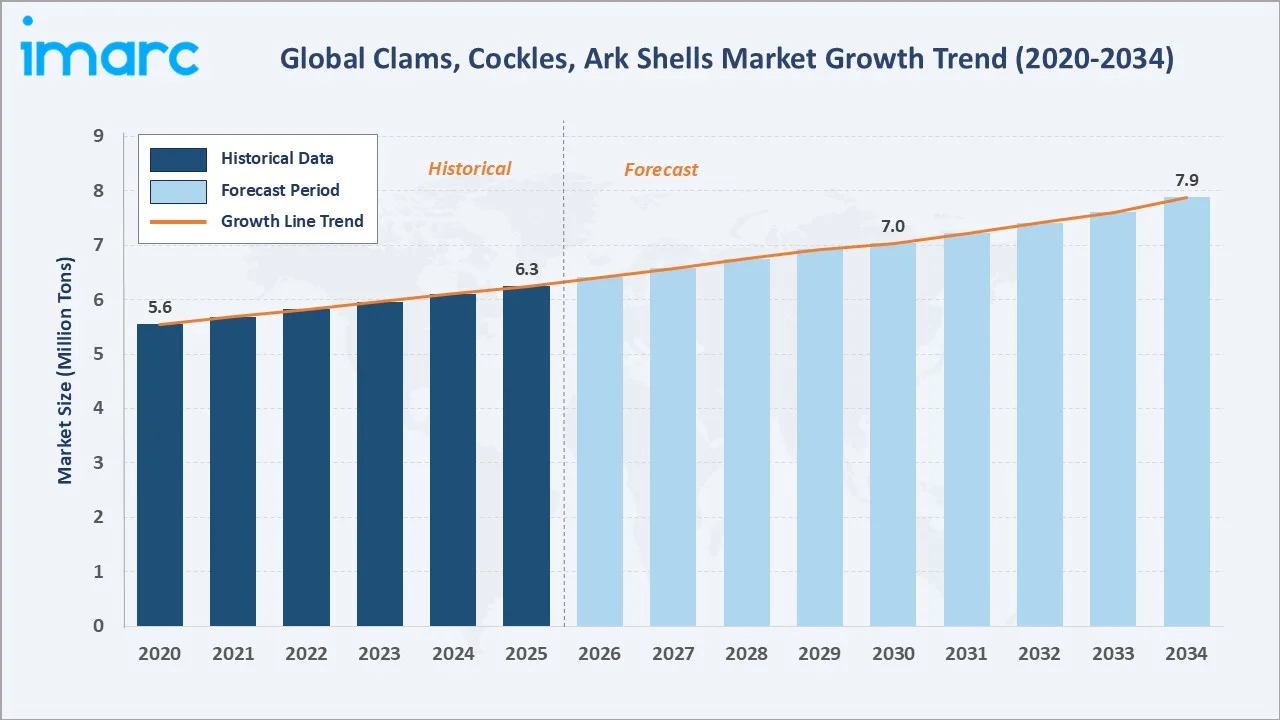
The global clams, cockles, ark shells market reached 6.3 Million Tons in 2025 and is projected to reach 7.9 Million Tons by 2034, growing at a CAGR of 2.40% during 2026-2034. Market growth is driven by rising global seafood consumption, growing health awareness of bivalve mollusc nutritional benefits, expansion of shellfish aquaculture, and increasing demand from the foodservice and restaurant industries.
Market Snapshot
|
Metric |
Value |
|
Market Volume (2025) |
6.3 Million Tons |
|
Forecast Market Volume (2034) |
7.9 Million Tons |
|
CAGR (2026-2034) |
2.40% |
|
Base Year |
2025 |
|
Historical Period |
2020-2025 |
|
Forecast Period |
2026-2034 |
Asia-Pacific's 36.8% dominance reflects the region's deep cultural tradition of bivalve consumption and its position as both the world's largest shellfish producer and consumer. China leads Asia-Pacific production with massive clam and cockle farming operations in coastal provinces, including Fujian, Guangdong, and Liaoning.
To get more information on this market, Request Sample
The market's 2.40% CAGR reflects steady, demand-led growth constrained by the finite wild harvest carrying capacity and the measured pace of aquaculture expansion. Bivalve mollusc markets grow in line with broader seafood consumption trends, supported by the growing recognition of clams, cockles, and ark shells as sustainable protein sources with very low feed conversion requirements and positive environmental characteristics compared to finfish aquaculture.
Executive Summary
The global clams, cockles, ark shells market is growing steadily, supported by expanding aquaculture output, growing foodservice demand for premium shellfish, and increasing health-conscious consumer interest in bivalve molluscs as a nutrient-dense seafood. From 6.3 Million Tons in 2025, the market will reach 7.9 Million Tons by 2034, adding 1.6 Million Tons at a 2.40% CAGR.
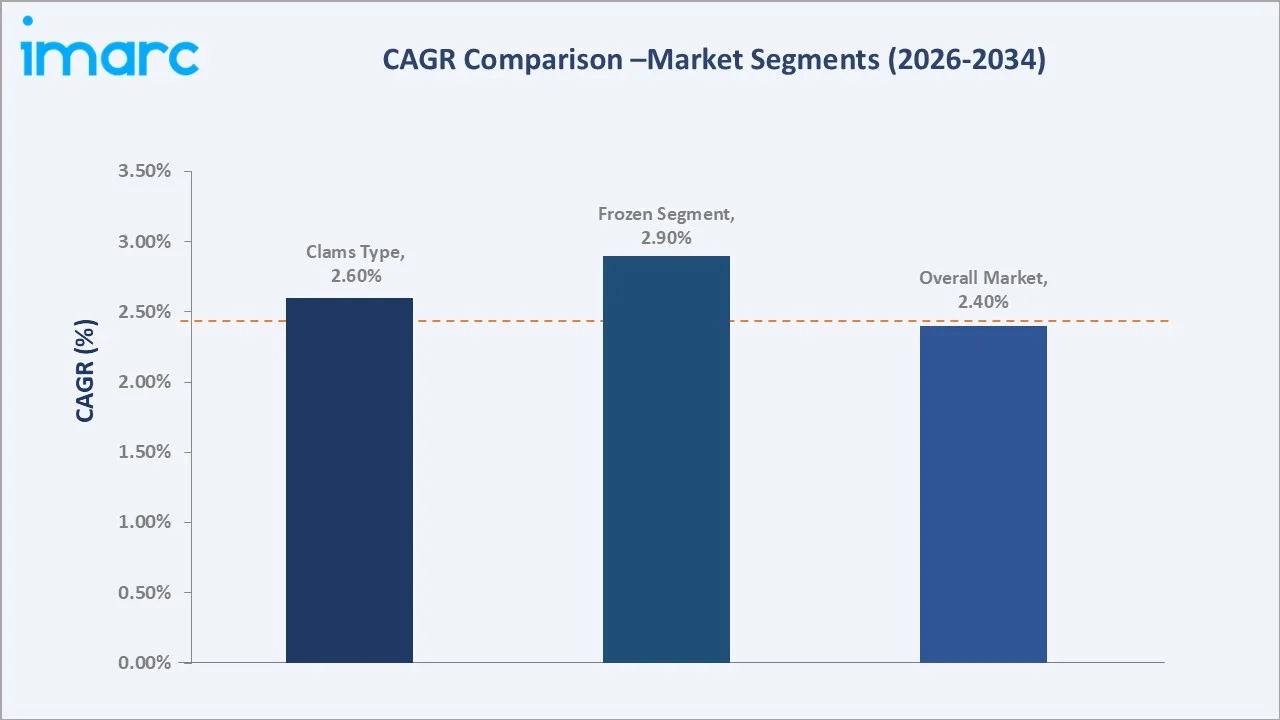
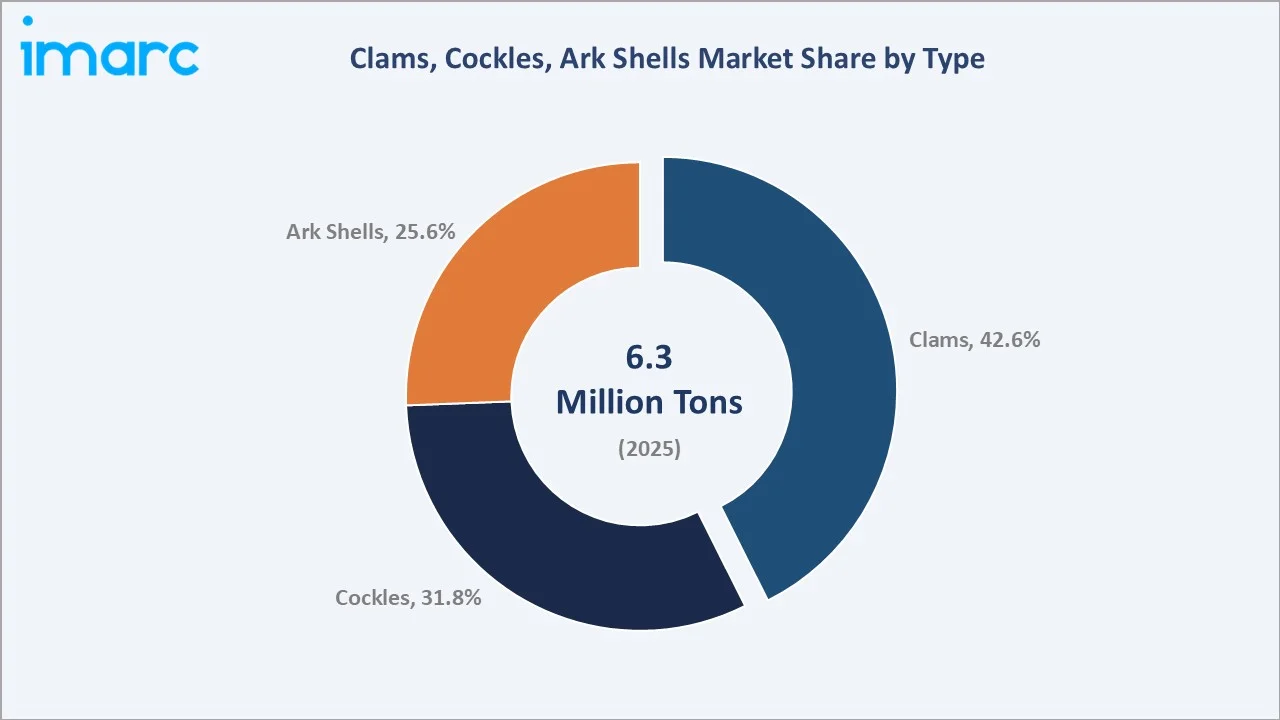
Clams lead the type segment at 42.6% in 2025, reflecting their broad culinary versatility across Asian, European, and North American cuisine traditions. Fresh packaging form at 38.9% dominates as the premium quality format preferred by restaurants and high-end seafood retailers, while frozen packaging form at 29.7% is growing fastest as convenience-oriented retail and food processing demand expands globally.
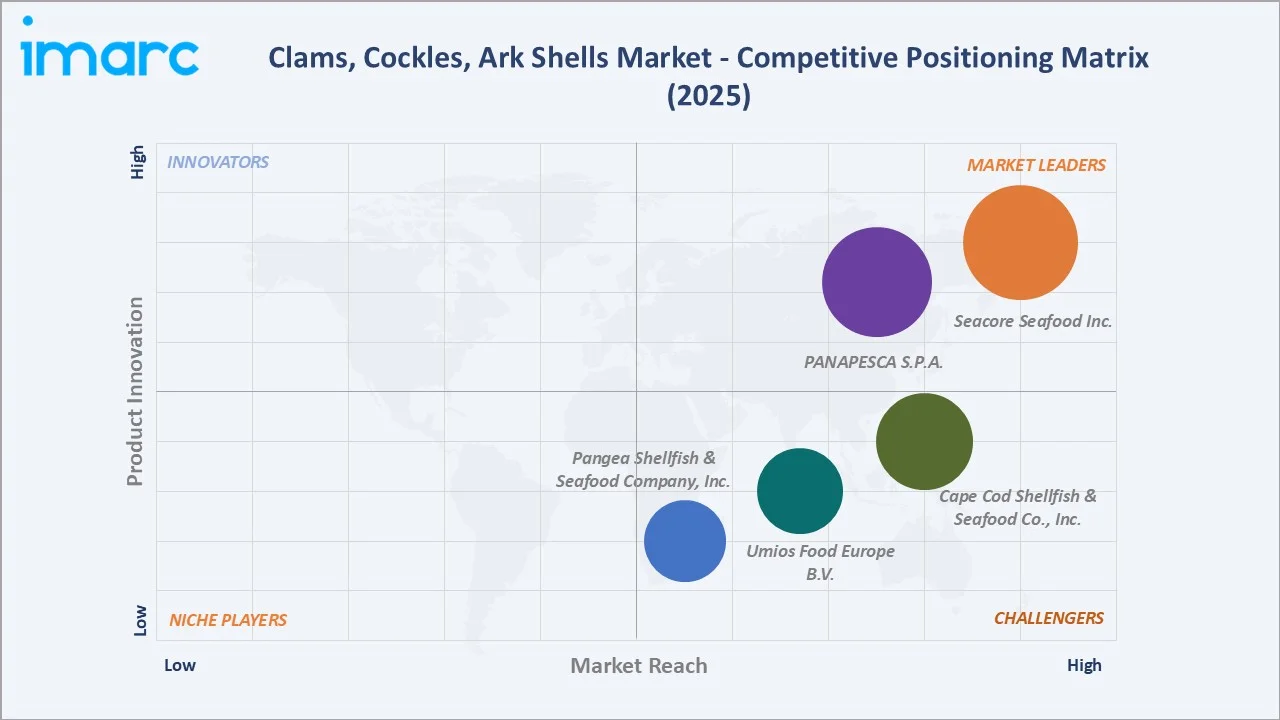
Key players, including Seacore Seafood Inc., PANAPESCA S.P.A., Cape Cod Shellfish & Seafood Co., Inc., Umios Food Europe B.V., and Pangea Shellfish & Seafood Company, Inc., compete through species specialization, geographic supply chain coverage, quality and sustainability certification, and foodservice and retail channel relationship depth.
Key Market Insights
|
Insight |
Data |
|
Largest Type Segment |
Clams – 42.6% share (2025) |
|
Fastest Growing Type |
Clams – driven by global culinary adoption and aquaculture expansion |
|
Largest Packaging Form |
Fresh – 38.9% share (2025) |
|
Fastest Growing Packaging |
Frozen – ~2.90% CAGR (retail and food processing demand) |
|
Leading Region |
Asia-Pacific – 36.8% share (2025) |
|
Top Companies |
Seacore Seafood Inc., PANAPESCA S.P.A., Cape Cod Shellfish & Seafood Co., Inc., Umios Food Europe B.V., and Pangea Shellfish & Seafood Company, Inc. |
Key Analytical Observations:
- Clams command a 42.6% type share in 2025, reflecting their extraordinary culinary versatility and established demand across three major seafood consumption regions. In the Asia-Pacific region, short-necked clams are the dominant aquaculture species, produced on an estimated 5+ Million Tons annually across China, Japan, and South Korea.
- Cockles at 31.8% (2025) are the dominant bivalve in several European markets, particularly the UK, the Netherlands, Belgium, and Spain, where cockle beds in the Thames Estuary, Morecambe Bay, the Wash, and Galician estuaries support both wild fishery and growing aquaculture output.
- Ark shells at 25.6% (2025) are primarily consumed in East Asian markets, South Korea, Japan, and Southeast Asia, where their distinctive blood-rich meat is prized as a specialty ingredient in sashimi, rice dishes, and Korean BBQ accompaniments.
- Fresh packaging at 38.9% reflects the premium quality positioning and restaurant sector preference for live shellfish delivered in optimal condition. Foodservice operators and upscale seafood retailers prioritize fresh live clams, cockles, and ark shells for presentation quality and maximum consumer appeal.
Clams, Cockles, Ark Shells Market Overview
Clams, cockles, and ark shells are marine bivalve molluscs belonging to distinct families but sharing commercial significance as globally consumed seafood commodities. Clams encompass hundreds of species, including the Manila clam, quahog, razor clam, and surf clam. Cockles are harvested primarily in European Atlantic and North Sea coastal ecosystems. Ark shells are farmed and harvested across Asian coastal waters, valued for their distinctive flavor profile.
The market encompasses both wild fishery harvest and aquaculture farming, with aquaculture accounting for an increasingly dominant share of total supply as wild stocks face harvesting pressure. Of the 20.5 million tons of molluscs produced globally each year, approximately 11.5 million tons are bivalves sourced from aquaculture. This includes over 4 million tons each of clams and oysters, along with around 1.5 million tons each of scallops and mussels.
The market serves two primary end-user channels: foodservice (restaurants, hotels, catering), consuming primarily fresh and live product, and retail (supermarkets, fishmongers) serving both fresh, frozen, and canned product formats.
Market Dynamics
To evaluate market opportunities, Request Sample
Market Drivers
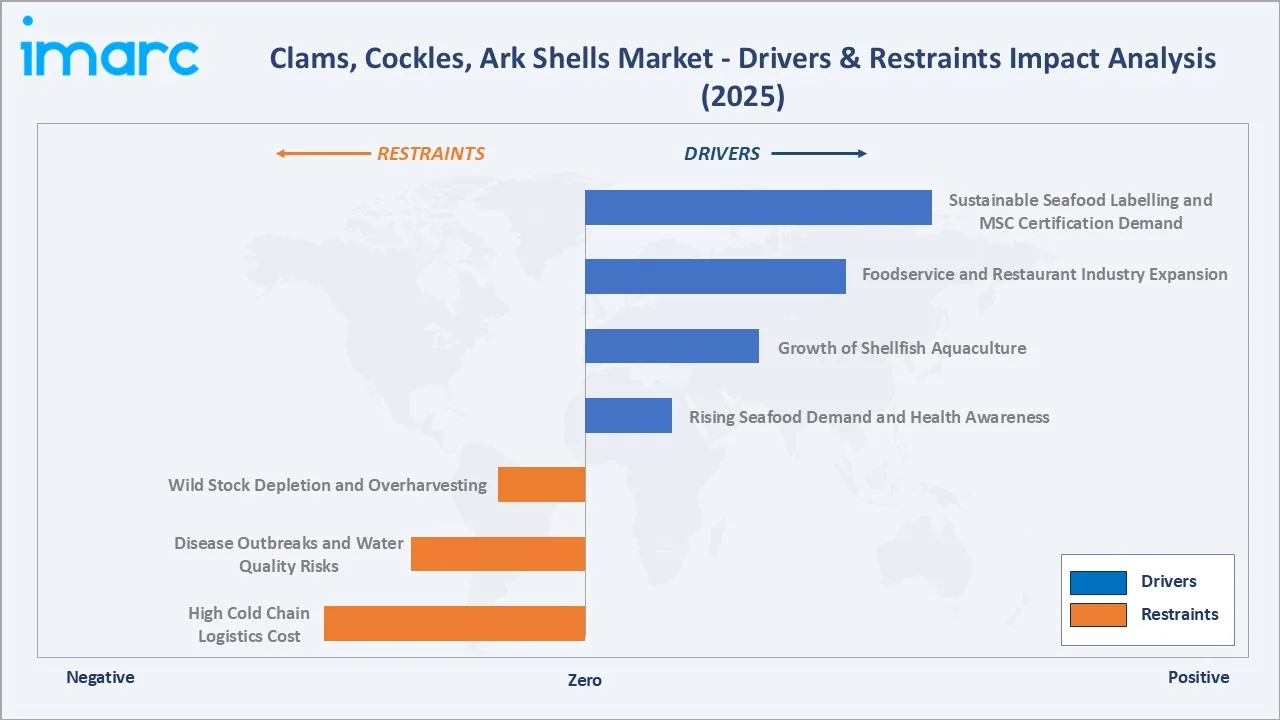
- Rising Seafood Demand and Health Awareness: Global apparent per capita consumption of aquatic animal foods is expected to rise from 21.1 kg during 2022–2024 to 21.8 kg by 2034, driven by rising incomes in developing markets and consumer health-driven dietary shifts from red meat toward lean protein sources.
- Growth of Shellfish Aquaculture: Global shellfish aquaculture, encompassing clams, oysters, mussels, scallops, and ark shells, is one of the world's most environmentally sustainable forms of food production, requiring no feed inputs, improving water quality through filter feeding, and producing no net GHG emissions per ton of food produced.
- Foodservice and Restaurant Industry Expansion: The global foodservice market was valued at USD 3.19 trillion in 2025 and is projected to grow at a CAGR of 3.02% during 2026–2034, with shellfish representing a consistently popular premium menu item across all cuisine traditions.
- Sustainable Seafood Labelling and MSC Certification Demand: Retail buyers and foodservice operators are increasingly requiring Marine Stewardship Council (MSC) certification for wild shellfish and Aquaculture Stewardship Council (ASC) certification for farmed shellfish products.
Market Restraints
- Wild Stock Depletion and Overharvesting: Many wild cockle and clam fisheries face population pressure from combined commercial harvesting and environmental stresses. The UK's Thames Estuary cockle fishery experienced severe stock collapses in 2003–2004 due to overharvesting combined with adverse winter temperatures.
- Disease Outbreaks and Water Quality Risks: Shellfish filter feeders concentrate waterborne pathogens, including norovirus, hepatitis A, Vibrio bacteria, and toxic algal bloom toxins (paralytic and diarrhetic shellfish poisoning) in their tissues, creating food safety risks requiring monitoring and harvest area closures.
- High Cold Chain Logistics Cost: Fresh live shellfish require continuous cold chain management from harvest through delivery, with maximum viable live transport times of 5–10 days for most species. This cold chain requirement creates logistical complexity and cost for international trade.
Market Opportunities
- IQF Frozen Shellfish Product Development: Individual Quick Freezing (IQF) technology for pre-cooked and shucked shellfish meat enables near-fresh quality frozen products with 12–24 month shelf life, significantly expanding the geographic distribution range of specialty shellfish, including ark shells and razor clams, into markets previously inaccessible due to cold chain limitations.
- E-Commerce and Direct-to-Consumer Shellfish Retail: Digitally-native seafood subscription boxes and D2C shellfish delivery companies are creating premium-priced, high-margin distribution channels that bypass traditional wholesale intermediaries.
- Restaurant Chain Institutional Supply Development: As major restaurant chains in Asia expand into new markets, they create structured long-term supply requirements for specific shellfish species that provide demand visibility and pricing stability for dedicated shellfish suppliers building category expertise.
Market Challenges
- Climate Change Impacts on Shellfish Habitat: Ocean acidification, from increasing atmospheric CO₂ absorption by seawater, is reducing carbonate ion concentrations that shellfish require to build their calcium carbonate shells.
- Consumer Education and Product Unfamiliarity: Outside established shellfish-consuming cultures, clams, cockles, and ark shells face consumer unfamiliarity barriers. Cockles are largely unknown to consumers in North America, where clam chowder and steamers dominate the bivalve consumption tradition.
Emerging Market Trends
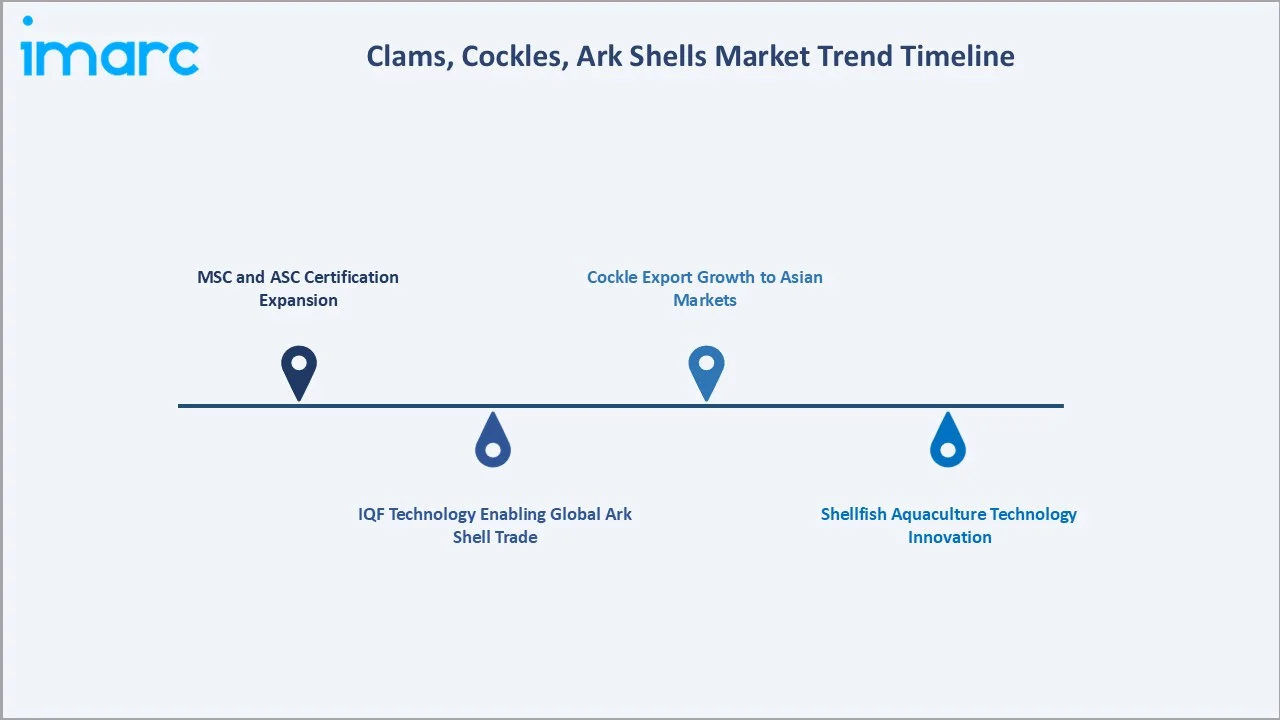
1. MSC and ASC Certification Expansion
The Marine Stewardship Council and Aquaculture Stewardship Council certification programs are expanding their shellfish coverage, with new MSC assessments underway for European cockle fisheries in the Wadden Sea and Welsh cockle beds, and ASC farm standards for clam aquaculture being piloted in Vietnam and China.
2. IQF Technology Enabling Global Ark Shell Trade
South Korean and Vietnamese processors are deploying advanced IQF freezing lines for pre-cooked ark shell meat, enabling export of this traditionally difficult-to-distribute species to European and Middle Eastern markets where Korean restaurant expansion is creating demand.
3. Shellfish Aquaculture Technology Innovation
Smart aquaculture monitoring technology, IoT sensors measuring dissolved oxygen, temperature, salinity, and phytoplankton density in shellfish grow-out areas, is being deployed by leading producers, including Penn Cove Shellfish and Van der Lee Seafish BV, to optimize harvest timing and reduce mortality risk.
4. Cockle Export Growth to Asian Markets
European cockle production surplus, particularly from UK and Dutch fisheries during peak harvest periods, is increasingly being directed to Asian export markets where cockle meat is valued as a BBQ and hot pot ingredient. Korean, Chinese, and Thai seafood import volumes of European cockle meat have grown since 2021, providing European cockle fishery operators with an alternative demand channel that improves price discovery and reduces domestic market price volatility.
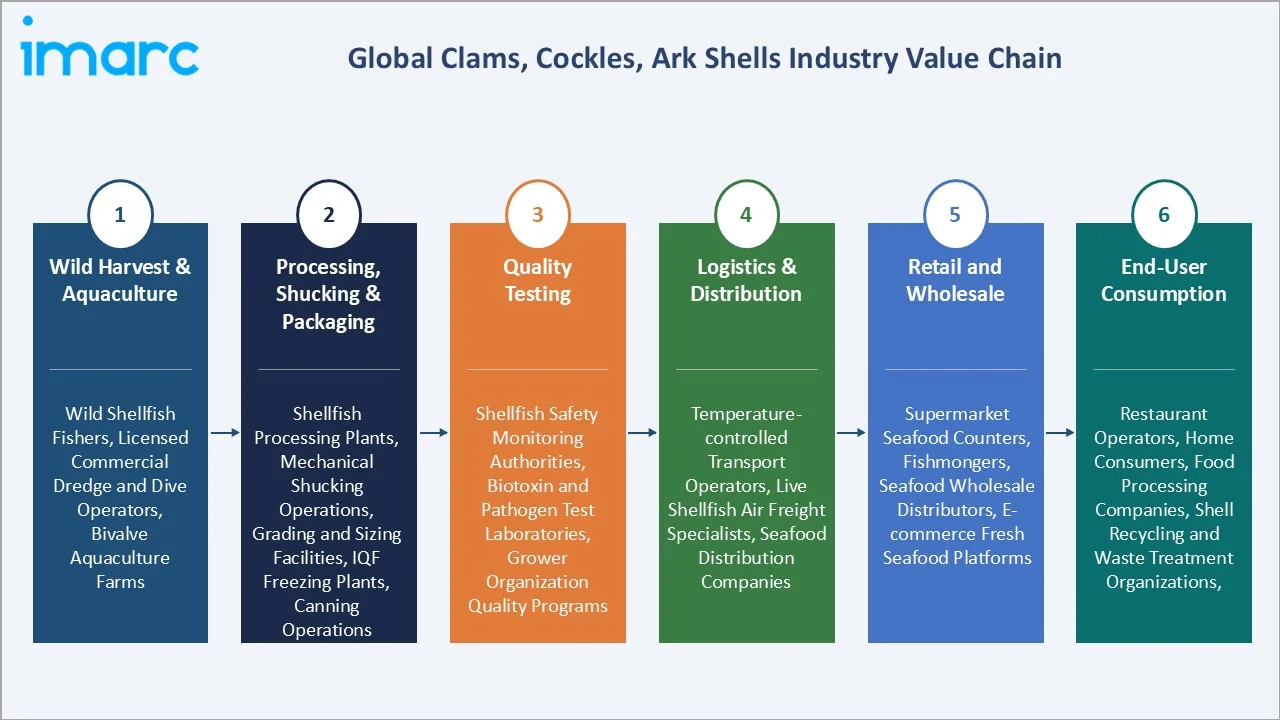
Industry Value Chain Analysis
The clams, cockles, and ark shells value chain extends from wild fishery harvest and aquaculture grow-out through processing, cold chain logistics, and multi-channel retail and foodservice distribution to end consumers.
|
Stage |
Key Players / Examples |
|
Wild Harvest & Aquaculture |
Wild shellfish fishers, licensed commercial dredge and dive operators, bivalve aquaculture farms |
|
Processing, Shucking & Packaging |
Shellfish processing plants, mechanical shucking operations, grading and sizing facilities, IQF freezing plants, canning operations |
|
Quality Testing |
Shellfish safety monitoring authorities, biotoxin and pathogen test laboratories, grower organization quality programs |
|
Logistics & Distribution |
Temperature-controlled transport operators, live shellfish air freight specialists, seafood distribution companies |
|
Retail and Wholesale |
Supermarket seafood counters, fishmongers, seafood wholesale distributors, e-commerce fresh seafood platforms |
|
End-User Consumption |
Restaurant operators, home consumers, food processing companies, shell recycling and waste treatment organizations |
Technology Landscape in the Clams, Cockles, Ark Shells Industry
Shellfish Aquaculture Production Technology
Modern shellfish aquaculture employs bottom culture (seabed substrate seeding), suspended longline culture, and intertidal rack-and-bag systems. Bottom culture dominates large-scale clam and cockle production, with China emerging as one of the largest cultivators of bivalves, with annual production exceeding 4 million tons.
IQF and Cryogenic Freezing Technology
IQF technology freezes individual pre-cooked shucked shellfish pieces at -40°C in 2–4 minutes, producing free-flowing frozen product with superior texture retention versus block freezing. Cryogenic freezing using liquid nitrogen is deployed for ultra-premium products requiring maximum freshness preservation.
Remote Sensing and IoT Monitoring
In-water monitoring buoys measuring dissolved oxygen, temperature, salinity, pH, and chlorophyll-a are becoming standard for shellfish grow-out areas. Harmful algal bloom early warning systems using satellite imagery and in-situ sensors provide 24–72 hour warning of bloom development, reducing the economic impact of mandatory harvest closures.
Market Segmentation Analysis
The report covers the following segments:
|
Segment Category |
Leading Segment |
Market Share |
Year |
|
Type |
Clams |
42.6% |
2025 |
|
Packaging Form |
Fresh |
38.9% |
2025 |
|
End User |
🔒 |
🔒 |
2025 |
|
Region |
Asia-Pacific |
36.8% |
2025 |

By Type
Clams lead at 42.6% in 2025, supported by both the world's largest shellfish aquaculture species (Manila clam) and a broad wild fishery supply across three major seafood-consuming regions. In December 2025, the Bivalvi project used selective breeding to develop faster-growing Manila clams, shortening the production cycle by at least three months.
To access detailed market analysis, Request Sample
Cockles at 31.8% serve primarily European Atlantic seafood markets and Asian export demand for processed cockle meat. Ark shells at 25.6% are the premium East Asian specialty segment, commanding the highest per-kilogram market prices of the three species categories and benefiting from growing Korean and Japanese restaurant expansion in developed Western markets.
By Packaging Form
Fresh packaging leads at 38.9% in 2025, driven by premium restaurant sector demand for live and fresh-chilled shellfish, which commands the highest market prices and is the mandatory format for raw bar and sashimi applications. Fresh shellfish products are delivered on a 24–72 hour cycle from harvest to foodservice receiving docks, requiring highly integrated cold chain logistics between producers and buyers.
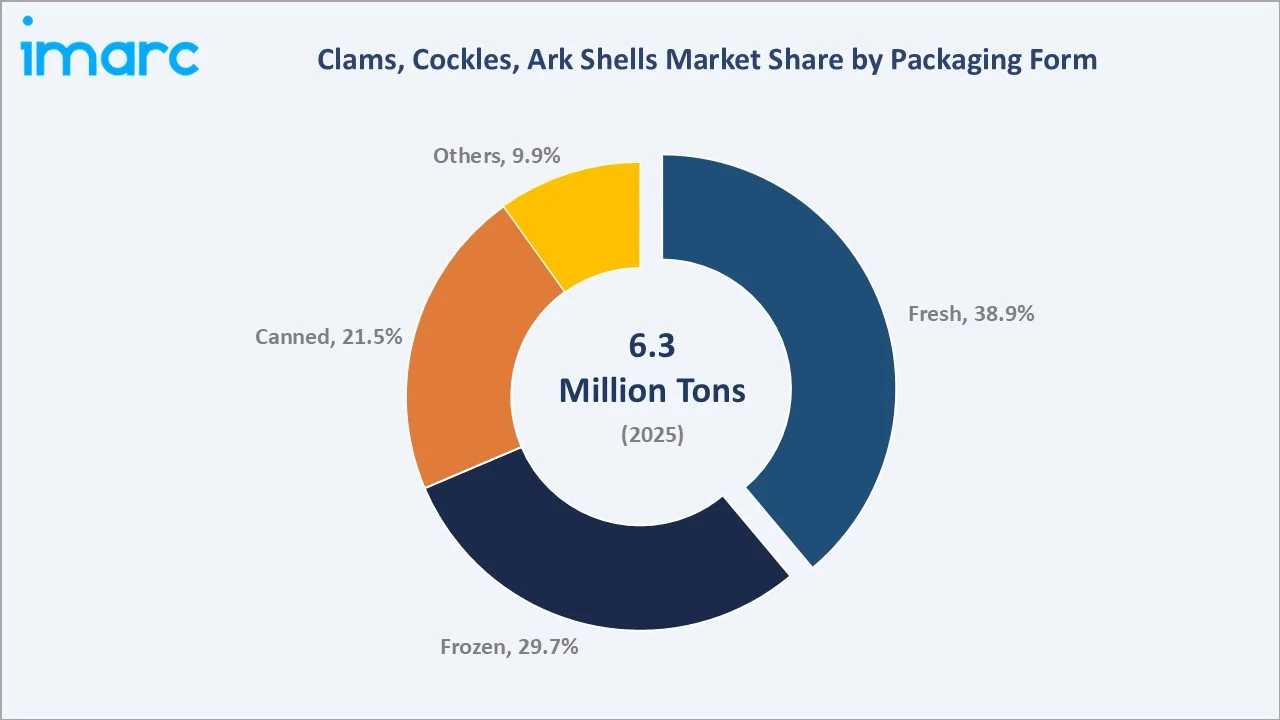
Frozen packaging at 29.7% is the fastest-growing format, enabling global trade in shellfish species that would otherwise be geographically restricted by fresh logistics constraints. Canned shellfish at 21.5% serves the ambient grocery retail and food manufacturing ingredient markets, with clams in particular enjoying strong canned product demand for chowder and pasta sauce applications.
Regional Market Insights
Asia-Pacific leads the global market with a 36.8% share in 2025. The region's dominance is anchored by China's massive Manila clam and ark shell aquaculture production, South Korea's ark shell consumer culture, Japan's premium clam market, and Southeast Asia's significant cockle and blood cockle production and consumption across Thailand, Malaysia, and Vietnam.
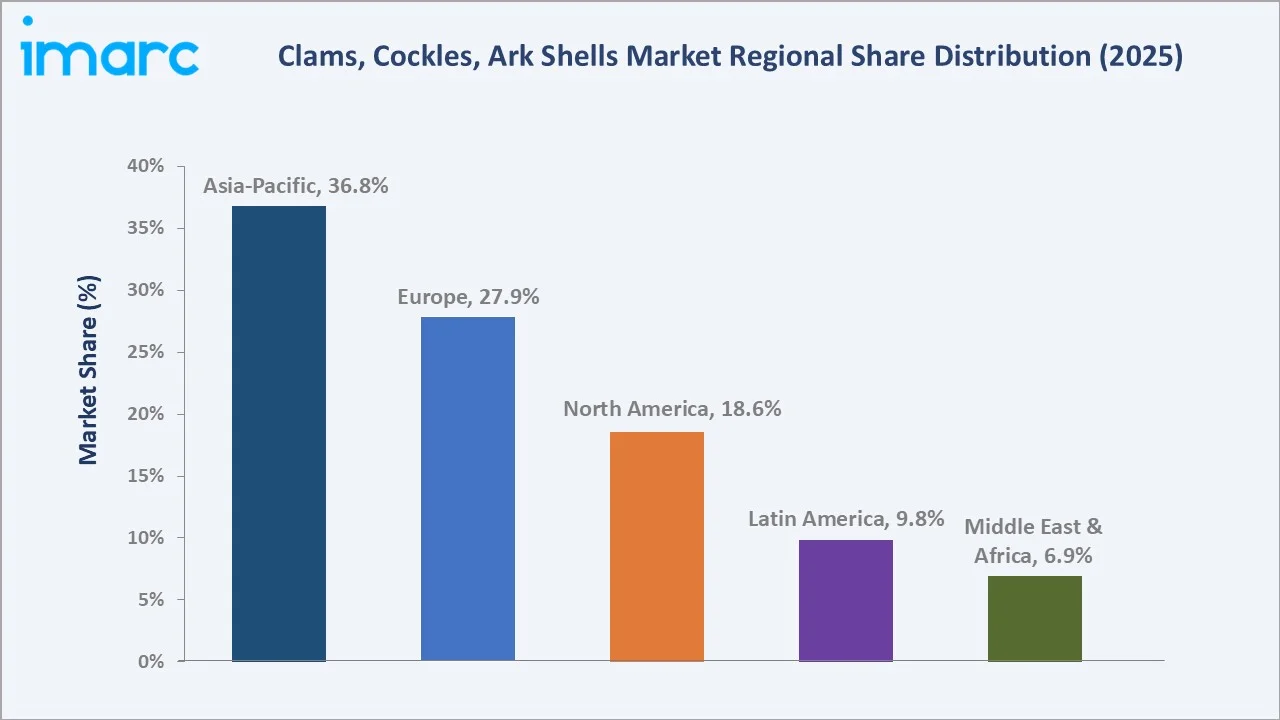
Europe's 27.9% share reflects the region's deep shellfish culinary culture and established commercial fishery and aquaculture infrastructure. The UK's Morecambe Bay and Thames Estuary cockle fisheries, Spain's Galician clam and cockle harvest, and France's palourde aquaculture collectively make Europe a globally significant shellfish production region.
|
Region |
Share (2025) |
Key Growth Drivers |
|
Asia-Pacific |
36.8% |
China's dominant Manila clam and ark shell aquaculture, South Korea's ark shell consumer culture, Japan's premium clam market, Southeast Asian cockle production and consumption |
|
Europe |
27.9% |
UK and Dutch cockle fisheries, Spanish and Portuguese clam aquaculture, French carpet shell clam production, premium gourmet shellfish foodservice demand |
|
North America |
18.6% |
US hard clam and soft-shell clam wild fisheries, New England clam chowder institutional demand, Pacific Northwest Manila clam aquaculture, premium raw bar restaurant sector |
|
Latin America |
9.8% |
Chile's clam and cockle export industry, Mexican Pacific coast clam fisheries, growing seafood consumption in Brazil and Peru |
|
Middle East & Africa |
6.9% |
Growing seafood consumption in Gulf states, South African wild clam fisheries, and rising urbanization |
Competitive Landscape
The global clams, cockles, ark shells market is highly fragmented at the production level, with thousands of wild harvesters and aquaculture operators across Asia-Pacific, Europe, and North America. At the processing and distribution level, a relatively small number of specialist seafood companies provide pan-regional supply chain capabilities.
|
Company Name |
Brands/Products |
Market Position |
Core Strength |
|
Seacore Seafood Inc |
OceanPrime |
Market Leader |
Broad multi-species shellfish product portfolio, integrated cold chain management capabilities, and established distribution network |
|
PANAPESCA S.P.A. |
Shelled Pacific Clams |
Market Leader |
Diversified shellfish sourcing across multiple geographies, a wide processed and fresh product range, and strong foodservice distribution coverage |
|
Cape Cod Shellfish & Seafood Co., Inc. |
Cape Select Shellfish, and Maine Blue Mussels, among others |
Strong Challenger |
Regional shellfish species expertise, integrated wild harvest and aquaculture supply capability, and established East Coast distribution infrastructure |
|
Umios Food Europe B.V. |
Seacon |
Challenger |
European shellfish processing and distribution expertise, established coastal harvesting heritage, and cross-continental export and trade capabilities |
|
Pangea Shellfish & Seafood Company, Inc. |
Pangea |
Challenger |
Broad-based shellfish sourcing and supply network, multi-region distribution coverage, and specialty and premium shellfish procurement capabilities |
Seacore Seafood Inc. and PANAPESCA S.P.A. are among the largest integrated shellfish trading and distribution companies with global sourcing networks.
Key Company Profiles
Seacore Seafood Inc.
Seacore Seafood Inc. is a leading multi-species seafood company with particular expertise in procurement, processing, and North American distribution. Seacore operates as both a direct importer-distributor and a value-added processor of shellfish products for foodservice and retail markets.
- Product Portfolio: clam casino stuffed, clam cherrystone, clam geoduck, clam hokkigai, clam littleneck, clam manila, clam meat, clam New Zealand, clam pastaneck, clam razor, clam savoury, clam steamer, clam strips, clam tinyneck, clam topneck, and cockles New Zealand.
- Strategic Focus: Broadest shellfish portfolio breadth in North American distribution, sustainability certification leadership, Asian-sourced specialty shellfish supply development, and cold chain efficiency optimization for fresh live shellfish delivery.
PANAPESCA S.P.A.
PANAPESCA S.P.A. specializes in sourcing and distributing a broad range of clam, cockle, and shellfish products to foodservice, food manufacturing, and retail channels.
- Product Portfolio: Shelled Pacific Clams 250g, Pacific Clams Extra 1Kg, Pacific Clams with Shell 1kg, and Pacific Clams in Shell 500g.
- Recent Developments: In December 2025, PANAPESCA S.P.A. announced that it will participate in Marca 2026 in Bologna to showcase its private-label seafood solutions, including customizable packaging, dedicated product lines, and flexible formats for retailers.
- Strategic Focus: US foodservice and food manufacturing channel leadership, Latin American shellfish sourcing network development, IQF shellfish processing capability expansion, and sustainable certification program participation.
Market Concentration Analysis
The clams, cockles, ark shells market is highly fragmented at all stages of the value chain. At production, the market is characterized by thousands of individual wild harvesters and small-scale aquaculture operators with no single entity controlling more than 2–3% of global production.
At the distribution and processing level, specialist shellfish companies like Seacore Seafood Inc., PANAPESCA S.P.A., and Cape Cod Shellfish & Seafood Co., Inc. hold stronger regional positions but remain small relative to the overall market.
Investment & Growth Opportunities
Fastest Growing Segments
Frozen IQF shellfish (~2.90% CAGR), specialty ark shell products (~3.5% CAGR in non-Asian markets), MSC/ASC certified premium shellfish, and D2C e-commerce shellfish delivery are the highest-growth investment vectors through 2034, collectively representing a combined incremental market of approximately 0.8 Million Tons.
Emerging Market Expansion
Middle Eastern Gulf states represent a growing import opportunity as urbanization, rising incomes, and expanding hospitality sectors drive premium seafood demand. UAE, Saudi Arabia, and Qatar's luxury hotel and restaurant sectors are establishing regular import programs for premium European and North American shellfish, creating a premium export opportunity for certified shellfish producers.
Venture and Institutional Investment Trends
- Shellfish aquaculture investment funds, including BlueInvest (EU) and NOAA Aquaculture Opportunity Areas (US), are directing grants and concessional financing toward shellfish farm expansion, hatchery technology, and shellfish water quality improvement, supporting the supply base for commercial shellfish market growth.
- Corporate investment in shellfish processing technology, particularly IQF, sous-vide ready-to-heat, and high-pressure processing (HPP) for raw-safe premium shellfish products, is growing as processors seek to extend product shelf life and expand distribution geography beyond traditional cold chain constraints.
Future Market Outlook (2026-2034)
The global clams, cockles, ark shells market will reach 7.9 Million Tons by 2034 from 6.3 Million Tons in 2025, adding 1.6 Million Tons at a 2.40% CAGR. The growth trajectory will be supported by aquaculture expansion in Asia-Pacific and Europe, growing global consumer awareness of shellfish nutrition, and the development of new frozen and processed product formats that extend market reach beyond traditional consumption geographies.
Asia-Pacific will maintain market leadership through 2034, with China's Manila clam and ark shell aquaculture continuing to generate the largest absolute production volumes. Europe's premium shellfish market will grow in response to sustainability-certified product demand and growing Asian restaurant sector shellfish consumption in major European cities.
Research Methodology
Primary Research
Primary research comprised structured interviews with over 75 industry participants in 2024–2025, including shellfish producers, processors, distributors, foodservice buyers, and retail seafood buyers across Asia-Pacific, Europe, and North America. Expert input validated market sizing, species-specific trends, and packaging form adoption dynamics.
Secondary Research
Secondary research encompassed FAO fisheries and aquaculture statistics, national shellfish harvest authority data, MSC and ASC certification records, USDA shellfish import-export data, and trade publications including Seafood Source, IntraFish, and the Shellfish News.
Forecasting Models
Market volume estimations used bottom-up forecasting, incorporating aquaculture production data by species and country, wild fishery catch statistics, processing yield assumptions, import-export trade flows, and packaging form distribution modelling. A base-case CAGR of 2.40% reflects consensus validated against aquaculture expansion pipeline data and fishery management authority production targets.
Clams, Cockles, Ark Shells Market Report Coverage:
| Report Features | Details |
|---|---|
| Base Year of the Analysis | 2025 |
| Historical Period | 2020-2025 |
| Forecast Period | 2026-2034 |
| Units | Million USD, Million Tons |
| Scope of the Report |
Exploration of Historical Trends and Market Outlook, Industry Catalysts and Challenges, Segment-Wise Historical and Future Market Assessment:
|
| Type | Clams, Cockles, Ark Shells |
| Packaging Form | Fresh, Frozen, Canned, Others |
| End User |
|
| Region Covered | Asia Pacific, Europe, North America, Latin America, Middle East and Africa |
| Countries Covered | Spain, Italy, United Kingdom, Germany, France, Russia, Ireland, United States, Canada, Japan, South Korea, China, New Zealand, Thailand, India, Indonesia, Singapore, Vietnam, Brazil, Mexico, Turkey, Saudi Arabia, United Arab Emirates |
| Companies Covered | Seacore Seafood Inc, PANAPESCA S.P.A., Cape Cod Shellfish & Seafood Co., Inc., Umios Food Europe B.V., Pangea Shellfish & Seafood Company, Inc., etc. |
| Customization Scope | 10% Free Customization |
| Post-Sale Analyst Support | 10-12 Weeks |
| Delivery Format | PDF and Excel through Email (We can also provide the editable version of the report in PPT/Word format on special request) |
Frequently Asked Questions About the Clams, Cockles, Ark Shells Market Report
The market reached 6.3 Million Tons in 2025 and is projected to reach 7.9 Million Tons by 2034 at a 2.40% CAGR.
Asia-Pacific leads with a 36.8% share in 2025, anchored by China's massive Manila clam and ark shell aquaculture and South Korea's ark shell consumer culture.
Clams lead at 42.6% in 2025, driven by broad culinary versatility, China's large-scale Manila clam aquaculture, and established wild fishery supply across three major consuming regions.
Fresh packaging form leads at 38.9% in 2025, preferred by the premium restaurant and raw bar sector for live and fresh-chilled shellfish that command the highest per-kilogram prices.
Seacore Seafood Inc., PANAPESCA S.P.A., Cape Cod Shellfish & Seafood Co., Inc., Umios Food Europe B.V., and Pangea Shellfish & Seafood Company, Inc. are some of the leading players in the market.
Rising seafood demand and health awareness, shellfish aquaculture expansion, foodservice industry growth, and sustainable seafood certification demand are primary drivers.
Wild stock depletion, disease outbreaks, water quality risks, high cold chain logistics costs, and ocean acidification impacts on shellfish habitats are key challenges.
Frozen packaging is growing fastest at approximately 2.90% CAGR, driven by IQF technology enabling global trade in specialty shellfish species previously limited by fresh logistics constraints.
Need more help?
- Speak to our experienced analysts for insights on the current market scenarios.
- Include additional segments and countries to customize the report as per your requirement.
- Gain an unparalleled competitive advantage in your domain by understanding how to utilize the report and positively impacting your operations and revenue.
- For further assistance, please connect with our analysts.
 Request Customization
 Speak to an Analyst
 Request Brochure
 Inquire Before Buying
Benefits of Customization
- Personalize this research
- Triangulate with your data
- Get data as per your format and definition
- Gain a deeper dive into a specific application, geography, customer, or competitor
- Any level of personalization
Get in Touch With Us
UNITED STATES
Phone: +1-201-971-6302
INDIA
Phone: +91-120-433-0800
UNITED KINGDOM
Phone: +44-753-714-6104
Email: [email protected]
Client Testimonials


.webp)


