
Crude Oil Flow Improvers Market Size, Share, Trends and Forecast by Product, Application, and Region, 2026-2034
Crude Oil Flow Improvers Market Size and Share:
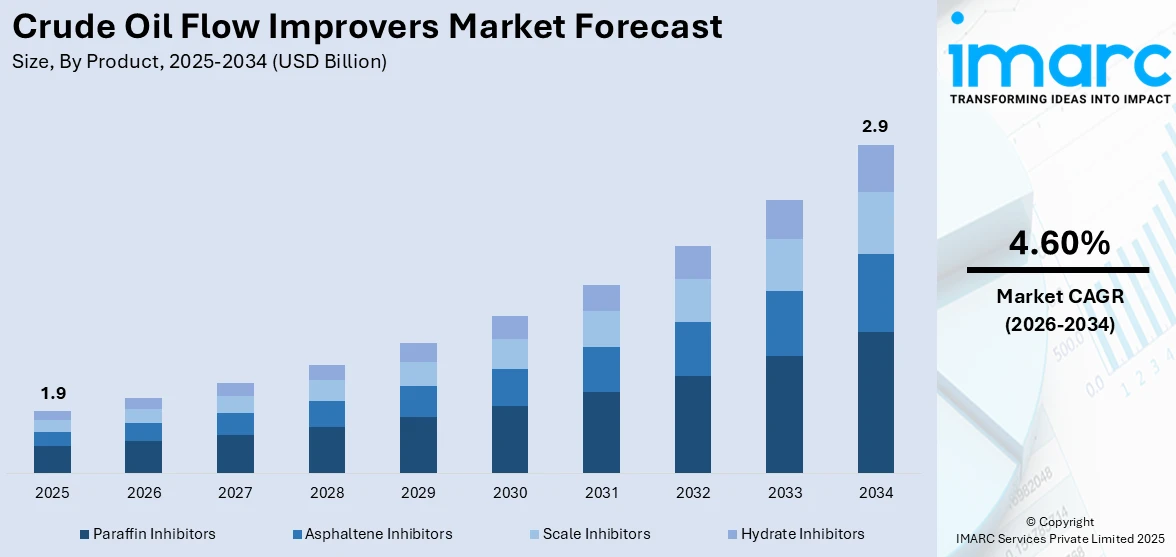
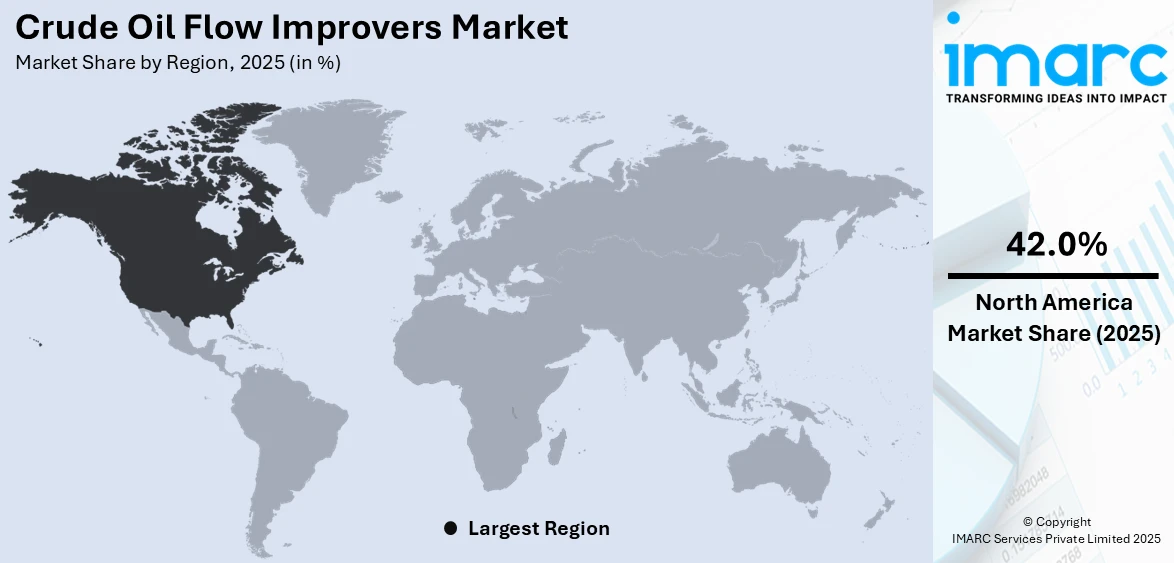
The global crude oil flow improvers market size was valued at USD 1.9 Billion in 2025. Looking forward, IMARC Group estimates the market to reach USD 2.9 Billion by 2034, exhibiting a CAGR of 4.60% during 2026-2034. North America currently dominates the market, holding a market share of over 42.0% in 2025. The rising oil production, ongoing innovations in flow improver technology, growing global energy demand, and expanding pipeline infrastructure, are primarily escalating the crude oil flow improvers market share.
|
Report Attribute
|
Key Statistics
|
|---|---|
|
Base Year
|
2025
|
|
Forecast Years
|
2026-2034
|
|
Historical Years
|
2020-2025
|
|
Market Size in 2025
|
USD 1.9 Billion |
|
Market Forecast in 2034
|
USD 2.9 Billion |
| Market Growth Rate (2026-2034) | 4.60% |
The demand for crude oil flow improvers (COFIs) is directly tied to global crude oil production and transportation. Oil fields, both onshore and offshore, are expanding as countries try to maximize energy security and meet rising energy demands. During October to December 2024, global oil demand saw a seasonal increase, growing by 1.5 million barrels per day, the strongest growth since the same period in 2023. This rise was 260,000 barrels per day higher than previously expected. For 2024, oil demand growth is projected at 940,000 barrels per day, with a slight acceleration to 1.05 million barrels per day in 2025 as the global economy improves a bit. However, transporting crude oil, especially through pipelines, comes with challenges. When oil flows through long-distance pipelines, it faces viscosity issues, paraffin buildup, and even freezing in cold climates. Without flow improvers, oil movement slows down, increasing operational costs and risking pipeline blockages.
To get more information on this market Request Sample
The United States stands as a major market disruptor with 83.70% market share in North America. Unconventional oil sources, like shale oil, oil sands, and ultra-heavy crude, are gaining prominence in the country due to the depletion of easy-to-extract conventional reserves. For instance, an estimated 1,778 trillion cubic feet (Tcf) of recoverable gas from shale and tight gas, and 76 Tcf from coalbed methane (CBM) were recovered in the country. While these sources are helping meet the oil demand, they present significant flow-related challenges. Shale oil, for instance, contains high wax content, making it highly susceptible to paraffin deposition at lower temperatures. Extracting and transporting these unconventional crude oils require specialized flow improvers to lower viscosity, prevent blockages, and optimize pumping efficiency.
Crude Oil Flow Improvers Market Trends:
Rising Energy Demand
The overall increase in global energy demand drives the need for efficient crude oil production and transportation. For example, as reported by the Energy Institute in an article, in 2023, primary energy consumption around the world grew by 2% to 620 EJ, making it the second year in a row. Its growth rate was 0.6% higher than its 10-year average. As energy consumption rises, the oil and gas industry seek to improve operational efficiency, including the use of effective flow improvers, thereby boosting the crude oil flow improvers market share.
Increased Production of Non-Conventional Oils
The growing production of non-conventional oils, including shale oil, oil sands, and heavy oils, increases the need for flow improvers to address their high viscosity and complex flow properties. Goldman Sachs projects that U.S. lower 48 shale oil output will rise by 600,000 bpd in 2025, about 50% higher than in 2024, due to improved well productivity. The U.S. Energy Information Administration (EIA) reports that in 2023, tight-oil resources contributed approximately 3.04 billion barrels (8.32 million bpd), making up 64% of total U.S. crude production. These trends are expected to drive demand for crude oil flow improvers.
Expansion of Pipeline Infrastructure
The development and expansion of pipeline networks are crucial for transporting crude oil efficiently. For instance, according to an industry report, in October 2023, there were nearly 806 functioning oil pipelines globally. At that time, there were 25 oil pipelines under construction. New pipelines and upgrades to existing ones often require flow improvers to ensure smooth and efficient oil transport, particularly in regions with extreme temperatures or varying crude oil compositions. These factors are further positively influencing the crude oil flow improvers market forecast.
Crude Oil Flow Improvers Industry Segmentation:
IMARC Group provides an analysis of the key trends in each segment of the global crude oil flow improvers market, along with forecast at the global, regional, and country levels from 2026-2034. The market has been categorized based on product and application.
Analysis by Product:
- Paraffin Inhibitors
- Asphaltene Inhibitors
- Scale Inhibitors
- Hydrate Inhibitors
According to the crude oil flow improvers market outlook, paraffin inhibitors represent the largest market share of 30.5%. They are designed to prevent the formation and deposition of paraffin wax in crude oil. Wax formation can occur when crude oil cools, leading to blockages and flow restrictions in pipelines and processing equipment. The rise in the production of heavy oils, bitumen, and other high-wax crudes, particularly from oil sands and shale deposits, drives the need for effective paraffin inhibitors. These types of crude oils typically have higher wax content, leading to more significant challenges with wax deposition.
Analysis by Application:
Access the comprehensive market breakdown Request Sample
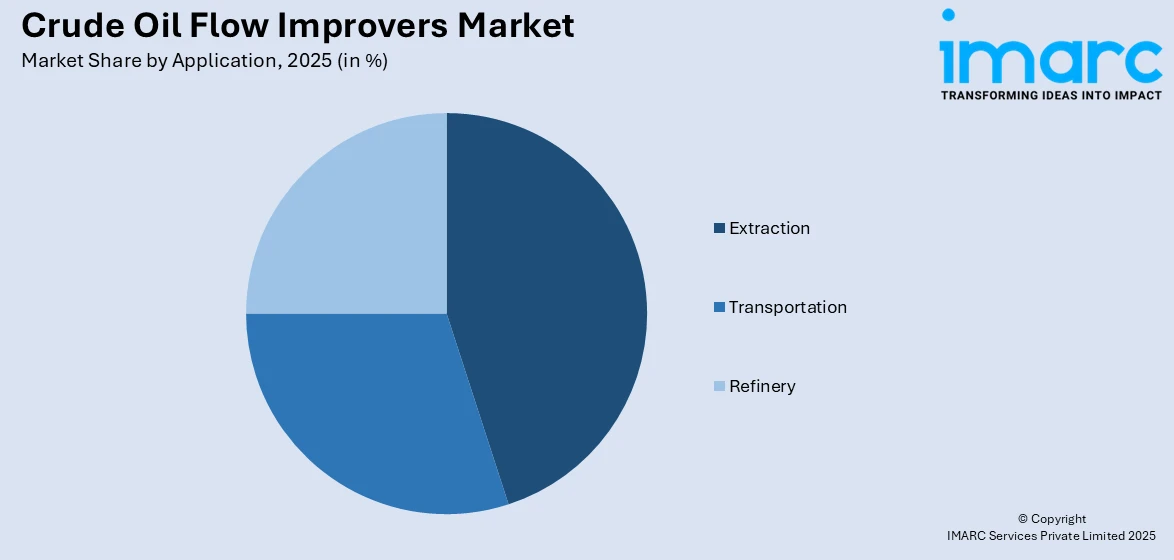
- Extraction
- Transportation
- Refinery
According to the crude oil flow improvers market trends, extraction leads the market share with 43.8%. In the extraction phase of crude oil production, flow improvers are essential for optimizing the process and ensuring that oil can be effectively transported from the wellhead to processing facilities. Crude oil with high viscosity or wax content can be challenging to pump. In this regard, COFIs help to reduce the viscosity and prevent the formation of waxy deposits, making it easier to extract the oil.
Regional Analysis:
To get more information on the regional analysis of this market Request Sample
- North America
- United States
- Canada
- Europe
- Germany
- France
- United Kingdom
- Italy
- Spain
- Russia
- Others
- Asia Pacific
- China
- Japan
- India
- South Korea
- Australia
- Indonesia
- Others
- Latin America
- Brazil
- Mexico
- Others
- Middle East and Africa
North America represents the largest market share with 42.0%. The surge in oil production, particularly from unconventional sources, such as shale oil in the U.S. and oil sands in Canada, necessitates the use of flow improvers to handle the more challenging properties of these oils. Moreover, the development and expansion of pipeline networks to transport crude oil efficiently requires the use of flow improvers to maintain optimal flow rates and reduce operational costs. Apart from this, continuous innovations in flow improver formulations and technologies, including more effective chemicals and application techniques, are driving market growth by offering enhanced performance and cost efficiency.
Key Regional Takeaways:
United States Crude Oil Flow Improvers Market Analysis
The U.S. crude oil market is still the leading region in North America with 83.70%, because of the healthy growth of production and exports. The U.S. Energy Information Administration (EIA) states that in 2023, the U.S. produced about 12.9 million barrels per day (bpd) of crude oil, which places it as the world's largest producer. Exports also stood at a record 4.1 million bpd. The shale revolution remains the driving force behind this production, particularly the Permian Basin. Government policies on energy security and investment in infrastructure like pipe expansion and refinery upgradation certainly boost the markets. The top companies such as ExxonMobil and Chevron are targeting technologically advanced extraction to improve extraction efficiency. On the other hand, geographically, the U.S. will enjoy a diversified energy mix by balancing the traditional crude oil with high investment in renewable energy. Market volatility obviously remains an issue affected by demand change worldwide and the play of politics across the world. Domestic production resilience places the United States as one of the core suppliers in world crude oil supply.
Europe Crude Oil Flow Improvers Market Analysis
Europe's crude oil flow improvers market growth is influenced by the diversification of energy sources and geopolitical rivalry. Eurostat shows that in 2023, the EU imported about 3.2 million bpd of crude oil. This figure significantly dropped as a result of the transition towards energy sources and reduced dependency on Russian oil. Germany, France, and the Netherlands have also been spending in alternative sources of energy that are reducing demand for crude oil. However, the refining sector is strong with key players like Shell and BP optimizing their operations. The European oil market also faces regulatory pressures, as stricter environmental policies push companies toward cleaner energy solutions. The other major non-EU oil producer is Norway, which has remained a significant supplier, producing around 2 million bpd in 2023, as per reports. Green energy and increased strategic oil reserve dependency are influencing the crude oil market in Europe, and concerns over energy security continue to guide policy decisions.
Asia Pacific Crude Oil Flow Improvers Market Analysis
Asia Pacific is still the most important crude oil consumer with rapid industrialization and population growth. China, according to National Bureau of Statistics, imported around 11.3 million bpd of crude oil in 2023, thereby remaining the largest importer in the world. Indian demand also showed a significant surge; oil imports are around 4.8 million bpd, the Ministry of Petroleum and Natural Gas informed. Regional refineries have been broadening their expansions into complex refining capacities to accommodate varied crude grades. PetroChina, Sinopec, and Indian Oil Corporation take the lead in engaging with government initiatives for securing energy supply in the market, despite the high demand due to the evolving energy transition policies and rising renewable energy consumption. Geopolitical risks include tensions in the South China Sea, and so diversification remains a major strategy for the key consumers.
Latin America Crude Oil Flow Improvers Market Analysis
Major producers of crude oil in Latin America include Brazil, Mexico, and Venezuela. Petrobras reported that Brazil produced around 3.3 million bpd of crude oil in 2023, as deepwater exploration in the pre-salt fields was favorable. Mexico's oil production, led by Pemex, averaged around 1.6 million bpd, as the government focused on revitalizing its energy sector. Venezuela had some of the world's largest crude reserves despite economic hardships. Production oscillated around 800,000 bpd according to OPEC reports. Infrastructure investment and refining capacity pose significant challenges in maximising export capabilities. Political instability, most pronounced in Venezuela, influences market conditions, and regulatory reforms undertaken in Brazil and Mexico intend to promote foreign investments. Renewable energy in the region is slowly shifting the focus away from crude oil, but demand for petroleum products remains stable.
Middle East and Africa Crude Oil Flow Improvers Market Analysis
The Middle East and Africa continue to be the world's main source of crude oil, based on enormous reserves and strategic production policies. According to OPEC, Saudi Arabia maintained an average crude oil production of around 9.0 million bpd in 2023, adjusting output in line with OPEC+ agreements to stabilize global markets. The UAE, another key producer, produced around 3.8 million bpd, investing in capacity expansion through ADNOC's strategic initiatives. Nigeria and Angola lead oil production in Africa. Nigeria has produced around 1.4 million bpd, according to the Nigerian National Petroleum Corporation. However, this is not a stable production source due to security threats, old infrastructure, and regulatory uncertainties. The Middle East continues to dictate global oil prices, and even issues like the Israeli-Palestinian conflict and Iranian oil export policies have a strong influence on the dynamics of supply. Even with increasing investments into renewable energy sources, crude oil still undergird the economies of many nations in this region.
Competitive Landscape:
In the crude oil flow improvers market, innovation and strategic expansion are being followed by leading companies to meet the changing needs of the oil and gas industry. They are focusing on developing advanced additives to improve the efficiency of crude oil extraction, transportation, and refining. These efforts improve flow characteristics, reduce energy consumption, and minimize environmental impact. Companies are strengthening their global presence through strategic partnerships and acquisitions to better serve key markets and meet regional demand. In this light, the alignment of their products with the direction of the industry towards unconventional sources of oil and the requirement of cost-effective operation puts them in a good position to benefit from the increasing demand for effective flow assurance solutions.
The report provides a comprehensive analysis of the competitive landscape in the crude oil flow improvers market with detailed profiles of all major companies, including:
- Baker Hughes Company
- BASF SE
- Berkshire Hathaway Inc.
- Clariant AG
- Dorf Ketal Chemicals Pvt. Ltd.
- Ecolab Inc.
- Evonik Industries AG (RAG-Stiftung)
- Halliburton Company
- Infineum International Limited
- Schlumberger Limited
- Thermax Limited
(Please note that this is only a partial list of the key players, and the complete list is provided in the report.)
Latest News and Developments:
- May 2024: BASF, one of the largest producers of crude oil flow improvers, announced its intentions to increase the production capacity of its Basoflux range of paraffin inhibitors at its Tarragona, Spain site.
- May 2024: The Nigerian National Petroleum Company Limited (NNPCL), Energy Services Limited (EnServ), and Schlumberger (SLB) signed a technical collaboration agreement to enhance upstream operations.
Crude Oil Flow Improvers Market Report Scope:
| Report Features | Details |
|---|---|
| Base Year of the Analysis | 2025 |
| Historical Period | 2020-2025 |
| Forecast Period | 2026-2034 |
| Units | Billion USD |
| Scope of the Report |
Exploration of Historical Trends and Market Outlook, Industry Catalysts and Challenges, Segment-Wise Historical and Future Market Assessment:
|
| Products Covered | Paraffin Inhibitors, Asphaltene Inhibitors, Scale Inhibitors, Hydrate Inhibitors |
| Applications Covered | Extraction, Transportation, Refinery |
| Regions Covered | Asia Pacific, Europe, North America, Latin America, Middle East and Africa |
| Countries Covered | United States, Canada, Germany, France, United Kingdom, Italy, Spain, Russia, China, Japan, India, South Korea, Australia, Indonesia, Brazil, Mexico |
| Companies Covered | Baker Hughes Company, BASF SE, Berkshire Hathaway Inc., Clariant AG, Dorf Ketal Chemicals Pvt. Ltd., Ecolab Inc., Evonik Industries AG (RAG-Stiftung), Halliburton Company, Infineum International Limited, Schlumberger Limited, Thermax Limited, etc. |
| Customization Scope | 10% Free Customization |
| Post-Sale Analyst Support | 10-12 Weeks |
| Delivery Format | PDF and Excel through Email (We can also provide the editable version of the report in PPT/Word format on special request) |
Key Benefits for Stakeholders:
- IMARC’s report offers a comprehensive quantitative analysis of various market segments, historical and current market trends, market forecasts, and dynamics of the crude oil flow improvers market from 2020-2034.
- The research study provides the latest information on the market drivers, challenges, and opportunities in the global crude oil flow improvers market.
- The study maps the leading, as well as the fastest-growing, regional markets. It further enables stakeholders to identify the key country-level markets within each region.
- Porter's Five Forces analysis assists stakeholders in assessing the impact of new entrants, competitive rivalry, supplier power, buyer power, and the threat of substitution. It helps stakeholders to analyze the level of competition within the crude oil flow improvers industry and its attractiveness.
- Competitive landscape allows stakeholders to understand their competitive environment and provides an insight into the current positions of key players in the market.
Frequently Asked Questions About the Crude Oil Flow Improvers Market Report
The crude oil flow improvers market was valued at USD 1.9 Billion in 2025.
IMARC Group estimates the market to reach USD 2.9 Billion by 2034, exhibiting a CAGR of 4.60% during 2026-2034.
Rising crude oil production, increasing reliance on unconventional oil sources, expanding pipeline infrastructure, harsh environmental conditions, cost optimization needs, stringent environmental regulations, and growing offshore exploration are driving the demand for crude oil flow improvers.
North America currently dominates the market, due to high shale oil production, extensive pipeline networks, and advanced extraction technologies.
Some of the major players in the crude oil flow improvers market include Baker Hughes Company, BASF SE, Berkshire Hathaway Inc., Clariant AG, Dorf Ketal Chemicals Pvt. Ltd., Ecolab Inc., Evonik Industries AG (RAG-Stiftung), Halliburton Company, Infineum International Limited, Schlumberger Limited, Thermax Limited, etc.
Need more help?
- Speak to our experienced analysts for insights on the current market scenarios.
- Include additional segments and countries to customize the report as per your requirement.
- Gain an unparalleled competitive advantage in your domain by understanding how to utilize the report and positively impacting your operations and revenue.
- For further assistance, please connect with our analysts.
 Request Customization
 Speak to an Analyst
 Request Brochure
 Inquire Before Buying
Benefits of Customization
- Personalize this research
- Triangulate with your data
- Get data as per your format and definition
- Gain a deeper dive into a specific application, geography, customer, or competitor
- Any level of personalization
Get in Touch With Us
UNITED STATES
Phone: +1-201-971-6302
INDIA
Phone: +91-120-433-0800
UNITED KINGDOM
Phone: +44-753-714-6104
Email: [email protected]
Client Testimonials


.webp)


