
Data Visualization Market Report by Component (Software, Services), Organizational Department (Sales, Marketing, Finance, Operations, Executive Management, and Others), Deployment Mode (On-premises, Cloud-based), Enterprise Size (Small Enterprises, Medium Enterprises, Large Enterprises), End User (BFSI, Education, IT and Telecommunication, Retail and E-Commerce, Manufacturing, Government, and Others), and Region 2026-2034
Data Visualization Market Size:
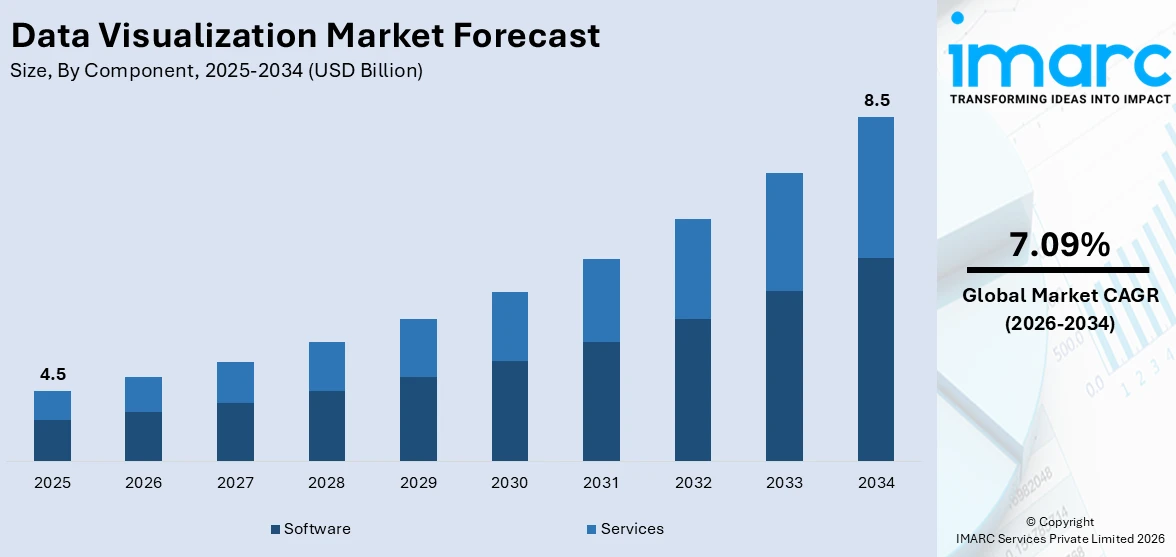
The global data visualization market size reached USD 4.5 Billion in 2025. Looking forward, IMARC Group expects the market to reach USD 8.5 Billion by 2034, exhibiting a growth rate (CAGR) of 7.09% during 2026-2034. The increasing volume of data, the growing demand for real-time analytics, the need for better decision-making tools, advancements in AI and machine learning, and rising user-friendly tools and cloud-based solutions are some of the major factors propelling the market growth.
|
Report Attribute
|
Key Statistics
|
|---|---|
|
Base Year
|
2025
|
|
Forecast Years
|
2026-2034
|
|
Historical Years
|
2020-2025
|
|
Market Size in 2025
|
USD 4.5 Billion |
|
Market Forecast in 2034
|
USD 8.5 Billion |
| Market Growth Rate 2026-2034 | 7.09% |
Data Visualization Market Analysis:
- Major Market Drivers: The growing need for data-driven decision-making represents the major driver of the market. As organizations accumulate vast amounts of data, tools that simplify data interpretation are essential for identifying trends and deriving actionable insights. In line with this, the integration of business intelligence (BI) tools like Tableau and Power BI enables businesses to visualize complex datasets efficiently, accelerating decision-making.
- Key Market Trends: The increasing use of augmented analytics and AI-driven data visualization tools represents the key trends in the market. These technologies allow for deeper insights by automating data analysis and recommending the best visual formats for presenting findings. Another significant trend is the shift toward self-service analytics, where non-technical users can create their visual reports.
- Geographical Trends: North America accounts for the largest region in the market across the globe. The widespread adoption of advanced analytics, the presence of leading tech companies, and a growing emphasis on data-driven decision-making across industries are accelerating the data visualization market growth rate across the region. The rise of big data, AI, and cloud-based BI tools, combined with increased investments in digital transformation, further drive the market growth in the region.
- Competitive Landscape: Some of the major market players in the data visualization industry include Alteryx Inc., Domo Inc., Dundas Data Visualization Inc., Hitachi Ltd., InetSoft Technology Corp., International Business Machines Corporation, Microsoft Corporation, MicroStrategy Incorporated, Oracle Corporation, Salesforce.com Inc., SAP SE, SAS Institute Inc., TIBCO Software Inc., among many others.
- Challenges and Opportunities: The market faces various challenges including data security concerns, as organizations must protect sensitive information while sharing visual insights. However, the market also boasts several opportunities such as the growing demand for real-time analytics and user-friendly visualization tools. As businesses increasingly recognize the value of data-driven decision-making, there is a significant market potential for innovative visualization solutions that simplify data interpretation and enhance storytelling capabilities, enabling organizations to derive actionable insights from complex datasets.
To get more information on this market Request Sample
Data Visualization Market Trends:
Growing Demand for Data-Driven Decision Making
As businesses become more data-centric, there is a rising need for tools that simplify and present complex data in visual formats. For instance, in March 2024, Domo announced at Domopalooza: the AI + Data Conference that App Studio, Domo’s low-code app builder, is now generally available. The company also announced that it has bolstered its low-code automation engine Workflows, streamlining, and extending automation with third-party actions. Similarly, in June 2024, Homegrown geospatial software provider MapmyIndia launched ClarityX company, which is focused on providing enterprise clients with customer-centric artificial intelligence (AI)-driven data analytics and consulting. ClarityX will help expand MapmyIndia's enterprise offerings and addressable market, by empowering enterprises with AI-driven insights from multi-dimensional static and real-time data, enabling immediate strategic decision-making and driving digital transformation. According to the data visualization market forecast, this will enable quick decision-making and enhance strategic insights, thus making data visualization tools critical for interpreting big data.
Increasing Adoption of Business Intelligence (BI) Tools
The integration of data visualization with BI platforms has drastically increased in the recent years, thereby allowing companies to analyze and present data more effectively. Tools like Tableau, Power BI, and Google Data Studio help businesses transform raw data into actionable insights. For instance, in September 2024, Tableau launched its AI visual analytics platform, Tableau Einstein, to help scale and enhance data-driven workflows. Tableau Einstein allows data experts and analysts to create semantic models based on real-time customer data. Tableau’s integrated marketplace and APIs further facilitate internal collaboration by enabling different team members to work across different data assets, such as sources, models, visualizations, and dashboards, in a streamlined drag-and-drop workspace.
Expansion of Big Data and Artificial Intelligence (AI)
With the growth of big data and AI, organizations are collecting vast amounts of structured and unstructured data. The need to process, analyze, and visualize this data in a clear, comprehensible format is boosting the demand for data visualization tools across industries such as finance, healthcare, retail, and IT, which is further creating a positive data visualization market outlook. For instance, in June 2024, Databricks launched AI/BI, the AI-first visualization tool for performing intelligent analytics using real-world data native to individual data platform. This AI Graphics tool is launched with the aim to redefine the standards for how businesses interact with their data. Databricks’ latest offering combines the power of artificial intelligence graphics with business intelligence (BI) to create eye-catching and incredibly insightful visualizations. AI/BI can independently analyze complex data through natural language queries by capturing signals from unique data and business concepts.
Data Visualization Market Segmentation:
IMARC Group provides an analysis of the key trends in each segment of the market, along with forecasts at the global, regional, and country levels for 2026-2034. Our report has categorized the market based on component, organizational department, deployment mode, enterprise size, and end user.
Breakup by Component:
- Software
- Services
Software accounts for the majority of the market share
The report has provided a detailed breakup and analysis of the market based on the component. This includes software and services. According to the report, software represented the largest segment.
Software is the predominant segment in the market due to its scalability, ease of integration, and ability to process large datasets efficiently. Advanced data visualization software, such as Tableau and Microsoft Power BI, provides powerful tools for creating interactive dashboards, charts, and graphs. These solutions enable businesses to visualize complex data in real-time, making insights more accessible. Additionally, the flexibility of cloud-based and on-premise software solutions allows organizations to customize their analytics, driving the expansion of the software segment.
Breakup by Organizational Department:
- Sales
- Marketing
- Finance
- Operations
- Executive Management
- Others
Sales holds the largest share of the industry
A detailed breakup and analysis of the market based on the organizational department have also been provided in the report. This includes sales, marketing, finance, operations, executive management, and others. According to the report, sales accounted for the largest market share.
The sales segment dominates the market because sales teams need real-time insights to track performance, forecast revenues, and refine strategies. Data visualization tools simplify complex sales metrics, allowing teams to monitor customer behavior, sales funnels, and market trends more efficiently. By enabling quicker decision-making and better targeting, these tools enhance sales effectiveness, drive revenue growth, and improve customer relationship management. The critical role of data in optimizing sales operations makes this department a key user of visualization solutions.
Breakup by Deployment Mode:
- On-premises
- Cloud-based
On-premises represents the leading market segment
The report has provided a detailed breakup and analysis of the market based on the deployment mode. This includes on-premises and cloud-based. According to the report, on-premises represented the largest segment.
The on-premises deployment mode segment dominates the market due to the demand for greater control over data security, especially in sectors like finance, healthcare, and government. Organizations prefer on-premises solutions to ensure compliance with stringent regulations and protect sensitive information. This deployment mode also offers higher customization, performance optimization, and integration with existing IT infrastructure. For companies handling large volumes of confidential data, on-premises deployment provides the reliability and security needed for advanced data visualization and analytics.
Breakup by Enterprise Size:
- Small Enterprises
- Medium Enterprises
- Large Enterprises
Large enterprises exhibit a clear dominance in the market
A detailed breakup and analysis of the market based on the enterprise size have also been provided in the report. This includes small enterprises, medium enterprises, and large enterprises. According to the report, large enterprises accounted for the largest market share.
The large enterprises segment dominates the market due to their vast data generation and the need for sophisticated analytics tools to manage and interpret it. Large organizations require advanced visualization solutions to make data-driven decisions, optimize operations, and maintain a competitive edge. Additionally, they have the resources to invest in high-end tools, customization, and on-premises infrastructure. These companies also focus on enhancing business intelligence and strategic planning, making data visualization critical for processing and utilizing massive, complex datasets efficiently.
Breakup by End User:
Access the comprehensive market breakdown Request Sample
- BFSI
- Education
- IT and Telecommunication
- Retail and E-Commerce
- Manufacturing
- Government
- Others
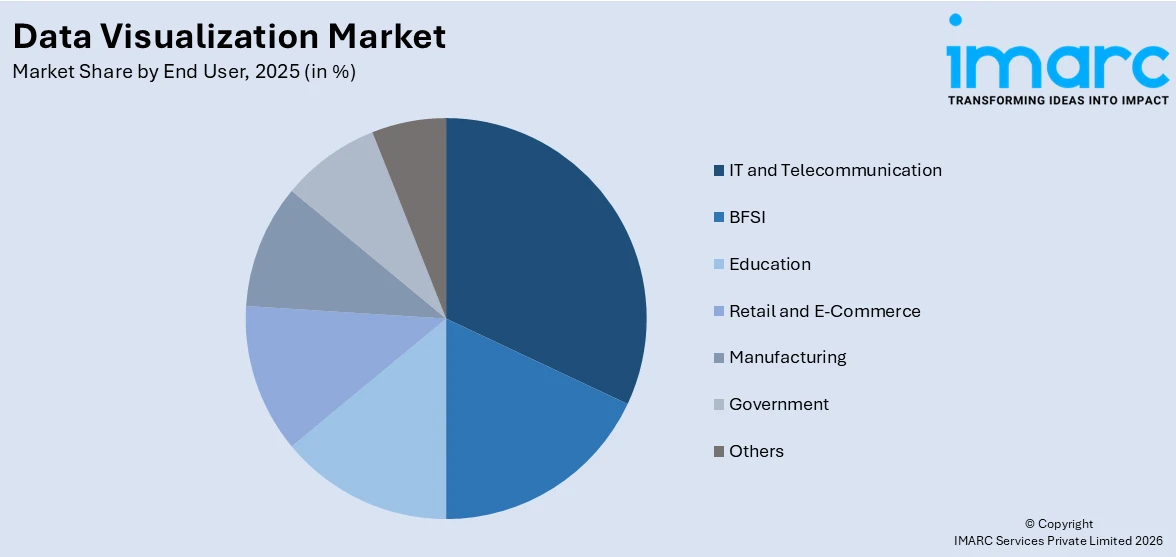
IT and telecommunication dominates the market
The report has provided a detailed breakup and analysis of the market based on the end user. This includes BFSI, education, IT and telecommunication, retail and e-commerce, manufacturing, government, and others. According to the report, IT and telecommunication represented the largest segment.
The IT and telecommunications segment dominates the market due to the sector's need to manage and analyze large volumes of data from network operations, customer interactions, and service performance. Data visualization tools help these organizations monitor system performance, optimize network management, and improve customer experience. The rapid technological advancements and high data velocity in IT and telecommunications drive the demand for sophisticated visualization solutions, making them essential for real-time analysis, troubleshooting, and strategic decision-making.
Breakup by Region:
- North America
- United States
- Canada
- Asia-Pacific
- China
- Japan
- India
- South Korea
- Australia
- Indonesia
- Others
- Europe
- Germany
- France
- United Kingdom
- Italy
- Spain
- Russia
- Others
- Latin America
- Brazil
- Mexico
- Others
- Middle East and Africa
North America leads the market, accounting for the largest data visualization market share
The report has also provided a comprehensive analysis of all the major regional markets, which include North America (the United States and Canada); Europe (Germany, France, the United Kingdom, Italy, Spain, Russia, and others); Asia Pacific (China, Japan, India, South Korea, Australia, Indonesia, and others); Latin America (Brazil, Mexico, and others); and the Middle East and Africa. According to the report, North America represents the largest regional market for data visualization.
The rapid growth of big data and advanced analytics creates a need for sophisticated tools to interpret and present complex information effectively, which is driving the market growth across the region. The presence of leading technology companies and a high level of investment in digital transformation further fuels this demand. Additionally, the emphasis on data-driven decision-making across industries, including finance, healthcare, and retail, drives the adoption of data visualization solutions. The shift toward cloud-based platforms and real-time data analytics also contributes to the market growth, providing more accessible and scalable visualization options. For instance, in October 2023, IBM introduced the new IBM Storage Scale System 6000, a cloud-scale global data platform designed to meet today's data-intensive and AI workload demands, and the latest offering in the IBM Storage for Data and AI portfolio.
Competitive Landscape:
- The data visualization market research report has also provided a comprehensive analysis of the competitive landscape in the market. Detailed profiles of all major companies have also been provided. Some of the major market players in the data visualization industry include Alteryx Inc., Domo Inc., Dundas Data Visualization Inc., Hitachi Ltd., InetSoft Technology Corp., International Business Machines Corporation, Microsoft Corporation, MicroStrategy Incorporated, Oracle Corporation, Salesforce.com Inc., SAP SE, SAS Institute Inc., TIBCO Software Inc.
(Please note that this is only a partial list of the key players, and the complete list is provided in the report.)
- The market is highly competitive, featuring major players like Microsoft, IBM, and Salesforce, who offer robust platforms with advanced analytics and integration capabilities. Companies such as Tableau and Power BI lead with user-friendly, customizable solutions. Emerging players like Domo and Alteryx focus on innovative features and real-time data insights. The market also includes niche providers like Dundas and InetSoft, which cater to specific needs. Continuous technological advancements and growing demand for data-driven insights drive intense competition. For instance, in January 2024, Infogram announced their collaboration with WoodWing by integrating their data visualization tool directly into WoodWing Studio, a solution for multi-channel content creation and publishing workflows. This collaboration will enhance the content creation process for WoodWing Studio users, providing them with a wide range of possibilities to enrich their digital articles.
Data Visualization Market News:
- In May 2023, Blattner Tech, a leading provider of innovative solutions in the predictive transformation industry, announced a strategic partnership with Juice Analytics, a key player in the field of data visualization, to offer enhanced data visualization capabilities to its customers. This collaboration aims to empower businesses with advanced tools and insights to leverage their data effectively.
- In May 2024, Tableau and Databricks announced the expansion of their partnership to enhance data sharing, connection, and visualization. As a part of this endeavor, Databricks highlighted the benefits of Tableau Delta Sharing and Explore in Tableau, which enable customers to handle data more securely and seamlessly.
Data Visualization Market Report Scope:
| Report Features | Details |
|---|---|
| Base Year of the Analysis | 2025 |
| Historical Period | 2020-2025 |
| Forecast Period | 2026-2034 |
| Units | Billion USD |
| Scope of the Report | Exploration of Historical Trends and Market Outlook, Industry Catalysts and Challenges, Segment-Wise Historical and Future Market Assessment:
|
| Components Covered | Software, Services |
| Organizational Departments Covered | Sales, Marketing, Finance, Operations, Executive Management, Others |
| Deployment Modes Covered | On-premises, Cloud-based |
| Enterprise Sizes Covered | Small Enterprises, Medium Enterprises, Large Enterprises |
| End Users Covered | BFSI, Education, IT and Telecommunication, Retail and E-Commerce, Manufacturing, Government, Others |
| Regions Covered | Asia Pacific, Europe, North America, Latin America, Middle East and Africa |
| Countries Covered | United States, Canada, Germany, France, United Kingdom, Italy, Spain, Russia, China, Japan, India, South Korea, Australia, Indonesia, Brazil, Mexico |
| Companies Covered | Alteryx Inc., Domo Inc., Dundas Data Visualization Inc., Hitachi Ltd., InetSoft Technology Corp., International Business Machines Corporation, Microsoft Corporation, MicroStrategy Incorporated, Oracle Corporation, Salesforce.com Inc., SAP SE, SAS Institute Inc., TIBCO Software Inc., etc. |
| Customization Scope | 10% Free Customization |
| Post-Sale Analyst Support | 10-12 Weeks |
| Delivery Format | PDF and Excel through Email (We can also provide the editable version of the report in PPT/Word format on special request) |
Key Benefits for Stakeholders:
- IMARC’s industry report offers a comprehensive quantitative analysis of various market segments, historical and current market trends, market forecasts, and dynamics of the data visualization market from 2020-2034.
- The research report provides the latest information on the market drivers, challenges, and opportunities in the global data visualization market.
- The study maps the leading, as well as the fastest-growing, regional markets. It further enables stakeholders to identify the key country-level markets within each region.
- Porter's five forces analysis assists stakeholders in assessing the impact of new entrants, competitive rivalry, supplier power, buyer power, and the threat of substitution. It helps stakeholders to analyze the level of competition within the data visualization industry and its attractiveness.
- The competitive landscape allows stakeholders to understand their competitive environment and provides insight into the current positions of key players in the market.
Frequently Asked Questions About the Data Visualization Market Report
The global data visualization market was valued at USD 4.5 Billion in 2025.
We expect the global data visualization market to exhibit a CAGR of 7.09% during 2026-2034.
The growing popularity of data visualization platforms for processing healthcare data and monitoring financial trends to extract meaningful insights for improved decision making via graphical and simplified projection of data, is primarily driving the global data visualization market.
The sudden outbreak of the COVID-19 pandemic has led to the rising adoption of data visualization tools across numerous sectors, to remotely identify customer preferences and maintain the demand and supply of existing and new products.
Based on the component, the global data visualization market can be segmented into software and services. Currently, software accounts for the majority of the global market share.
Based on the organizational department, the global data visualization market has been divided into sales, marketing, finance, operations, executive management, and others. Among these, sales department exhibits a clear dominance in the market.
Based on the deployment mode, the global data visualization market can be categorized into on- premises and cloud-based. Currently, on-premises mode holds the majority of the total market share.
Based on the enterprise size, the global data visualization market has been segmented into small enterprises, medium enterprises, and large enterprises. Among these, large enterprises represent the largest market share.
Based on the end user, the global data visualization market can be bifurcated into BFSI, education, IT and telecommunication, retail and e-commerce, manufacturing, government, and others. Currently, the IT and telecom sector accounts for the majority of the total market share.
On a regional level, the market has been classified into North America, Europe, Asia-Pacific, Middle East and Africa, and Latin America, where North America currently dominates the global market.
Some of the major players in the global data visualization market include Alteryx Inc., Domo Inc., Dundas Data Visualization Inc., Hitachi Ltd., InetSoft Technology Corp., International Business Machines Corporation, Microsoft Corporation, MicroStrategy Incorporated, Oracle Corporation, Salesforce.com Inc., SAP SE, SAS Institute Inc., and TIBCO Software Inc.
Need more help?
- Speak to our experienced analysts for insights on the current market scenarios.
- Include additional segments and countries to customize the report as per your requirement.
- Gain an unparalleled competitive advantage in your domain by understanding how to utilize the report and positively impacting your operations and revenue.
- For further assistance, please connect with our analysts.
 Request Customization
 Speak to an Analyst
 Request Brochure
 Inquire Before Buying
Benefits of Customization
- Personalize this research
- Triangulate with your data
- Get data as per your format and definition
- Gain a deeper dive into a specific application, geography, customer, or competitor
- Any level of personalization
Get in Touch With Us
UNITED STATES
Phone: +1-201-971-6302
INDIA
Phone: +91-120-433-0800
UNITED KINGDOM
Phone: +44-753-714-6104
Email: [email protected]
Client Testimonials


.webp)


