
Directed Energy Weapons Market Size, Share, Trends and Forecast by Type, Application, Technology, End Use, and Region, 2026-2034
Global Directed Energy Weapons Market Size, Share, Trends & Forecast (2026-2034)
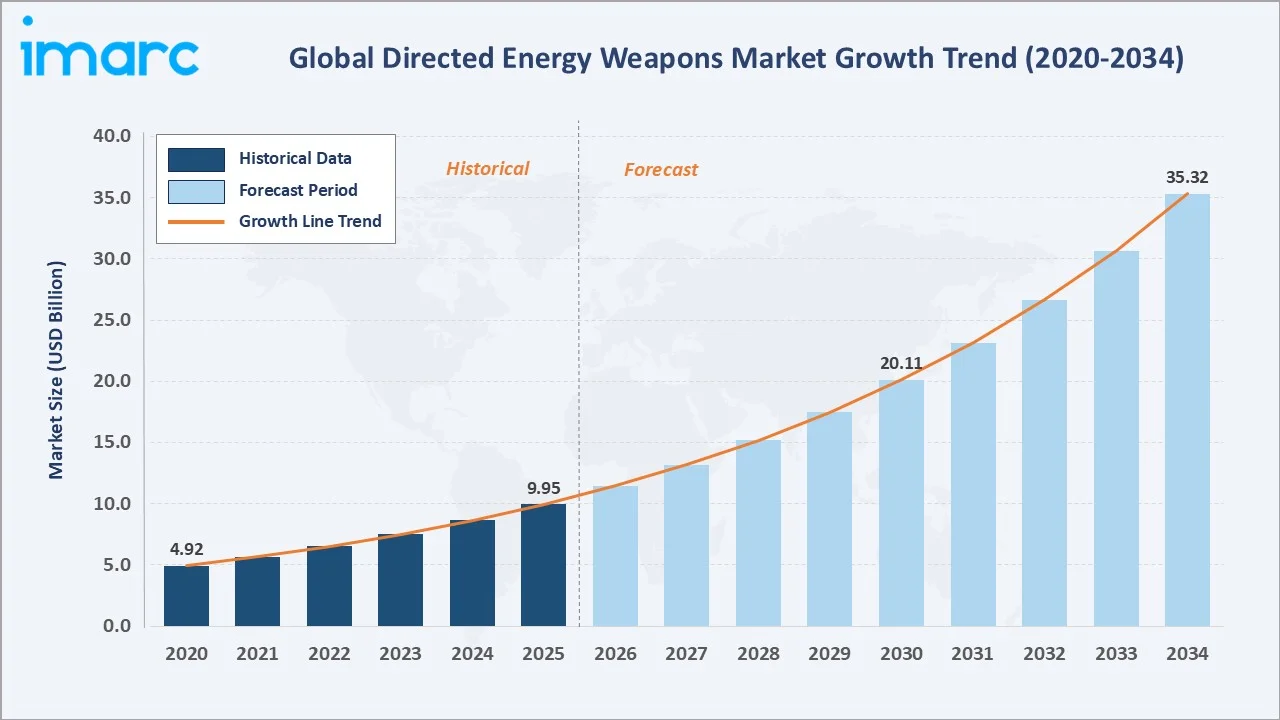
The global directed energy weapons market size was valued at USD 9.95 Billion in 2025 and is projected to reach USD 35.32 Billion by 2034, exhibiting a CAGR of 15.11% during the forecast period 2026-2034. Escalating global defense budgets, rapid proliferation of unmanned aerial systems (UAS), and the urgent need for precision-strike capabilities with minimal collateral damage are the primary drivers of directed energy weapons market growth.
Market Snapshot
|
Metric |
Value |
|
Market Size (2025) |
USD 9.95 Billion |
|
Forecast Market Size (2034) |
USD 35.32 Billion |
|
CAGR (2026-2034) |
15.11% |
|
Base Year |
2025 |
|
Historical Period |
2020-2025 |
|
Forecast Period |
2026-2034 |
|
Largest Region |
North America (36.7% share, 2025) |
|
Fastest Growing Region |
Asia Pacific (~16.8% CAGR) |
|
Dominant Type Segment |
Lethal (59.1%, 2025) |
|
Dominant Application |
Defense (67.8%, 2025) |
The directed energy weapons market growth trajectory from 2020 through 2034 contrasts historical expansion-from USD 4.92 Billion in 2020 to USD 9.95 Billion in 2025-against a sustained forecast curve powered by HEL technology maturity, counter-drone mandates, and cross-domain military modernization.
To get more information on this market, Request Sample
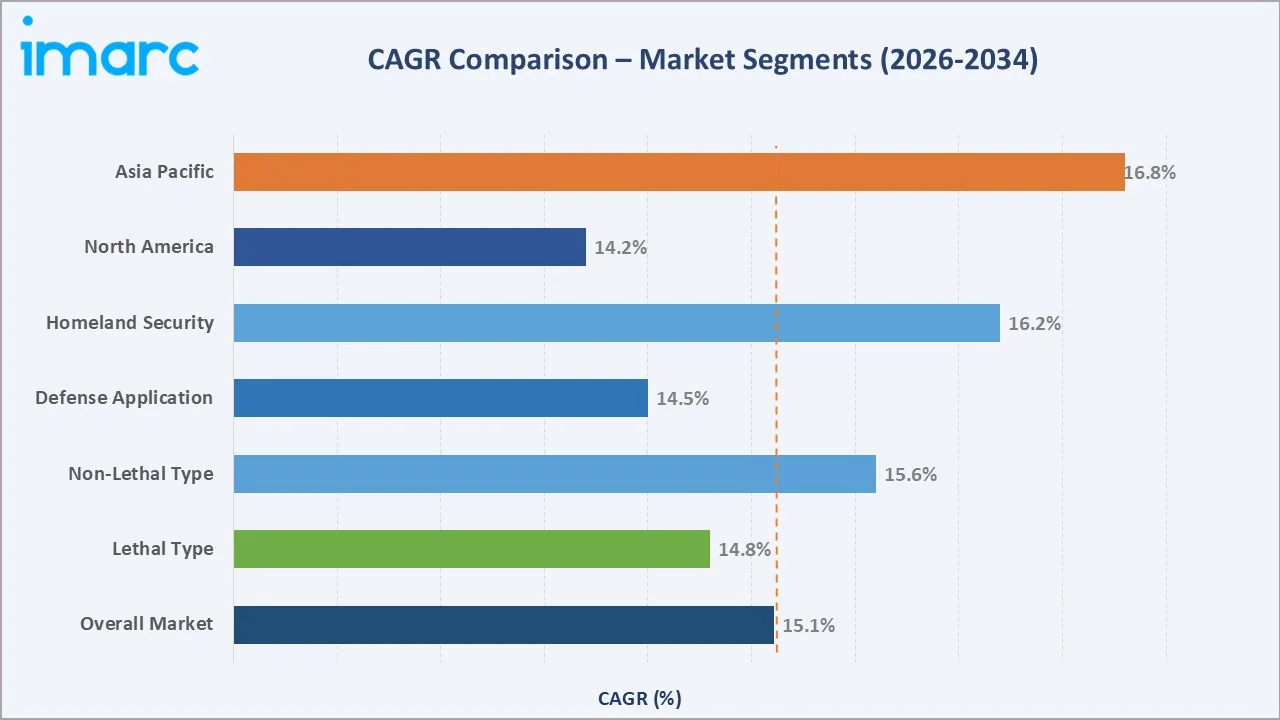
Segment-level CAGR comparisons highlight homeland security and Asia Pacific as the fastest-growing categories within the global directed energy weapons market forecast through 2034, outpacing the overall 15.11% benchmark.
Executive Summary
The global directed energy weapons (DEW) market is undergoing a structural transformation. It is driven by multi-domain warfare doctrine, rising threats from hypersonic missiles and drone swarms, and demonstrated operational successes of laser and high-power microwave systems. Valued at USD 9.95 Billion in 2025-up from USD 4.92 Billion in 2020-the market is forecast to reach USD 35.32 Billion by 2034 at a CAGR of 15.11%.
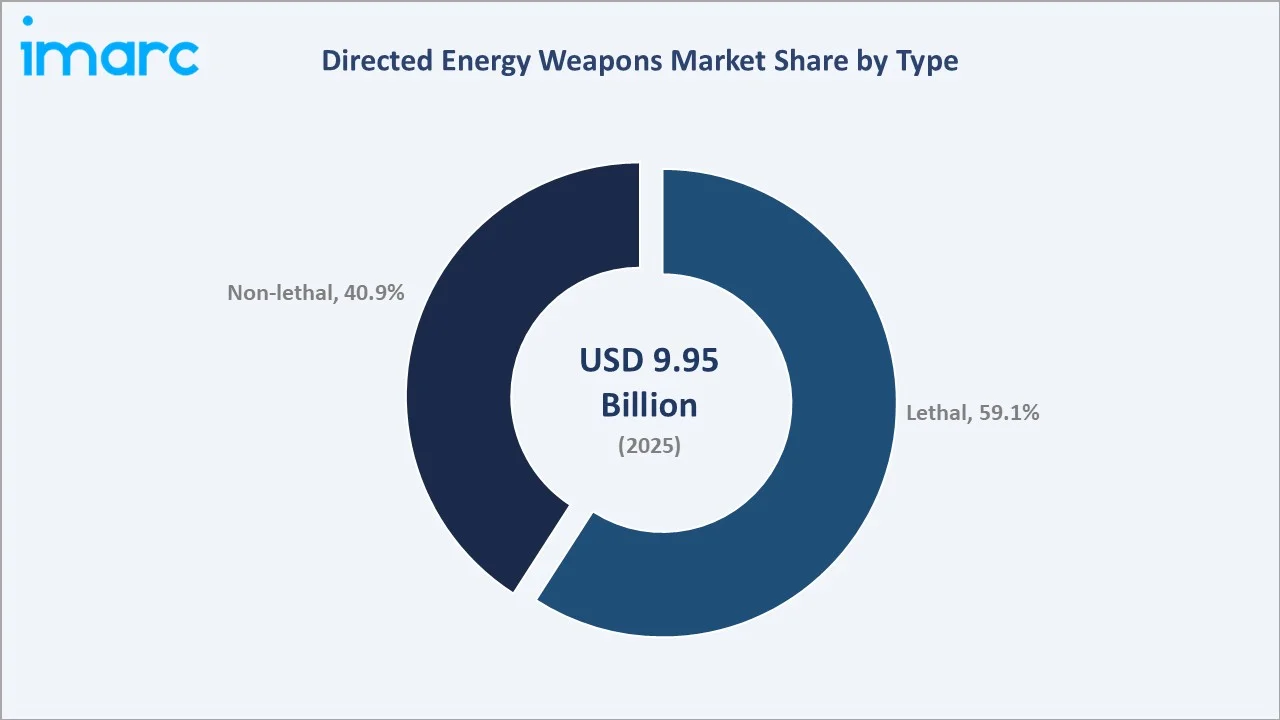
Lethal systems command 59.1% share in 2025, driven by high-energy laser (HEL) platform fielding and solid-state laser maturity across ground, naval, and airborne platforms. Non-lethal systems hold 40.9% and are the fastest-growing category at an estimated 15.6% CAGR through 2034, as counter-UAS and crowd-control applications expand. Defense applications dominate at 67.8% of global demand in 2025, underpinned by DoD programs including HELIOS and SHIELD.
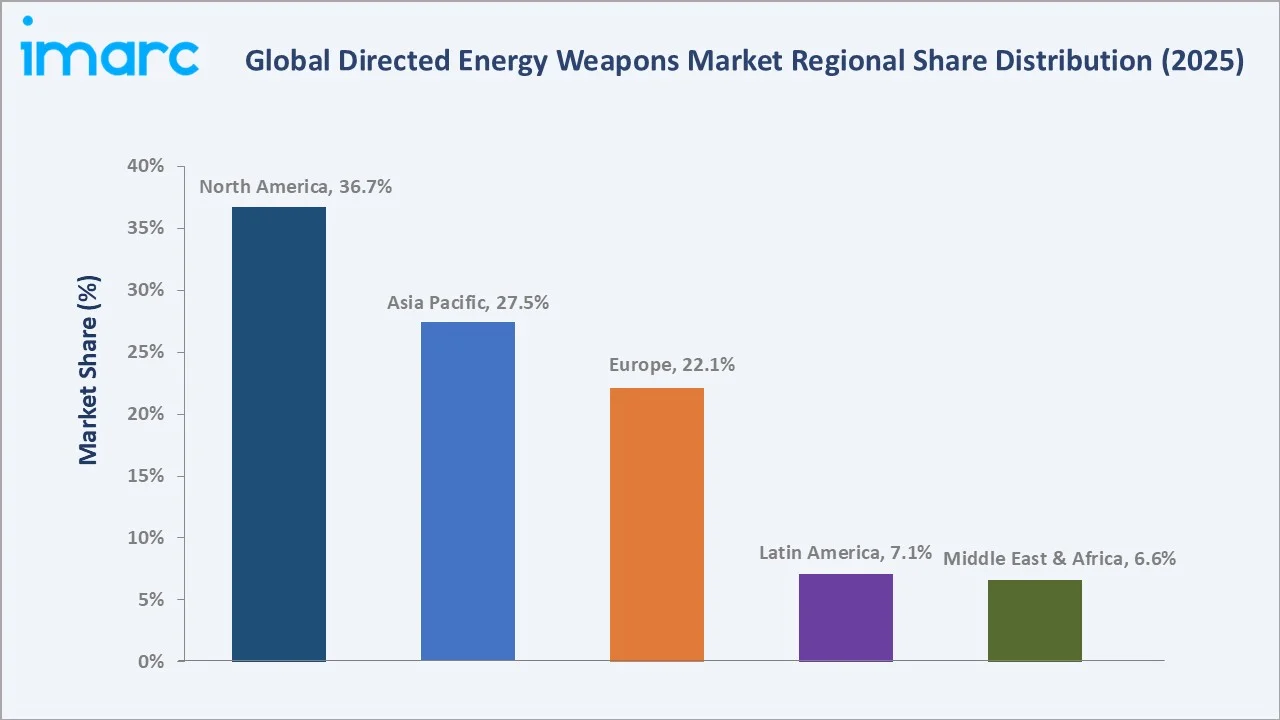
North America leads with 36.7% global revenue share in 2025. Asia Pacific holds 27.5% and is the fastest-growing region, advancing at approximately 16.8% CAGR through 2034, driven by China PLA modernization and India's DRDO DEW programs. The directed energy weapons market outlook remains strongly positive as geopolitical tensions, technology readiness, and defense budget expansion converge across all major theaters.
Key Market Insights
|
Insight |
Data |
|
Largest Type Segment |
Lethal – 59.1% share (2025) |
|
Second Type Segment |
Non-Lethal – 40.9% share (2025) |
|
Dominant Application |
Defense – 67.8% share (2025) |
|
Second Application |
Homeland Security – 32.2% share (2025) |
|
Leading Region |
North America – 36.7% revenue share (2025) |
|
Fastest Growing Region |
Asia Pacific – ~16.8% CAGR (2026-2034) |
|
Top Companies |
RTX, Lockheed Martin Corporation, Northrop Grumman, L3Harris Technologies, Inc., BAE Systems, Boeing, Elbit Systems Ltd, RAFAEL Advanced Defense Systems Ltd |
|
Market Opportunity |
Counter-UAS and airborne DEW platforms expected to drive USD 25B+ incremental value by 2034 |
Key Analytical Observations Supporting The Above Data:
- Lethal Segment's 59.1% Share: Lethal systems' 59.1% dominance in 2025 reflects the operational deployment of ground-based HEL platforms such as the U.S. Army's HEL-MD and the U.S. Navy's HELIOS system aboard destroyers.
- Defense Application Dominance at 67.8%: Defense applications' 67.8% share is driven by DoD annual directed energy investment, with Joint Chiefs of Staff embedding DEW into all-domain command mandates.
- North America's 36.7% Revenue Lead: North America's 36.7% lead is anchored by the U.S. defense budget reaching USD 886 Billion in FY2025, with dedicated DEW program lines across DARPA, MDA, and all four service branches.
- Asia Pacific's 27.5% and Rising Trajectory: Asia Pacific's 27.5% share reflects China's PLA Strategic Support Force integration of laser and HPM systems, India's DRDO DURGA II program, and Japan's expanding defense budget.
- Counter-UAS Market Opportunity: The counter-UAS segment is the single fastest-growing application sub-category, projected to generate substantial incremental market value over the forecast period as drone proliferation accelerates globally.
- First Operational Combat Deployment in 2024: Israel's Rafael Advanced Defense Systems deployed Iron Beam-a combat-proven 100 kW HEL system-operationally in 2024, establishing the first documented successful interception of mortar rounds using directed energy in live conflict conditions.
Global Directed Energy Weapons Market Overview
Directed energy weapons are advanced military systems that emit highly focused energy-typically in the form of high-energy lasers (HEL), high-power microwave (HPM) radiation, or particle beams-to disable, damage, or destroy target equipment, vehicles, or infrastructure.
The global DEW market encompasses a broad portfolio ranging from tactical counter-UAS laser systems to strategic high-power microwave platforms and experimental particle-beam weapons under active research by the U.S. DARPA, China's CASC, and European defense agencies.
The industry operates at the intersection of advanced photonics, power electronics, beam-control optics, and multi-domain warfare doctrine. Growth is supported by macroeconomic drivers including rising defense budgets (global spending reached USD 2.63 Trillion in 2025), increasing drone threat complexity, and precision-strike operational requirements.
The market is simultaneously undergoing a structural shift toward solid-state lasers, fiber-coupled HEL arrays, and AI-assisted targeting systems that are redefining procurement and operational deployment strategies on a global scale.
Market Dynamics
To evaluate market opportunities, Request Sample
Market Drivers
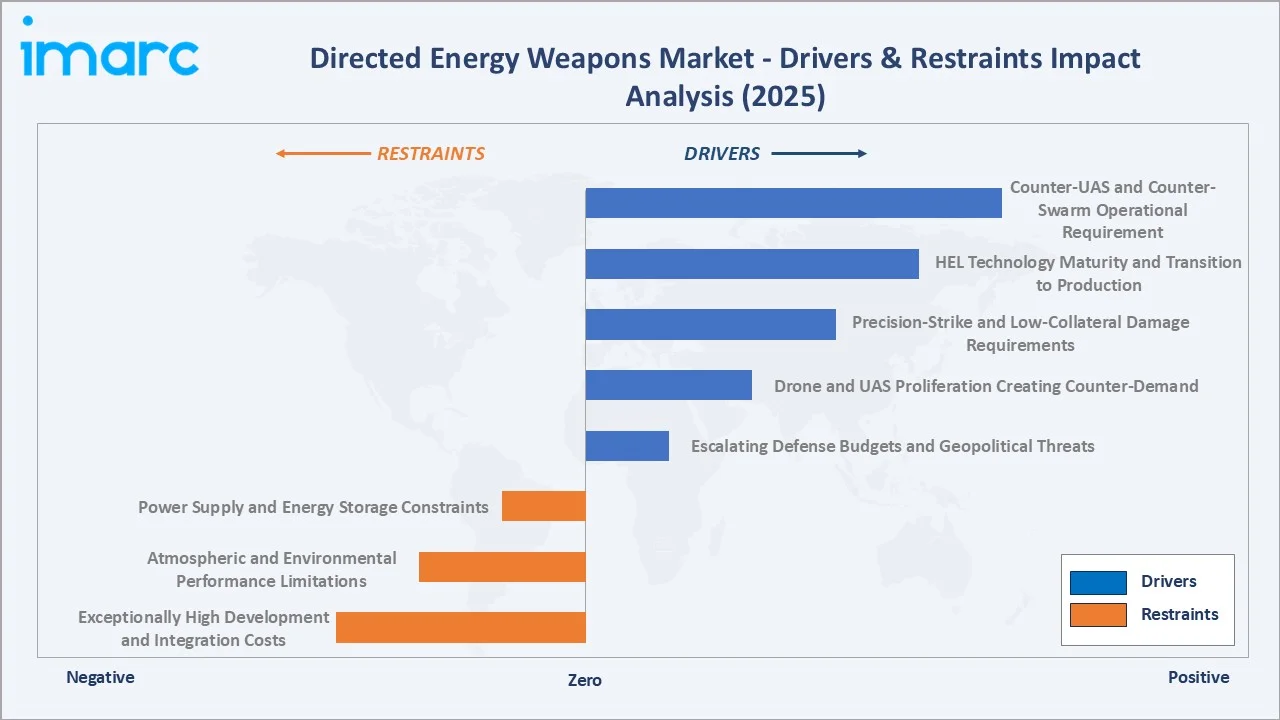
- Escalating Defense Budgets and Geopolitical Threats: Global defense spending reached USD 2.63 Trillion in 2025. The U.S. FY2025 defense budget allocated USD 886 Billion, with dedicated DEW lines across DARPA, Missile Defense Agency, and all service branches. Rising geopolitical tensions in the Indo-Pacific and Eastern Europe are accelerating DEW procurement cycles.
- Drone and UAS Proliferation Creating Counter-Demand: The proliferation of commercially available drones creates asymmetric threats at scale. Drone swarms are increasingly deployed in conflict zones, driving urgent demand for directed energy-based counter-UAS solutions that offer low cost-per-shot versus traditional kinetic interceptors
- Precision-Strike and Low-Collateral Damage Requirements: DEW systems offer precision engagement with adjustable lethality and near-zero collateral damage in urban or contested environments. NATO's multi-domain operations doctrine explicitly incorporates DEW as a suppression, disruption, and hard-kill capability, driving structured procurement across member states.
- HEL Technology Maturity and Transition to Production: Solid-state high-energy laser (HEL) systems have reached field-deployable power thresholds, enabling a transition from development programs to series production and operational deployment. Advancements in beam quality, thermal management, and precision pointing-and-tracking are significantly accelerating the technology readiness curve.
Market Restraints
- Exceptionally High Development and Integration Costs: Directed Energy Weapon (DEW) platform R&D expenditure is typically very high per program. Key barriers include complex power supply engineering, advanced thermal management, precision optics, and rigorous environmental testing, which limit market entry to a small group of established prime contractors and create budget challenges for smaller nations.
- Atmospheric and Environmental Performance Limitations: Laser effectiveness degrades significantly in adverse weather conditions such as fog, rain, dust, and atmospheric turbulence. Factors like thermal blooming and atmospheric absorption reduce operational range and performance in degraded environments, limiting mission availability and creating constraints for operational planning.
- Power Supply and Energy Storage Constraints: High-power directed energy weapon (DEW) systems require substantial onboard power generation and storage. Integration into mobile land, naval, and airborne platforms necessitates dedicated power conditioning systems, which add to overall weight, volume, and cost, creating engineering and deployment challenges.
Market Opportunities
- Counter-UAS and Counter-Swarm Operational Requirement: Counter-drone demand is expected to generate substantial incremental market value in the DEW sector over the coming years. Events such as the Red Sea Houthi drone campaign highlighted the economic challenges of relying solely on kinetic responses, accelerating government procurement of more cost-effective directed energy counter-UAS solutions.
- Expanding Homeland Security and Border Protection Applications: DEW capabilities are expanding beyond traditional defense roles into border protection, critical infrastructure defense, and airport security. U.S. CBP counter-drone requirements, European airport security mandates, and Middle East border protection programs are creating structured civilian homeland security procurement pipelines.
- Space-Based and Dual-Use DEW Emerging Opportunities: Emerging dual-use directed energy weapon (DEW) technologies—including satellite uplink jamming, space debris mitigation, and directed microwave communications disruption—are opening adjacent commercial and space-defense market segments, creating new growth opportunities across both civilian and military applications.
Market Challenges
- Regulatory Compliance and Treaty Frameworks: DEW systems must navigate complex weapons treaties, export control regimes (ITAR, EAR), and evolving rules of engagement that define acceptable use of directed energy in conflict. Regulatory ambiguity across jurisdictions creates procurement delays and limits allied interoperability.
- Supply Chain Vulnerabilities in Critical Materials: Ensuring continuous supply of rare earth elements, high-purity optical materials, gallium arsenide, and specialized power electronics requires robust supply chain management. U.S.-China rare earth trade tensions directly impact domestic DEW production schedules and cost structures.
Emerging Market Trends
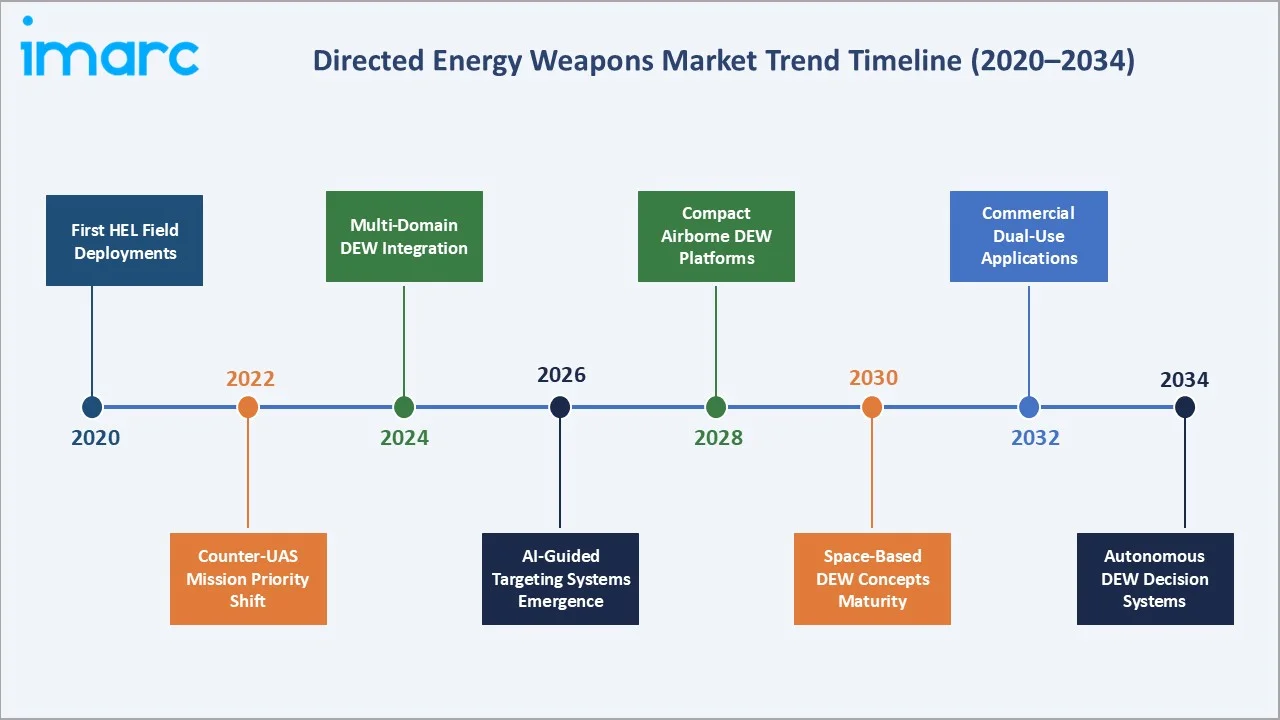
1. Transition from Demonstrators to Series Production
Multiple directed energy weapon (DEW) programs have transitioned from technology demonstration to procurement contracts in recent years. Northrop Grumman’s SHIELD program, delivered to the U.S. Air Force, represents a major milestone in airborne high-energy laser system deployment. This shift toward commercialization is compressing program timelines and improving economies of scale.
2. Counter-UAS Mission Specialization
Dedicated counter-drone DEW platforms-including vehicle-mounted, ship-based, and fixed-site laser systems-are emerging as the dominant procurement category. The U.S. Army's DE M-SHORAD and Navy's shipboard HEL programs are purpose-built for drone threat response. European NATO members committed to deploying counter-UAS DEW systems across eastern flank installations following the 2022-2024 Ukraine conflict experience.
3. AI and Machine Learning Integration in Targeting
Artificial intelligence is being embedded into DEW fire-control systems to enable autonomous target classification, engagement prioritization, and adaptive beam optimization. DARPA's AI Next campaign allocated funding specifically for AI-guided DEW targeting.
4. Naval Platform Integration Acceleration
Naval directed energy weapon (DEW) deployment is accelerating following validation of the high cost of kinetic interceptors during the Red Sea conflict. The U.S. Navy’s HELIOS program and subsequent upgrades highlight a growing commitment to integrating DEW as a standard ship-based system.
5. Multi-Domain and Convergent DEW Architectures
Defense agencies are developing integrated DEW-plus-electronic-warfare (EW) platforms that combine laser, HPM, and jamming capabilities in a single system. L3Harris's Advanced DEW systems and Raytheon's Multi-Spectral Targeting System exemplify this trend. Convergent architectures increase platform utility, reduce logistics burden, and improve return-on-investment for budget-constrained allied nations.
Industry Value Chain Analysis
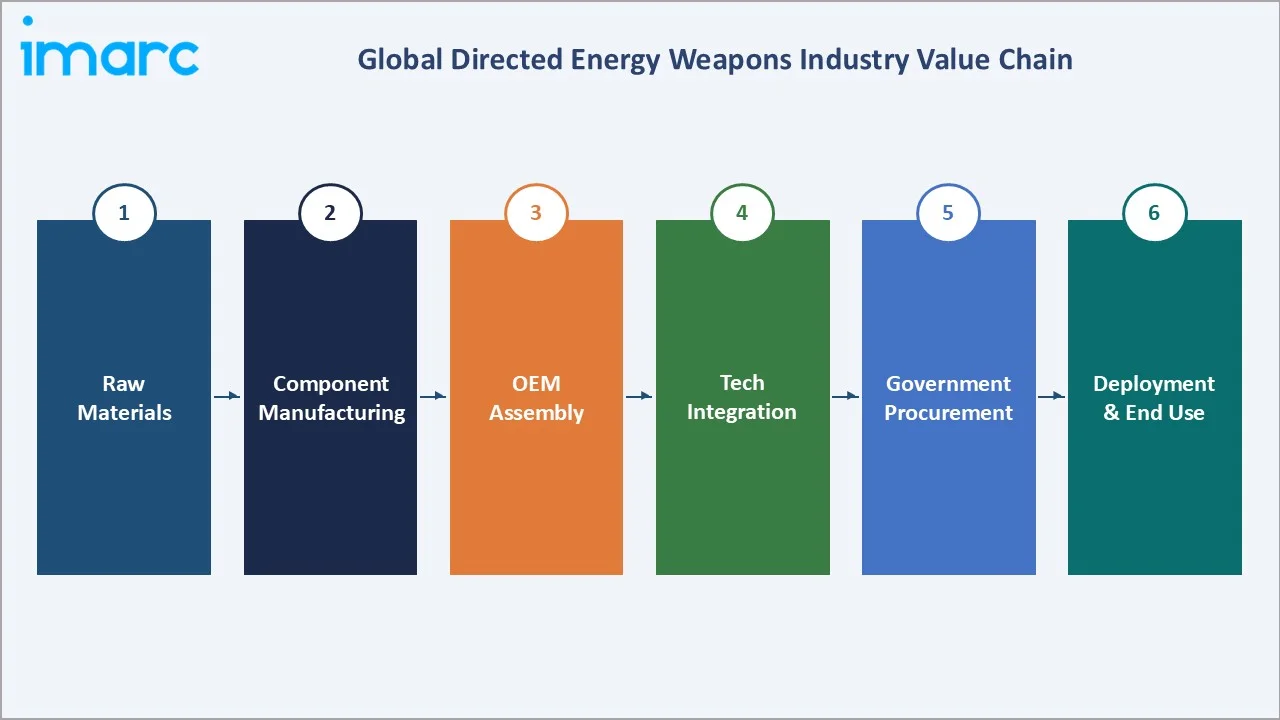
The global directed energy weapons industry value chain spans six integrated stages from raw material supply through operational deployment. Each stage presents distinct competitive dynamics, technology investment requirements, and security-driven supply chain considerations relevant to the overall directed energy weapons market analysis.
|
Value Chain Stage |
Key Participants / Description |
|
Raw Materials |
Rare earth elements, optical fibers, high-power diodes, gallium arsenide, and advanced composites sourced from the U.S., China, and Australia |
|
Component Manufacturing |
Laser modules, beam directors, microwave emitters, power conditioning units - produced by Tier-2/3 suppliers in the U.S., Israel, and Germany |
|
OEM Manufacturing |
RTX Corporation, Lockheed Martin, Northrop Grumman, L3Harris, BAE Systems, Boeing - full platform integration, qualification, and certification |
|
Technology Integration |
AI targeting systems, C4I networks, adaptive optics, thermal management, and real-time fire control integration |
|
Government Procurement |
Direct procurement by DoD, NATO allies, foreign military sales (FMS), and homeland security agencies |
|
Deployment & End Users |
Armed forces (army, navy, air force), coast guard, homeland security agencies, and allied defense forces globally |
OEM prime contractors hold the highest strategic value by integrating advanced photonics, power electronics, and AI-guided fire control into deployable weapon systems. Meanwhile, direct government procurement channels through DoD, NATO procurement agencies, and foreign military sales (FMS) create long-term, high-value contract structures that define market growth patterns across the forecast period.
Technology Landscape in the Directed Energy Weapons Industry
High-Energy Laser (HEL) Systems
Solid-state and fiber-coupled high-energy laser (HEL) systems represent the most advanced and commercially mature segment within directed energy weapons. These technologies have evolved from early-stage tactical demonstrators to fully operational systems, enabling broader deployment across defense platforms.
High-Power Microwave (HPM) Systems
HPM systems emit directed microwave energy to disrupt or destroy electronic components in drones, missiles, and communication systems. CHAMP (Counter-electronics High-Powered Microwave Advanced Missile Project) demonstrated the ability to disable multiple targets on a single sortie. HPM technology offers wide-area effect capability-critical for drone swarm counter-engagement-distinguishing it from narrow-beam laser alternatives.
Particle Beam Technology
Particle beam weapons accelerate charged or neutral particles to near-relativistic velocities for high-energy target engagement. While still primarily in the research phase-with the U.S. Strategic Defense Initiative laying foundational work-modern DARPA programs and Chinese CASC research suggest particle beam weapons could achieve limited operational relevance by 2032-2035.
Adaptive Optics and Beam Control Innovation
Atmospheric turbulence compensation through adaptive optics is a critical enabling technology for extending DEW effective range. DARPA's RELI (Robust Electric Laser Initiative) funded development of wavefront sensors and deformable mirror systems that correct for atmospheric distortion in real time.
Market Segmentation Analysis
The report covers the following segments:
|
Segment Category |
Leading Segment |
Market Share |
Year |
|
Type |
Lethal |
59.1% |
2025 |
|
Application |
Defense |
67.8% |
2025 |
|
Technology |
High Energy Laser |
50.6% |
2025 |
|
End Use |
Land Vehicles |
🔒 |
2025 |
|
Region |
North America |
36.7% |
2025 |

By Type
To access detailed market analysis, Request Sample
Lethal systems lead the global directed energy weapons market type segmentation with a 59.1% share in 2025. This dominance reflects the maturity of high-energy laser programs specifically designed for kinetic defeat of drones, mortar rounds, boats, and aircraft. The U.S. Navy's HELIOS system and the U.S. Army's HEL-TD are operationally fielded lethal platforms.
By Application
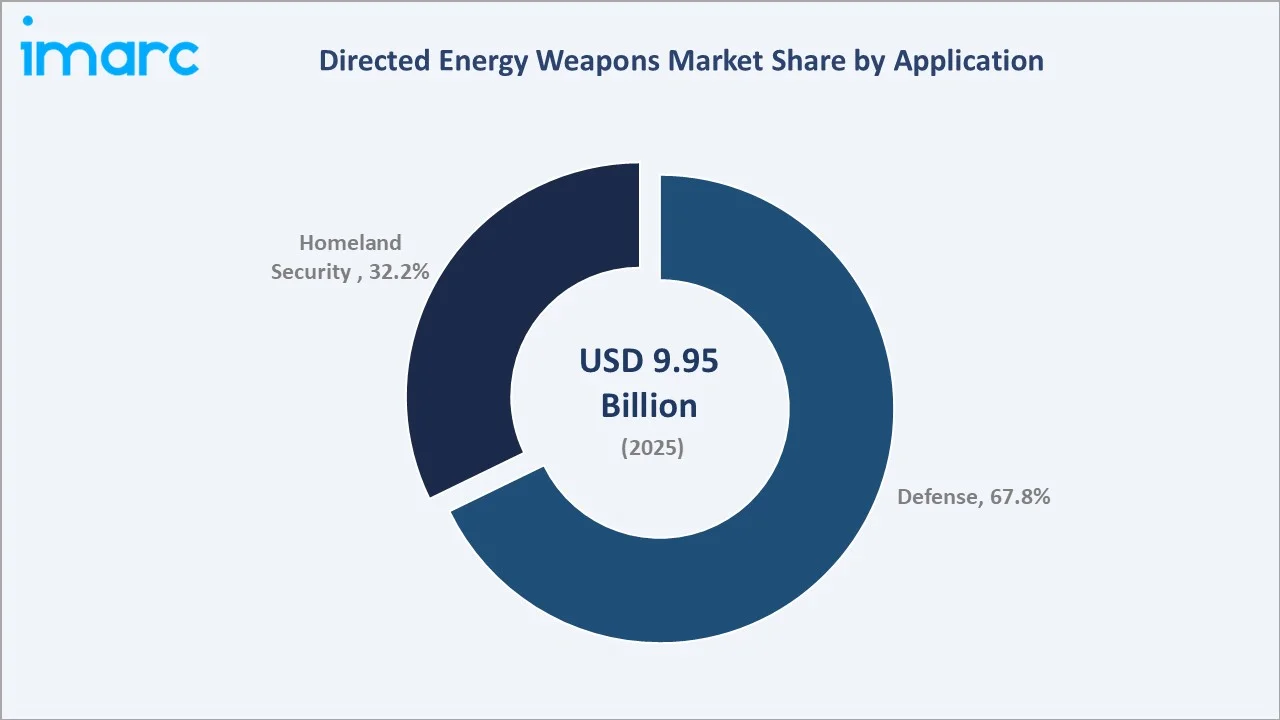
Defense is the dominant application segment at 67.8% of global revenue in 2025. DoD annual directed energy program spending exceeded USD 1.0 Billion in 2022-2025, with investments distributed across DARPA exploratory programs, MDA missile defense integration, and service-specific operational programs.
Regional Market Insights
|
Region |
Share (2025) |
Key Growth Drivers |
|
North America |
36.7% |
U.S. DoD DEW programs, DARPA investment, counter-UAS mandates, Pacific Deterrence Initiative |
|
Asia Pacific |
27.5% |
China PLA modernization, India DRDO DEW programs, Japan/South Korea defense buildup |
|
Europe |
22.1% |
NATO DEW commitments, UK/Germany laser programs, Russia threat response, MBDA HEL development |
|
Latin America |
7.1% |
Brazil and Colombia border security, counter-narco applications, naval force modernization |
|
Middle East & Africa |
6.6% |
Israel Iron Beam, UAE counter-drone systems, Saudi Arabia Vision 2030 defense investment |
North America commands 36.7% global revenue share in 2025. The United States is the world's most advanced DEW developer and primary procurer, with the DoD operating 20+ active DEW programs across DARPA, MDA, and the four service branches.
Competitive Landscape
|
Company Name |
Key Platform / Brand |
Market Position |
Core Strength |
|
RTX |
High Energy Laser |
Leader |
Ground-based DEW systems, U.S. Army primary supplier |
|
Lockheed Martin Corporation |
HELIOS, ATHENA, ADAM |
Leader |
Airborne and naval HEL integration, multi-domain capability |
|
Northrop Grumman |
SHIELD AI, HEL TD |
Leader |
Airborne DEW, solid-state laser innovation, DoD contracts |
|
L3Harris Technologies, Inc. |
Next Generation Aiming Laser (NGAL) |
Challenger |
Electronic warfare convergence, multi-spectral DEW |
|
BAE Systems |
Laser Developed Atmospheric Lens (LDAL) |
Challenger |
UK MoD primary partner, NATO interoperability |
|
Boeing |
HEL-MD |
Challenger |
Platform integration, counter-UAS, air-to-air DEW |
|
Elbit Systems Ltd |
Sting |
Emerging |
Israel-based, compact portable DEW solutions |
|
RAFAEL Advanced Defense Systems Ltd |
IRON BEAM - High Energy Laser Weapon System |
Emerging |
Iron Dome ecosystem, proven operational deployment |
The global directed energy weapons market competitive landscape is moderately concentrated, with a small number of large prime contractors commanding the majority of contract value.
Key Company Profiles
RTX
RTX is one of the world’s largest aerospace and defense companies, headquartered in Arlington, Virginia. Formed through the merger of Raytheon Company and United Technologies and rebranded as RTX in 2023, the company provides advanced systems and services for commercial, military, and government customers globally.
- Product & Platform Portfolio: High Energy Laser Mobile Demonstrator (HEL MD), the Multi-Spectral Targeting System (MTS) with integrated laser, and Laser Weapon System (LaWS)
- Recent Developments: In 2026, RTX released a line of modular kilowatt-scale laser systems, supporting both military testing and operational deployments. In 2026, RTX has been awarded three U.S. Department of Defense contracts totaling approximately $980 million for radar development and avionics sustainment.
- Strategic Focus: RTX's DEW strategy centers on power-scaling, convergent EW-plus-laser architectures, and expansion of international partner DEW supply agreements through FMS mechanisms.
Lockheed Martin Corporation
Lockheed Martin Corporation is a leading global aerospace and defense company headquartered in Bethesda, Maryland. Founded in 1995 through the merger of Lockheed Corporation and Martin Marietta, the company provides advanced technology systems, products, and services for defense, aerospace, and security applications.
- Product & Platform Portfolio: Key DEW platforms include HELIOS (High Energy Laser with Integrated Optical-dazzler and Surveillance), ATHENA (Advanced Test High Energy Asset), ADAM (Area Defense Anti-Munitions), and the Airborne High-Energy Laser (AHEL) program.
- Recent Developments: In 2026, Lockheed Martin Corporation achieved first light from its 50-kW DEIMOS laser system, verifying beam quality for tactical operations. The DEIMOS system is designed for integration with the Stryker combat vehicle, providing robust directed energy capability to support the U.S. Army’s Maneuver Short-Range Air Defense (M-SHORAD) missions.
- Strategic Focus: Lockheed Martin's strategy prioritizes multi-domain HEL integration across air, land, and sea platforms, advancement of fiber-laser beam-combining technology to reach MW-class power, and partnership with NATO allies for co-production of HEL platforms.
Northrop Grumman
Northrop Grumman Corporation is a leading global aerospace and defense company headquartered in Falls Church, Virginia. Founded in 1939, the company specializes in autonomous systems, cybersecurity, C4ISR, missile defense, and advanced aerospace technologies.
- Product & Platform Portfolio: Northrop's DEW portfolio includes the SHIELD (Single High-power Integrated Laser for DoD) program delivered to the U.S. Air Force in 2024, the High Energy Laser Technology Demonstrator (HEL TD), and next-generation particle beam research programs under DARPA funding.
- Recent Developments: In 2025, Northrop Grumman Corporation, along with AeroVironment, Inc. and Shield AI, announced major partnerships with Taiwan to enhance missile defense and autonomous systems capabilities. Revealed at the Taipei Aerospace and Defence Technology Exhibition (TADTE) 2026, the collaborations aim to strengthen Taiwan’s self-reliant defense through co-development, technology transfer, and integration of advanced Western defense technologies.
- Strategic Focus: Northrop Grumman's DEW strategy focuses on power scaling toward MW-class solid-state lasers, AI-guided adaptive optics for extended-range engagement, and space-based DEW architecture research in partnership with the U.S. Space Force.
Market Concentration Analysis
The directed energy weapons market exhibits moderate-to-high concentration, with the top 3 players- RTX, Lockheed Martin Corporation, Northrop Grumman -collectively holding an estimated 55-60% of total global revenue in 2025, reflecting the capital-intensive nature of DEW development, mandatory security clearances for program participation, and long-cycle government contract structures.
Market fragmentation is limited at the prime contractor level but increases significantly in the component and subsystem tier. Specialized suppliers of high-power diodes, optical fiber components, adaptive optics, and power conditioning units include a broader ecosystem of mid-sized and specialist firms.
Investment & Growth Opportunities
Fastest-Growing Segments
- Non-Lethal Counter-UAS: Non-lethal DEW for homeland security and counter-UAS is the fastest-growing sub-segment at ~16.2% CAGR through 2034, driven by airport security, border protection, and urban counter-drone applications.
- Naval Platform DEW Integration: Shipboard and naval directed energy weapon (DEW) integration is accelerating following validation in recent conflicts, with global naval DEW procurement projected to grow significantly over the coming decade.
- AI-Enabled Targeting Systems: AI-guided adaptive targeting systems represent a high-margin software and integration opportunity, with DARPA and allied defense agencies allocating dedicated funding for autonomy-enabled DEW engagement architectures.
Emerging Markets
- Indo-Pacific Alliance Nations: India’s DRDO directed energy weapon programs, Japan’s defense spending targets, and South Korea’s K-DEWS program collectively represent a significant new procurement opportunity in the global DEW market over the coming years.
- GCC Nations: Saudi Arabia, UAE, Qatar, and Kuwait are accelerating DEW procurement under Gulf Cooperation Council (GCC) joint defense frameworks, targeting counter-drone and infrastructure protection capabilities.
- Eastern Europe and NATO Expansion: European NATO member states, including Germany, Poland, and Nordic countries, are prioritizing directed energy weapon (DEW) capabilities through 2030. NATO also agreed to gradually increase overall defense spending to 5% of GDP annually by 2035, further accelerating investments in advanced technologies such as DEWs.
Venture and Strategic Investment Trends
The directed energy weapon (DEW) sector is seeing growing venture and private equity interest in component-level technology startups, especially in high-power diode arrays, solid-state laser gain media, and AI fire-control software. Programs such as the U.S. Defense Innovation Unit (DIU) and AFWERX have supported numerous early-stage DEW companies, while strategic acquisitions by prime contractors targeting specialized photonics and adaptive optics capabilities are expected to rise in the coming years.
Future Market Outlook (2026-2034)
The global directed energy weapons market is positioned for transformative growth through 2034. From USD 9.95 Billion in 2025 to a projected USD 35.32 Billion by 2034, the market will more than triple in value over the forecast period. Key inflection points include the first multi-nation naval HEL combat deployments (2026-2027), MW-class solid-state laser fielding for strategic applications (2029-2031), and the emergence of space-based DEW systems in experimental deployment (2032-2034).
Technological disruptions will include the maturation of fiber-laser beam combining to reach MW-class power at reduced size, weight, and power (SWaP) metrics; integration of quantum sensor technology for hyper-precise target tracking; and the introduction of autonomous engagement architectures that reduce human decision latency to milliseconds.
Research Methodology
Primary Research
Primary research underpins the directed energy weapons market analysis through structured interviews and consultations with defense procurement officials, DEW program managers, prime contractor executives, and independent defense analysts. In-depth interviews with 60+ industry stakeholders were conducted across North America, Europe, and Asia Pacific. Expert validation workshops were held for key market sizing assumptions, segment share estimates, and regional forecast models.
Secondary Research
Secondary research sources include published defense budget documents (DoD FYDP, NATO defense expenditure reports, SIPRI Military Expenditure Database), government program acquisition records, SEC filings of public defense contractors, defense trade publications (Defense News, Jane's, Breaking Defense), conference proceedings from AUSA, Sea-Air-Space, and Euronaval, and IMARC's proprietary defense technology intelligence databases.
Forecasting Models
Market forecasting employs a combination of bottom-up program-by-program procurement modeling (aggregating known and anticipated contract values across 120+ active DEW programs globally), top-down defense budget allocation analysis, and econometric regression models validated against historical DEW market performance from 2015-2025. Scenario analysis incorporates base, bull, and bear cases reflecting varying defense budget trajectories and technology development timelines. Cross-validation was performed using independent defense analyst estimates from RAND Corporation, CNA, and CSIS publications.
Directed Energy Weapons Market Report Scope:
| Report Features | Details |
|---|---|
| Base Year of the Analysis | 2025 |
| Historical Period | 2020-2025 |
| Forecast Period | 2026-2034 |
| Units | Billion USD |
| Scope of the Report |
Exploration of Historical Trends and Market Outlook, Industry Catalysts and Challenges, Segment-Wise Historical and Future Market Assessment:
|
| Types Covered | Lethal, Non-Lethal |
| Applications Covered | Homeland Security, Defense |
| Technologies Covered |
|
| End Uses Covered | Ship Based, Land Vehicles, Airborne, Gun Shot |
| Regions Covered | Asia Pacific, Europe, North America, Latin America, Middle East and Africa |
| Countries Covered | United States, Canada, Germany, France, United Kingdom, Italy, Spain, Russia, China, Japan, India, South Korea, Australia, Indonesia, Brazil, Mexico |
| Companies Covered | RTX, Lockheed Martin Corporation, Northrop Grumman, L3Harris Technologies, Inc., BAE Systems, Boeing, Elbit Systems Ltd, RAFAEL Advanced Defense Systems Ltd, etc. |
| Customization Scope | 10% Free Customization |
| Post-Sale Analyst Support | 10-12 Weeks |
| Delivery Format | PDF and Excel through Email (We can also provide the editable version of the report in PPT/Word format on special request) |
Key Benefits for Stakeholders:
- IMARC’s report offers a comprehensive quantitative analysis of various market segments, historical and current market trends, market forecasts, and dynamics of the directed energy weapons market from 2020-2034.
- The research study provides the latest information on the market drivers, challenges, and opportunities in the global directed energy weapons market.
- The study maps the leading, as well as the fastest-growing, regional markets. It further enables stakeholders to identify the key country-level markets within each region.
- Porter's Five Forces analysis assists stakeholders in assessing the impact of new entrants, competitive rivalry, supplier power, buyer power, and the threat of substitution. It helps stakeholders to analyze the level of competition within the directed energy weapons industry and its attractiveness.
- The competitive landscape allows stakeholders to understand their competitive environment and provides insight into the current positions of key players in the market.
Frequently Asked Questions About the Directed Energy Weapons Market Report
The global directed energy weapons market size was valued at USD 9.95 Billion in 2025, growing from USD 4.92 Billion in 2020.
The market is projected to reach USD 35.32 Billion by 2034, exhibiting a CAGR of 15.11% during the 2026-2034 forecast period according to IMARC Group.
Key drivers include escalating defense budgets globally, rapid drone proliferation creating counter-UAS demand, HEL technology maturity, and precision-strike operational requirements across multi-domain warfare doctrines.
Lethal directed energy weapons dominate with 59.1% share in 2025, driven by high-energy laser platform deployments across naval, ground, and airborne military platforms.
Defense applications command 67.8% of global revenue in 2025, underpinned by DoD programs exceeding USD 1 Billion annually and NATO DEW capability mandates.
North America leads with 36.7% global revenue share in 2025, anchored by U.S. DoD's 20+ active DEW programs and the world's highest directed energy R&D expenditure.
Asia Pacific is the fastest-growing region at an estimated 16.8% CAGR through 2034, driven by China PLA modernization, India DRDO DEW programs, and Japan/South Korea defense budget expansion.
Key players include RTX, Lockheed Martin Corporation, Northrop Grumman, L3Harris Technologies, Inc., BAE Systems, Boeing, Elbit Systems Ltd, RAFAEL Advanced Defense Systems Ltd.
Non-lethal directed energy weapons hold 40.9% of global market share in 2025 and are the fastest-growing type segment at an estimated 15.6% CAGR driven by homeland security and counter-UAS applications.
Key trends include transition from demonstrators to series production, AI-guided targeting integration, naval platform DEW acceleration, counter-UAS specialization, and multi-domain convergent DEW-EW architectures.
North America's directed energy weapons market was valued at approximately USD 3.67 Billion in 2025, representing 36.7% of global revenue, anchored by the U.S. DoD and allied FMS programs.
The global directed energy weapons market is expected to grow at a CAGR of 15.11% during the forecast period from 2026-2034, reaching USD 35.32 Billion by 2034.
Need more help?
- Speak to our experienced analysts for insights on the current market scenarios.
- Include additional segments and countries to customize the report as per your requirement.
- Gain an unparalleled competitive advantage in your domain by understanding how to utilize the report and positively impacting your operations and revenue.
- For further assistance, please connect with our analysts.
 Request Customization
 Speak to an Analyst
 Request Brochure
 Inquire Before Buying
Benefits of Customization
- Personalize this research
- Triangulate with your data
- Get data as per your format and definition
- Gain a deeper dive into a specific application, geography, customer, or competitor
- Any level of personalization
Get in Touch With Us
UNITED STATES
Phone: +1-201-971-6302
INDIA
Phone: +91-120-433-0800
UNITED KINGDOM
Phone: +44-753-714-6104
Email: [email protected]
Client Testimonials


.webp)


