
Drilling and Completion Fluids Market Report by System Type (Water-based System, Oil-based System, Synthetic Fluid-based System, and Others), Well Type (HPHT (High Pressure High Temperature) Wells, Conventional Wells), Application (Onshore, Offshore), and Region 2026-2034
Market Overview:
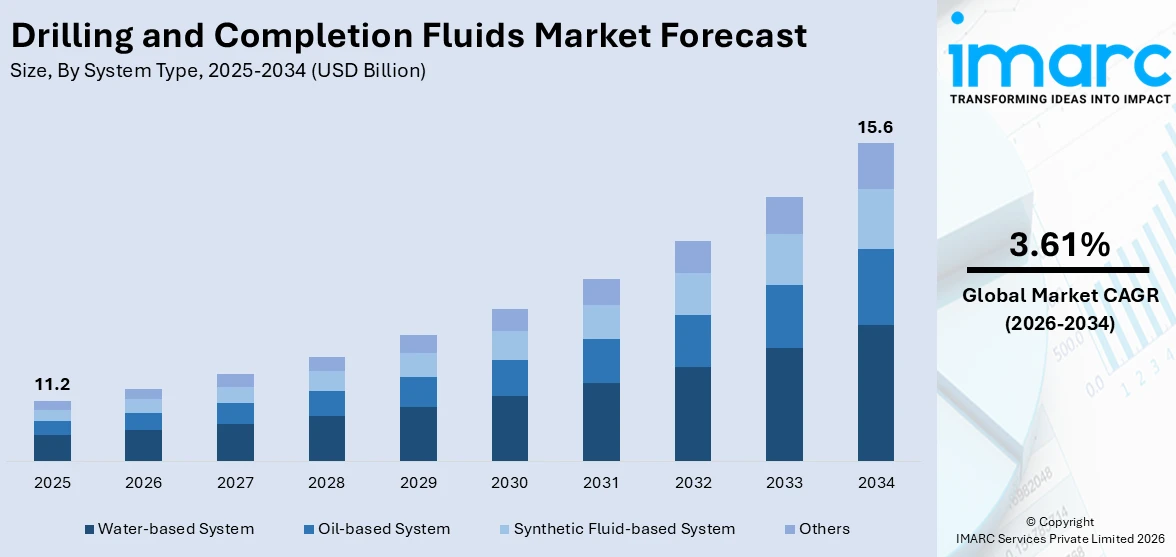
The global drilling and completion fluids market size reached USD 11.2 Billion in 2025. Looking forward, IMARC Group expects the market to reach USD 15.6 Billion by 2034, exhibiting a growth rate (CAGR) of 3.61% during 2026-2034.
|
Report Attribute
|
Key Statistics
|
|---|---|
|
Base Year
|
2025
|
|
Forecast Years
|
2026-2034
|
|
Historical Years
|
2020-2025
|
|
Market Size in 2025
|
USD 11.2 Billion |
|
Market Forecast in 2034
|
USD 15.6 Billion |
| Market Growth Rate 2026-2034 | 3.61% |
Drilling and completion fluids are highly filtered compounds that are used for oil and gas extraction activities. Drilling fluid, or drilling mud, is usually a composite liquid that is primarily used for minimizing formation damage and transporting solids. It is manufactured using chemical, oil, mud and water, which provides hydrostatic pressure to minimize corrosion and prevent formation fluids from entering the wellbore. On the other hand, the completion fluid is composed of brines, which is a mixture of water, chlorides and bromides, and has a high pH value and ionic composition. It is highly filtered and is available in the form of oil-, water- and synthetic fluids-based and foams.
To get more information on this market Request Sample
The increasing shale gas exploration activities represent as one of the key factors driving the market growth. Furthermore, a significant increase in the drilling activities across the globe is also providing a boost to the market growth. Drilling and completion fluids aid in reducing the time to drill and enhancing the wellbore stability to maximize the recovery from the reservoir. Additionally, various technological advancements, such as the implementation of nanotechnology in the development of high-performance drilling and completion fluids, are acting as another growth-inducing factor. Nanoparticles are added to these fluids to minimize shale permeability and water loss by physically plugging nanometer-sized pores in the wellbore. Other factors, including increasing investments in onshore oil and gas industry, along with favorable government initiatives to promote the utilization of sustainable drilling fluids, are projected to drive the market further.
Key Market Segmentation:
IMARC Group provides an analysis of the key trends in each sub-segment of the global drilling and completion fluids market report, along with forecasts at the global, regional and country level from 2026-2034. Our report has categorized the market based on system type, well type, and application.
Breakup by System Type:
- Water-based System
- Oil-based System
- Synthetic Fluid-based System
- Others
Breakup by Well Type:
- HPHT (High Pressure High Temperature) Wells
- Conventional Wells
Breakup by Application:
Access the comprehensive market breakdown Request Sample
- Onshore
- Offshore
Breakup by Region:
- North America
- United States
- Canada
- Asia Pacific
- China
- Japan
- India
- South Korea
- Australia
- Indonesia
- Others
- Europe
- Germany
- France
- United Kingdom
- Italy
- Spain
- Russia
- Others
- Latin America
- Brazil
- Mexico
- Others
- Middle East and Africa
Competitive Landscape:
The competitive landscape of the industry has also been examined with some of the key players being Baker Hughes Company, CES Energy Solutions, Chevron Phillips Chemical, Drilling Fluids & Chemicals Limited, Halliburton Company, National Oilwell Varco, Inc., Newpark Resources Inc., Q'Max Solutions Inc., Sagemines, Schlumberger, Scomi Group Berhad, Secure Energy Services Inc., Tetra Technologies, Inc., Weatherford International, etc.
Report Coverage:
| Report Features | Details |
|---|---|
| Base Year of the Analysis | 2025 |
| Historical Period | 2020-2025 |
| Forecast Period | 2026-2034 |
| Units | Billion USD |
| Segment Coverage | System Type, Well Type, Application, Region |
| Region Covered | Asia Pacific, Europe, North America, Latin America, Middle East and Africa |
| Countries Covered | United States, Canada, Germany, France, United Kingdom, Italy, Spain, Russia, China, Japan, India, South Korea, Australia, Indonesia, Brazil, Mexico |
| Companies Covered | Baker Hughes Company, CES Energy Solutions, Chevron Phillips Chemical, Drilling Fluids & Chemicals Limited, Halliburton Company, National Oilwell Varco, Inc., Newpark Resources Inc., Q'Max Solutions Inc., Sagemines, Schlumberger, Scomi Group Berhad, Secure Energy Services Inc., Tetra Technologies, Inc. and Weatherford International |
| Customization Scope | 10% Free Customization |
| Post-Sale Analyst Support | 10-12 Weeks |
| Delivery Format | PDF and Excel through Email (We can also provide the editable version of the report in PPT/Word format on special request) |
Frequently Asked Questions About the Drilling and Completion Fluids Market Report
According to the estimates by IMARC Group, the global drilling and completion fluids market is expected to witness a CAGR of 3.61% from 2026-2034.
With the rising investments in shale gas exploration activities, there is a growing demand for drilling completion fluids which represents one of the key drivers for the global drilling and completion fluids market.
Rapid utilization of nanotechnology in the development of high-performance fluids represents one of the key trends in the global drilling and completion fluids market.
The market for drilling and completion fluids had experienced a negative impact on account of the sudden outbreak of COVID-19 due to the declining oil prices, restrictions in trade activities, and limited demand for oil products.
On the basis of the system type, the market has been divided into water-based system, oil-based system, synthetic fluid-based systems, and others. In this segment, water-based system accounts for the largest market share.
On the basis of the well type, the market has been bifurcated into HPHT (High Pressure High Temperature) wells and conventional wells. Currently, HPHT wells exhibit a clear dominance in the market.
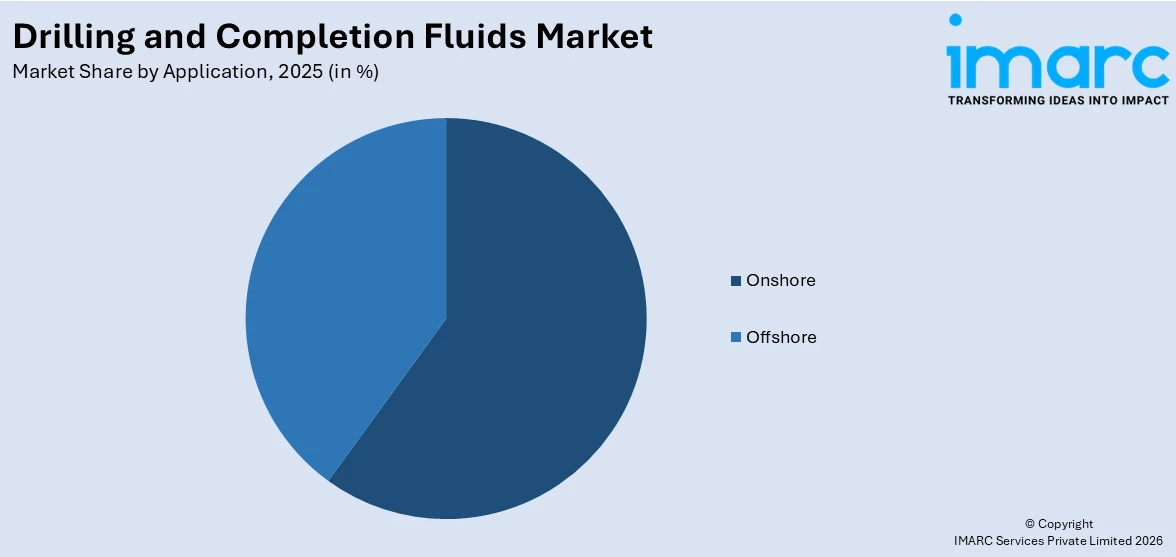
On the basis of the application, the market has been segmented into onshore and offshore. At present, onshore application represents the largest market share.
Region-wise, the market has been classified into North America, Europe, Asia Pacific, Middle East and Africa, and Latin America, where North America dominates the global market.
The key companies in the global drilling and completion fluids market are Baker Hughes Company, CES Energy Solutions, Chevron Phillips Chemical, Drilling Fluids & Chemicals Limited, Halliburton Company, National Oilwell Varco, Inc., Newpark Resources Inc., Q'Max Solutions Inc., Sagemines, Schlumberger, Scomi Group Berhad, Secure Energy Services Inc., Tetra Technologies, Inc., Weatherford International, etc.
Need more help?
- Speak to our experienced analysts for insights on the current market scenarios.
- Include additional segments and countries to customize the report as per your requirement.
- Gain an unparalleled competitive advantage in your domain by understanding how to utilize the report and positively impacting your operations and revenue.
- For further assistance, please connect with our analysts.
 Request Customization
 Speak to an Analyst
 Request Brochure
 Inquire Before Buying
Benefits of Customization
- Personalize this research
- Triangulate with your data
- Get data as per your format and definition
- Gain a deeper dive into a specific application, geography, customer, or competitor
- Any level of personalization
Get in Touch With Us
UNITED STATES
Phone: +1-201-971-6302
INDIA
Phone: +91-120-433-0800
UNITED KINGDOM
Phone: +44-753-714-6104
Email: [email protected]
Client Testimonials


.webp)


