
Dysprosium Prices, Trend, Chart, Demand, Market Analysis, News, Historical and Forecast Data Report 2026 Edition
Dysprosium Price Trend, Index and Forecast
Track real-time and historical dysprosium prices across global regions. Updated monthly with market insights, drivers, and forecasts.
Dysprosium Prices July 2026
| Region | Price (USD/KG) | Latest Movement |
|---|---|---|
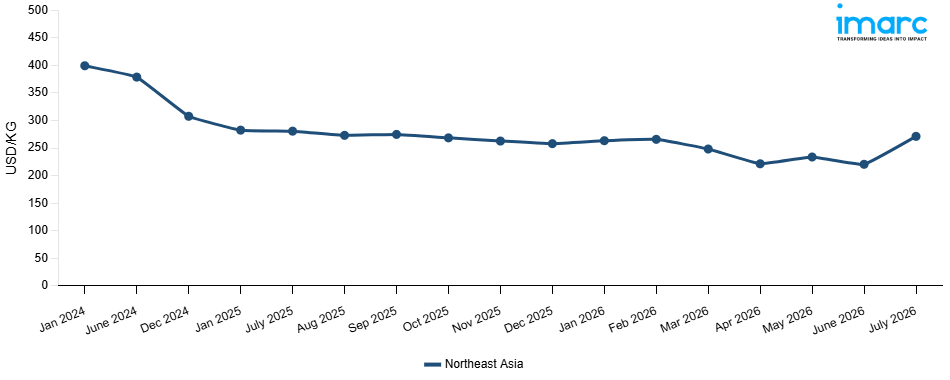
| Northeast Asia | 271.21 | 23.0% ↑ Up |
Dysprosium Price Index (USD/KG):
The chart below highlights monthly dysprosium prices across different regions.
Get Access to Monthly/Quarterly/Yearly Prices, Request Sample
Market Overview Q1 Ending March 2026
Northeast Asia: The dysprosium prices in Northeast Asia reached 248.26 USD/KG in March 2026. The downward pricing movement registered between December and March 2026 was 3.8%. Weakened demand from the permanent magnet, electric vehicle motor, and wind turbine manufacturing sectors reduced procurement activity and contributed to bearish dysprosium market conditions across Northeast Asian markets throughout the review period. Adequate domestic rare earth production from Chinese mining and separation facilities maintained a sufficient supply and exerted consistent downward pressure on prevailing regional dysprosium market rates during the quarter. Declining upstream rare earth ore extraction and separation processing costs at key domestic producing facilities reduced manufacturing expenses and eroded the cost floor supporting prevailing regional price levels. Restrained procurement strategies adopted by downstream magnet and electronics manufacturers, anticipating continued price softness, reinforced subdued restocking activity and sustained the prevailing downward pricing trajectory throughout the review period.
Market Overview Q4 Ending December 2025
Northeast Asia: The dysprosium prices in Northeast Asia reached 258.01 USD/KG in December 2025. The downward pricing movement registered between September and December 2025 was 6.1%. Weakened downstream demand from the high performance permanent magnet and electric vehicle motor manufacturing sectors, which moderated procurement volumes amid slowing production schedules and cautious inventory management strategies throughout the region, was the main cause of the notable price decline. The bearish price environment was further exacerbated by major rare earth mining and separation facilities easing supply constraints, thereby increasing processing output once production quotas were loosened. Additionally, the overall market uptake was affected by muted consumption in the industrial servo motor and wind turbine generator segments. Major buyers' strategic destocking in anticipation of ongoing price softening limited competition for purchases, and key specialty metal distributors' high inventory positions led to competitive pricing concessions, which continuously pushed prevailing market valuations lower over the course of the quarter.
Market Overview Q3 Ending September 2025
Northeast Asia: Dysprosium prices in Northeast Asia reflected steady upward momentum. The rise was largely driven by sustained demand from the electric vehicle (EV) and wind energy sectors in China, Japan, and South Korea, where dysprosium is a critical input in permanent magnets for high-efficiency motors and turbines. On the supply side, China, the world’s dominant producer of rare earths, implemented tighter environmental regulations and export controls on heavy rare earths, including dysprosium, which constrained availability. Currency fluctuations also influenced pricing, particularly the depreciation of the Japanese yen against the US dollar, which raised import costs for Japanese buyers. Logistics costs remained relatively stable. Demand-side factors remained robust. Meanwhile, Japan’s efforts to diversify supply chains, including increased procurement from Australia, had minimal impact on prices this quarter given limited global dysprosium output. Overall, the balance of strong demand, limited supply growth, and rising compliance costs kept pricing elevated in Northeast Asia throughout the quarter.
Dysprosium Price Trend, Market Analysis, and News
IMARC's latest publication, “Dysprosium Prices, Trend, Chart, Demand, Market Analysis, News, Historical and Forecast Data Report 2026 Edition,” presents a detailed examination of the dysprosium market, providing insights into both global and regional trends that are shaping prices. This report delves into the spot price of dysprosium at major ports and analyzes the composition of prices, including FOB and CIF terms. It also presents detailed dysprosium prices trend analysis by region, covering North America, Europe, Asia Pacific, Latin America, and Middle East and Africa. The factors affecting dysprosium pricing, such as the dynamics of supply and demand, geopolitical influences, and sector-specific developments, are thoroughly explored. This comprehensive report helps stakeholders stay informed with the latest market news, regulatory updates, and technological progress, facilitating informed strategic decision-making and forecasting.
Dysprosium Industry Analysis
The global dysprosium industry size reached 2.78 Thousand Tons in 2025. By 2034, IMARC Group expects the market to reach 3.38 Thousand Tons, at a projected CAGR of 2.19% during 2026-2034. The market is driven by the rising demand for high performance permanent magnets in electric vehicles and wind turbines, growing adoption of clean energy technologies, increasing electronics manufacturing, limited natural supply, and strategic government initiatives supporting rare earth element utilization.
Latest developments in the Dysprosium Industry:
- August 2025: Energy Fuels Inc. achieved a milestone by producing its first kilogram of 99.9% pure dysprosium oxide at the White Mesa Mill in Utah. This marked the first commercial-scale production of dysprosium in the US.
Product Description
Dysprosium is a chemical element with the symbol Dy and the atomic number 66. It is classified as a lanthanide in the periodic table, with a silvery-white color and a high melting point. It is known for its remarkable magnetic characteristics, which make it an essential component in a variety of high-tech applications.
One of its principal applications is in the creation of neodymium-based magnets, where dysprosium improves the material's resistance to demagnetization at high temperatures, making these magnets critical in the fabrication of wind turbines, EVs, and other modern electronics. It is also employed in the manufacturing of laser materials and commercial lighting due to its propensity to emit brilliant light.
Report Coverage
| Key Attributes | Details |
|---|---|
| Product Name | Dysprosium |
| Report Features | Exploration of Historical Trends and Market Outlook, Industry Demand, Industry Supply, Gap Analysis, Challenges, Dysprosium Price Analysis, and Segment-Wise Assessment. |
| Currency/Units | US$ (Data can also be provided in local currency) or Metric Tons |
| Region/Countries Covered | The current coverage includes analysis at the global and regional levels only. Based on your requirements, we can also customize the report and provide specific information for the following countries: Asia Pacific: China, India, Indonesia, Pakistan, Bangladesh, Japan, Philippines, Vietnam, Thailand, South Korea, Malaysia, Nepal, Taiwan, Sri Lanka, Hongkong, Singapore, Australia, and New Zealand Europe: Germany, France, United Kingdom, Italy, Spain, Russia, Turkey, Netherlands, Poland, Sweden, Belgium, Austria, Ireland, Switzerland, Norway, Denmark, Romania, Finland, Czech Republic, Portugal and Greece North America: United States and Canada Latin America: Brazil, Mexico, Argentina, Columbia, Chile, Ecuador, and Peru Middle East & Africa: Saudi Arabia, UAE, Israel, Iran, South Africa, Nigeria, Oman, Kuwait, Qatar, Iraq, Egypt, Algeria, and Morocco The list of countries presented is not exhaustive. Information on additional countries can be provided if required by the client. |
| Information Covered for Key Suppliers |
|
| Customization Scope | The report can be customized as per the requirements of the customer |
| Report Price and Purchase Option |
Plan A: Monthly Updates - Annual Subscription
Plan B: Quarterly Updates - Annual Subscription
Plan C: Biannually Updates - Annual Subscription
|
| Post-Sale Analyst Support | 360-degree analyst support after report delivery |
| Delivery Format | PDF and Excel through email (We can also provide the editable version of the report in PPT/Word format on special request) |
Key Benefits for Stakeholders:
- IMARC’s report presents a detailed analysis of dysprosium pricing, covering global and regional trends, spot prices at key ports, and a breakdown of FOB and CIF prices.
- The study examines factors affecting dysprosium price trend, including input costs, supply-demand shifts, and geopolitical impacts, offering insights for informed decision-making.
- The competitive landscape review equips stakeholders with crucial insights into the latest market news, regulatory changes, and technological advancements, ensuring a well-rounded, strategic overview for forecasting and planning.
- IMARC offers various subscription options, including monthly, quarterly, and biannual updates, allowing clients to stay informed with the latest market trends, ongoing developments, and comprehensive market insights. The dysprosium price charts ensure our clients remain at the forefront of the industry.
Frequently Asked Questions About the Dysprosium Prices Report
The dysprosium prices in July 2026 were 271.21 USD/Kg in Northeast Asia.
The dysprosium pricing data is updated on a monthly basis.
We provide the pricing data primarily in the form of an Excel sheet and a PDF.
Yes, our report includes a forecast for dysprosium prices.
The regions covered include North America, Europe, Asia Pacific, Middle East, and Latin America. Countries can be customized based on the request (additional charges may be applicable).
Yes, we provide both FOB and CIF prices in our report.
Need more help?
- Speak to our experienced analysts for insights on the current market scenarios.
- Include additional segments and countries to customize the report as per your requirement.
- Gain an unparalleled competitive advantage in your domain by understanding how to utilize the report and positively impacting your operations and revenue.
- For further assistance, please connect with our analysts.
 Request Customization
 Inquire Before Buying
 Speak to an Analyst
 Request Brochure
Benefits of Customization
- Personalize this research
- Triangulate with your data
- Get data as per your format and definition
- Gain a deeper dive into a specific application, geography, customer, or competitor
- Any level of personalization
Get in Touch With Us
UNITED STATES
Phone: +1-201-971-6302
INDIA
Phone: +91-120-433-0800
UNITED KINGDOM
Phone: +44-753-714-6104
Email: [email protected]
Client Testimonials


.webp)


Why Choose Us
IMARC offers trustworthy, data-centric insights into commodity pricing and evolving market trends, enabling businesses to make well-informed decisions in areas such as procurement, strategic planning, and investments. With in-depth knowledge spanning more than 1000 commodities and a vast global presence in over 150 countries, we provide tailored, actionable intelligence designed to meet the specific needs of diverse industries and markets.
1000
+Commodities
150
+Countries Covered
3000
+Clients
20
+Industry
Robust Methodologies & Extensive Resources
IMARC delivers precise commodity pricing insights using proven methodologies and a wealth of data to support strategic decision-making.
Subscription-Based Databases
Our extensive databases provide detailed commodity pricing, import-export trade statistics, and shipment-level tracking for comprehensive market analysis.
Primary Research-Driven Insights
Through direct supplier surveys and expert interviews, we gather real-time market data to enhance pricing accuracy and trend forecasting.
Extensive Secondary Research
We analyze industry reports, trade publications, and market studies to offer tailored intelligence and actionable commodity market insights.
Trusted by 3000+ industry leaders worldwide to drive data-backed decisions. From global manufacturers to government agencies, our clients rely on us for accurate pricing, deep market intelligence, and forward-looking insights.