
East Africa Alcoholic Beverages Market Report by Product (Beer, Wine, Spirit, and Others), Type (Flavor, Unflavored), Packaging Type (Glass Bottles, Plastic Bottles, Cans, and Others), Distribution Channel (Liquor Stores, Restaurants, Hotels, & Bar, Supermarkets and Hypermarkets, Online Retailing, and Others), and Country 2026-2034
Market Overview:
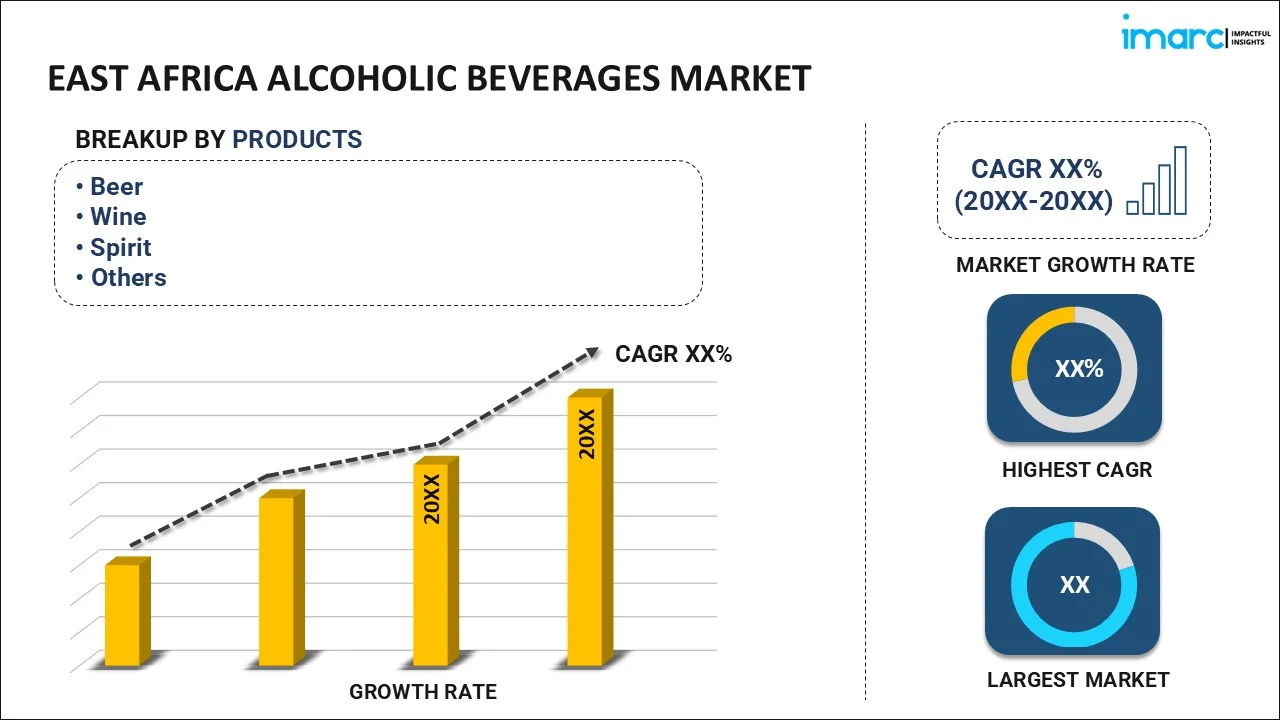
The East Africa alcoholic beverages market size reached USD 28.0 Billion in 2025. Looking forward, IMARC Group expects the market to reach USD 52.4 Billion by 2034, exhibiting a growth rate (CAGR) of 6.95% during 2026-2034.
|
Report Attribute
|
Key Statistics
|
|---|---|
|
Base Year
|
2025
|
|
Forecast Years
|
2026-2034
|
|
Historical Years
|
2020-2025
|
| Market Size in 2025 | USD 28.0 Billion |
| Market Forecast in 2034 | USD 52.4 Billion |
| Market Growth Rate 2026-2034 | 6.95% |
Access the full market insights report Request Sample
An alcoholic beverage refers to a drink prepared by mixing ethanol with fermented fruits, grains, sugar, etc. Some of the common product variants include beer, wine, rum, whiskey, brandy, vodka, gin, etc.
The elevating levels of urbanization coupled with the rising influence of western culture are propelling the demand for alcoholic beverages in the region. Furthermore, the improving consumer living standards supported by their increasing disposable income levels are also augmenting the market growth. Several regional manufacturers are introducing numerous innovative flavors catering to changing consumer tastes and preferences. Additionally, numerous brick-and-mortar alcohol shops in the region are adopting online retail platforms for increasing their product sales and reaching out to a larger consumer base. Moreover, the growing penetration of several international key players has led to the introduction of premium products in the regional market. In line with this, the rising investments by these foreign brands in expanding their market presence through local distributors and subsidiaries are also bolstering the market growth in the region.
Key Market Segmentation:
IMARC Group provides an analysis of the key trends in each sub-segment of the East Africa alcoholic beverages market report, along with forecasts at the regional and country level from 2026-2034. Our report has categorized the market based on product, type, packaging type and distribution channel.
Breakup by Product:
To get detailed segment analysis of this market Request Sample
- Beer
- Wine
- Spirit
- Others
Breakup by Type:
- Flavor
- Unflavored
Breakup by Packaging Type:
- Glass Bottles
- Plastic Bottles
- Cans
- Others
Breakup by Distribution Channel:
- Liquor Stores
- Restaurants, Hotels, & Bar
- Supermarkets and Hypermarkets
- Online Retailing
- Others
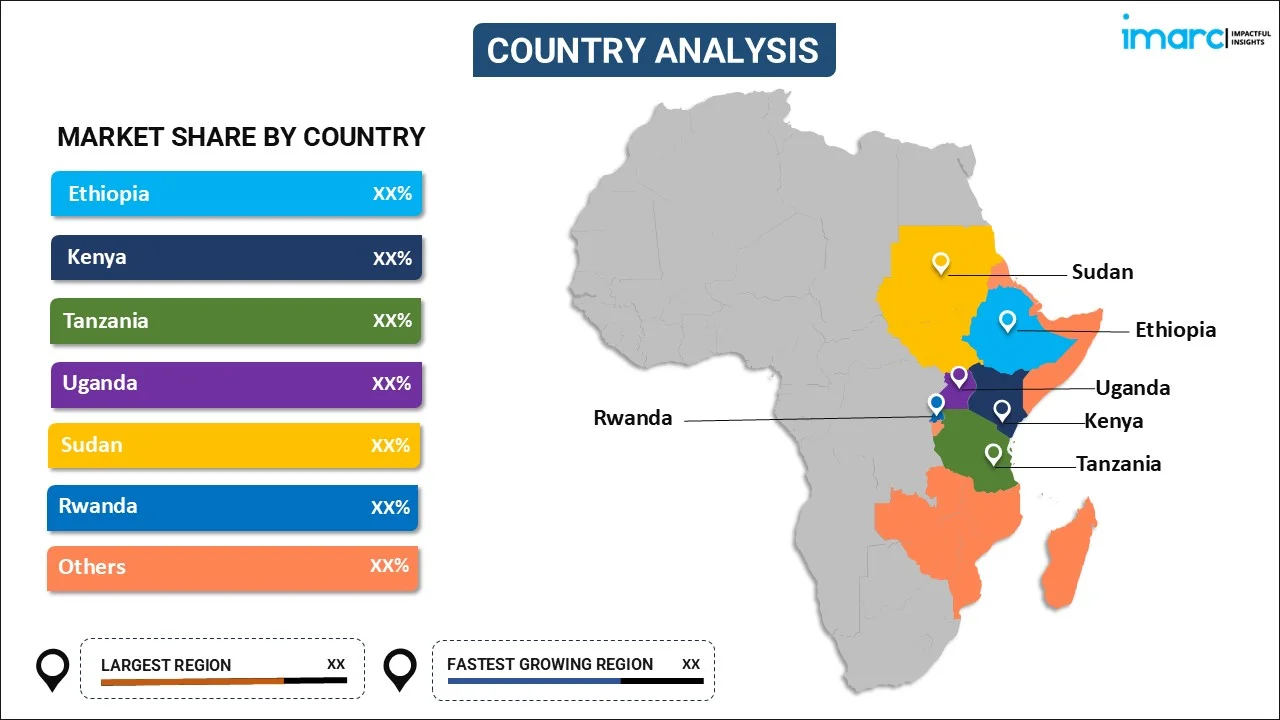
Breakup by Country:
To get detailed regional analysis of this market Request Sample
- Ethiopia
- Kenya
- Tanzania
- Uganda
- Sudan
- Rwanda
- Others
Competitive Landscape:
The competitive landscape of the industry has also been examined with some of the keyplayers being Africa Spirits Limited (ASL), Diageo, EABL, ELLE KENYA, Kenya Wine Agencies Limited, Nile Breweries Ltd.,Tanzania Breweries Limited and Vinepack Ltd.
Report Coverage:
| Report Features | Details |
|---|---|
| Base Year of the Analysis | 2025 |
| Historical Period | 2020-2025 |
| Forecast Period | 2026-2034 |
| Units | Billion USD, Million Hectoliters |
| Segment Coverage | Product, Type, Packaging Type, Distribution Channel, Country |
| Countries Covered | Ethiopia, Kenya, Tanzania, Uganda, Sudan, Rwanda, Others |
| Companies Covered | Africa Spirits Limited (ASL), Diageo, EABL, ELLE KENYA, Kenya Wine Agencies Limited, Nile Breweries Ltd.,Tanzania Breweries Limited and Vinepack Ltd. |
| Customization Scope | 10% Free Customization |
| Post-Sale Analyst Support | 10-12 Weeks |
| Delivery Format | PDF and Excel through Email (We can also provide the editable version of the report in PPT/Word format on special request) |
Key Questions Answered in This Report:
- How has the East Africa alcoholic beverages market performed so far and how will it perform in the coming years?
- What are the major countries in the East Africa alcoholic beverages market?
- What is the impact of COVID-19 on the East Africa alcoholic beverages market?
- What is the breakup of the market based on the product?
- What is the breakup of the market based on the type?
- What is the breakup of the market based on the packaging type?
- What is the breakup of the market based on the distribution channel?
- What are the various stages in the value chain of the industry?
- What are the key driving factors and challenges in the market?
- What is the structure of the East Africa alcoholic beverages market and who are the key players?
- What is the degree of competition in the market?
Need more help?
- Speak to our experienced analysts for insights on the current market scenarios.
- Include additional segments and countries to customize the report as per your requirement.
- Gain an unparalleled competitive advantage in your domain by understanding how to utilize the report and positively impacting your operations and revenue.
- For further assistance, please connect with our analysts.
 Request Customization
 Speak to an Analyst
 Request Brochure
 Inquire Before Buying
Benefits of Customization
- Personalize this research
- Triangulate with your data
- Get data as per your format and definition
- Gain a deeper dive into a specific application, geography, customer, or competitor
- Any level of personalization
Get in Touch With Us
UNITED STATES
Phone: +1-201-971-6302
INDIA
Phone: +91-120-433-0800
UNITED KINGDOM
Phone: +44-753-714-6104
Email: [email protected]
Client Testimonials


.webp)


