
Edge Computing Market Size, Share, Trends and Forecast by Component, Organization Size, Vertical, and Region, 2026-2034
Global Edge Computing Market Size, Share, Trends & Forecast (2026-2034)
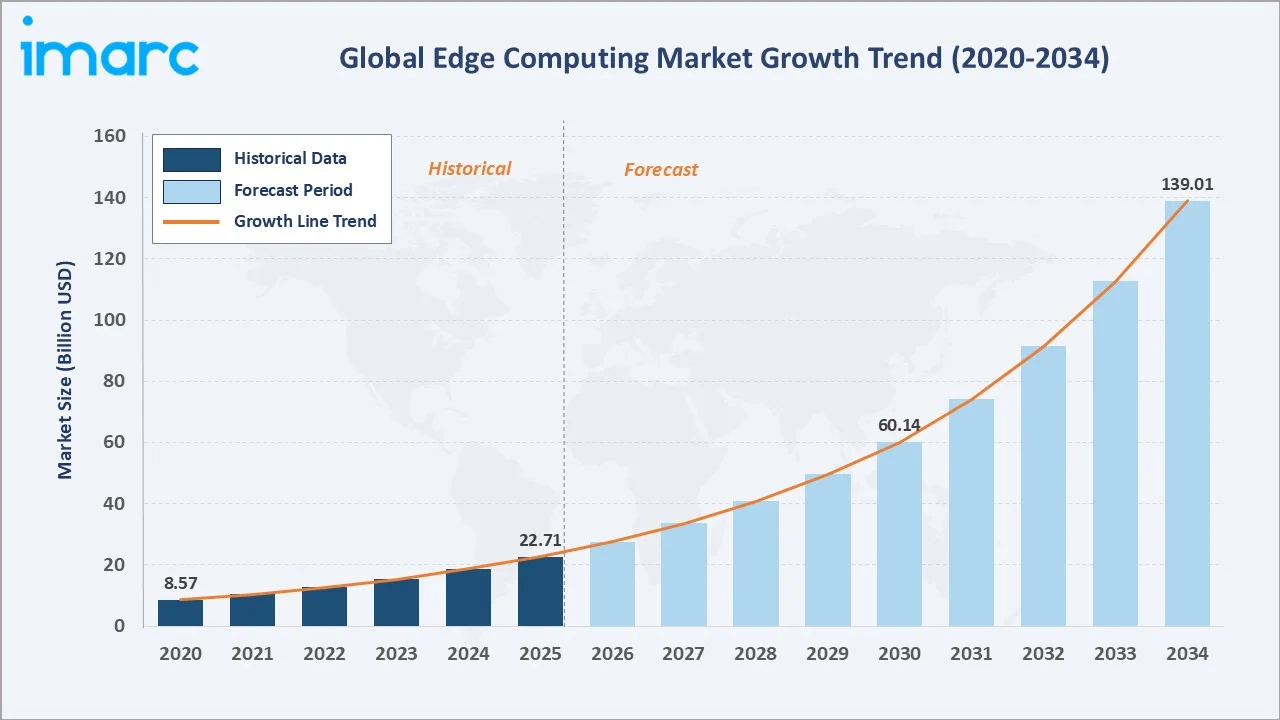
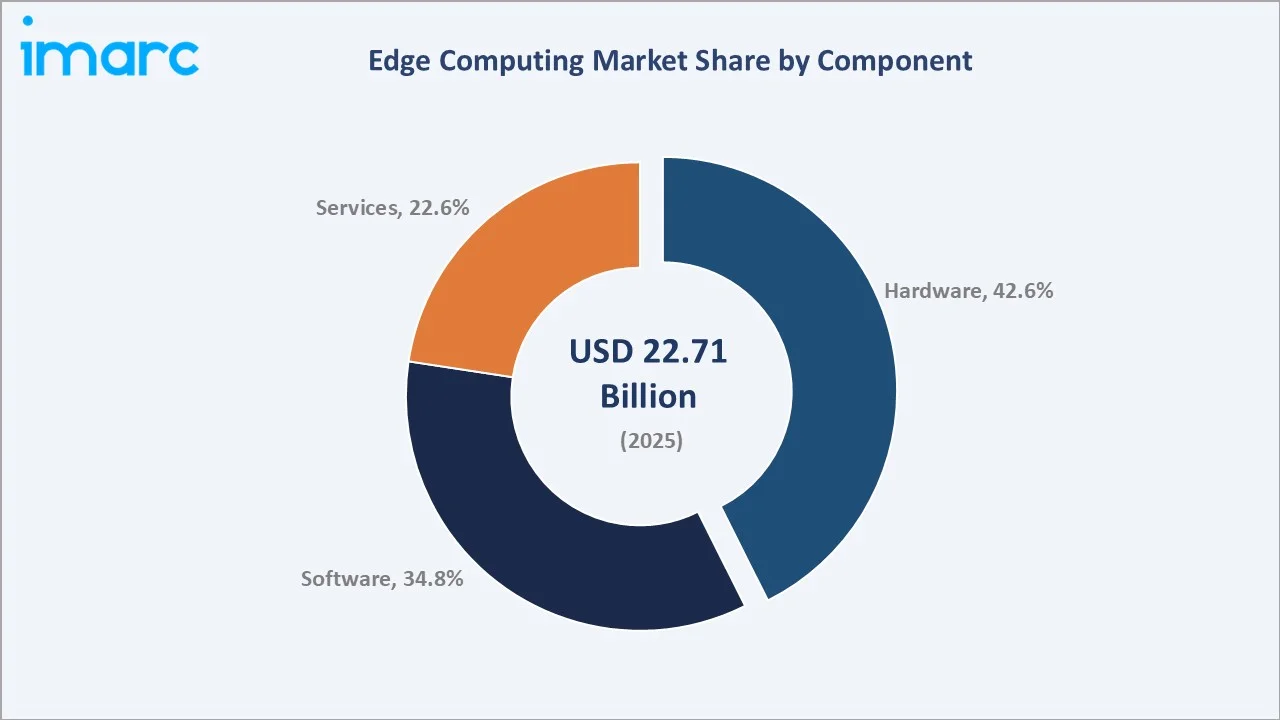
The global edge computing market size was valued at USD 22.71 Billion in 2025 and is projected to reach USD 139.01 Billion by 2034, exhibiting a CAGR of 21.51% during the forecast period 2026-2034. The explosive growth of connected devices, rapid 5G rollouts, surging demand for low-latency processing, and the rising adoption of AI inference at the edge are driving the edge computing market growth. Hardware leads the component segment at 42.6% in 2025, while Large Enterprises dominate the organisation size segment at 61.3%. North America accounts for 34.7% of global revenue in 2025, the world's largest regional market.
Market Snapshot
|
Metric |
Value |
|
Market Size (2025) |
USD 22.71 Billion |
|
Forecast Market Size (2034) |
USD 139.01 Billion |
|
CAGR (2026-2034) |
21.51% |
|
Base Year |
2025 |
|
Historical Period |
2020-2025 |
|
Forecast Period |
2026-2034 |
|
Largest Region |
North America (34.7% share, 2025) |
|
Fastest Growing Region |
Asia Pacific (CAGR ~24.6%) |
|
Leading Component Segment |
Hardware (42.6%, 2025) |
|
Leading Organisation Size |
Large Enterprises (61.3%, 2025) |
The global edge computing market trajectory from 2020 through 2034 shows a steep expansion from USD 8.57 Billion in 2020 to USD 22.71 Billion in 2025, followed by an accelerating forecast curve that reaches USD 60.14 Billion by 2030 and USD 139.01 Billion by 2034, driven by enterprise digital transformation and AI-native edge workloads.
To get more information on this market, Request Sample
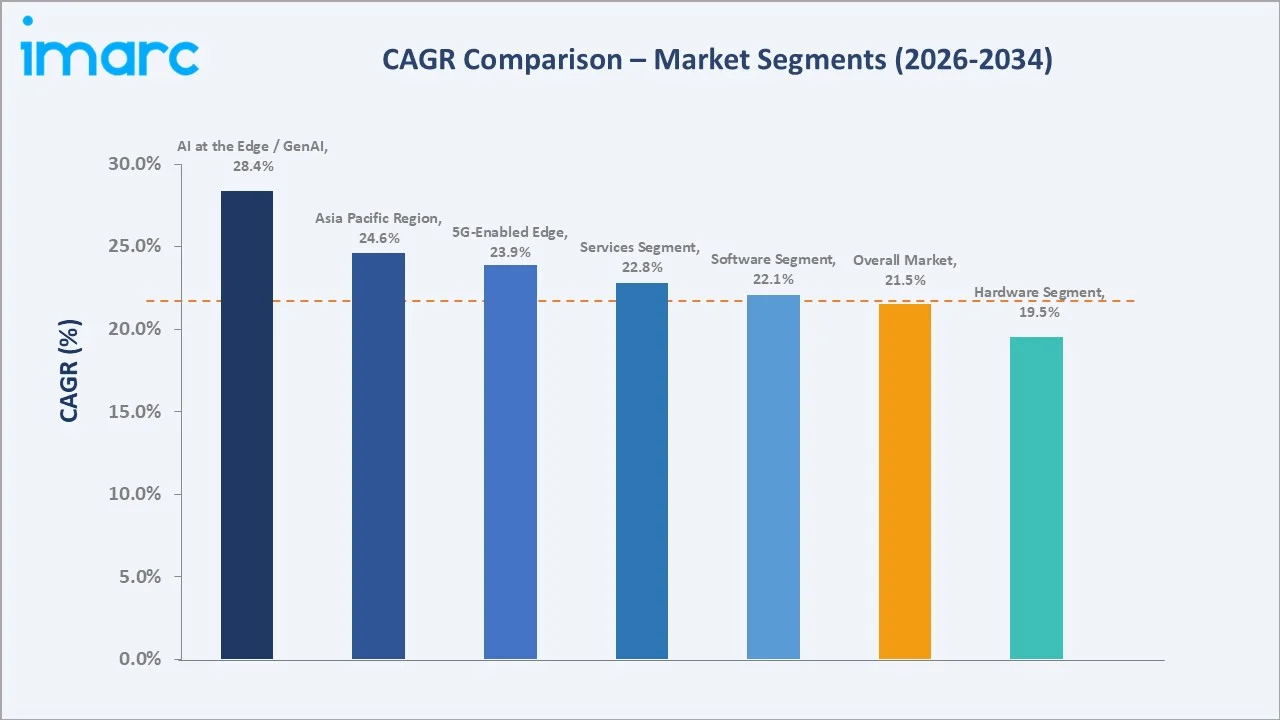
Segment-level CAGR comparisons highlight AI at the Edge and Asia Pacific as the fastest-growing pockets within the global edge computing industry analysis through 2034, with the software segment outpacing hardware due to platform monetisation models.
Executive Summary
The global edge computing market is undergoing rapid structural expansion, driven by the convergence of 5G deployment, the proliferation of IoT devices, and the shift of AI inference workloads closer to data sources. Valued at USD 22.71 Billion in 2025, the market is projected to reach USD 139.01 Billion by 2034 at a CAGR of 21.51%. Worldwide connected IoT devices are forecast to reach 39 billion by 2030, and every latency-sensitive use case, from autonomous vehicles to predictive maintenance, is pulling compute out of the centralised cloud and into regional, metro, and on-premise edge nodes.
Hardware commands a 42.6% component share in 2025, led by edge servers, gateways, and specialised AI accelerators from Intel, NVIDIA, and AMD. Software at 34.8% is the fastest-growing component category, fuelled by edge orchestration, Kubernetes-based platforms, and AI model-serving frameworks. Services account for 22.6%, covering integration, managed edge, and consulting engagements. Large Enterprises hold 61.3% of the 2025 market, reflecting the capital intensity of industrial and telco edge deployments.
North America leads with a 34.7% global revenue share in 2025, anchored by hyperscale cloud providers AWS, Microsoft, and Google, alongside dominant hardware vendors Dell, HPE, and Cisco. Asia Pacific follows at 29.3% and is the fastest-growing region, driven by China's 5G ubiquity, India's digital public infrastructure rollout, and Japan's industrial edge investments. Europe holds 22.6%, supported by sovereign cloud initiatives and GDPR-driven data localisation.
Key Market Insights
|
Insight |
Data |
|
Largest Component Segment |
Hardware – 42.6% share (2025) |
|
Largest Organisation Size |
Large Enterprises – 61.3% share (2025) |
|
Leading Region |
North America – 34.7% revenue share (2025) |
|
Fastest-Growing Region |
Asia Pacific – 29.3% share in 2025, ~24.6% CAGR |
|
Top Companies |
Amazon Web Services, Inc., Microsoft, Hewlett Packard Enterprise Development LP, Cisco Systems, Inc., Dell Inc., Google Cloud, NVIDIA Corporation, IBM Corporation, Intel Corporation, Huawei Technologies Co., Ltd. |
Key Analytical Observations Supporting the Above Data:
- Hardware's 42.6% dominance in 2025 reflects the capital-intensive build-out of edge servers, AI accelerator cards, and ruggedised gateways, with NVIDIA GPUs and Intel Xeon-D platforms anchoring most enterprise deployments.
- Large Enterprises' 61.3% share in 2025 is powered by telco, manufacturing, healthcare, and financial services verticals, where edge deployments often exceed USD 10 Million per programme and require dedicated sovereign infrastructure.
- North America's 34.7% global share in 2025 is underpinned by the concentration of hyperscale operators, the CHIPS Act-funded AI compute build-out, and aggressive 5G and private 5G rollouts across the US manufacturing base.
Global Edge Computing Market Overview
Edge computing is a distributed computing architecture that processes data near its point of generation, rather than routing it to centralised cloud data centres. The model reduces latency, conserves bandwidth, supports real-time decision-making, and enables compliance with data-residency regulations. Core components include edge servers, IoT gateways, micro-data-centres, 5G Multi-Access Edge Compute (MEC) nodes, and on-device AI accelerators.
Applications span manufacturing (predictive maintenance, quality control), telecommunications (MEC, network slicing), automotive (autonomous vehicles, V2X), healthcare (remote monitoring, imaging AI), retail (smart stores, checkout-free), and energy (smart grids). Macroeconomic enablers include more than 2.25 billion global 5G connections in 2024, projected IoT device counts to reach 39 billion by 2030, and the rapid productization of generative AI models that demand distributed inference capacity.
Market Dynamics
To evaluate market opportunities, Request Sample
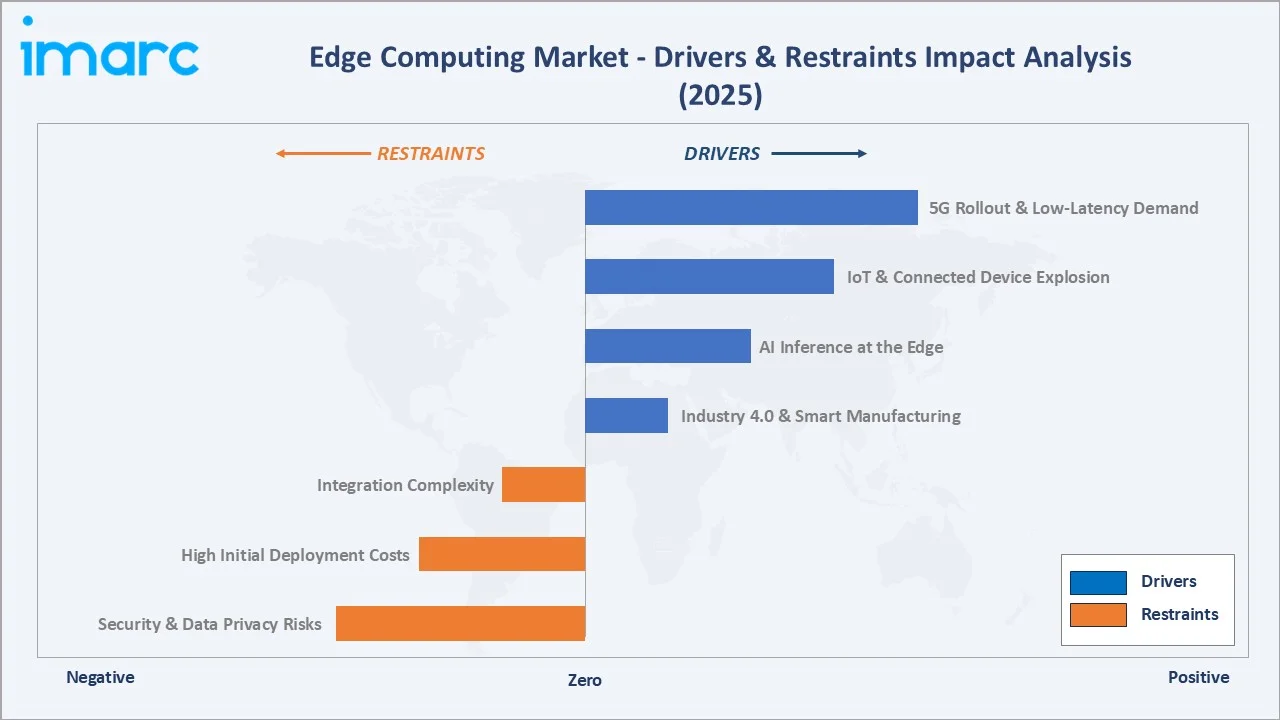
Market Drivers
- 5G Rollout and Low-Latency Demand: Global 5G connections surpassed 2.25 billion in 2024, with China, the US, South Korea, and Japan leading global deployments by the end of 2025, creating structural demand for MEC nodes that process traffic closer to the user.
- IoT and Connected Device Explosion: The global installed base of connected IoT devices is projected to reach 39 billion by 2030, each generating telemetry that is bandwidth-prohibitive to route to the cloud and is therefore increasingly processed at edge nodes.
- AI Inference at the Edge: Generative AI and computer vision workloads are increasingly deployed at edge nodes to protect data privacy, reduce cloud egress costs, and meet real-time performance requirements. NVIDIA's January 2025 Cosmos platform and Jetson AGX modules have accelerated this shift.
- Industry 4.0 and Smart Manufacturing: Smart factory deployments depend on millisecond-scale process control, computer vision, and digital twins, all of which require edge computing. Global spending on Industry 4.0 technologies projected to reach USD 862 Billion by 2032.
Market Restraints
- Security and Data Privacy Risks: Distributed edge nodes expand the attack surface significantly, and the majority of enterprises cite edge security as their top concern.
- High Initial Deployment Costs: Production-grade enterprise edge node deployments carry significant upfront hardware and infrastructure costs, with multi-site rollouts creating substantial budget friction.
- Integration Complexity: Integrating edge workloads with existing cloud, on-premise, and OT systems requires substantial systems integration effort, with implementation timelines often stretching months for enterprise-wide programmes.
Market Opportunities
- Sovereign Edge and Data Localisation: GDPR, NIS2, and emerging data-sovereignty laws in India, Brazil, and the Middle East are creating a new enterprise edge category focused on in-country data residency.
- Edge-Native Software-as-a-Service: Platform providers are monetising edge through subscription SaaS – Azure Local, AWS Outposts, and Google Distributed Cloud Edge are transforming one-time hardware sales into recurring revenue streams that expand gross margins materially.
- Autonomous Systems and Digital Twins: Autonomous vehicles, drones, and robotics require deterministic millisecond-scale response times that only the edge can deliver. Digital twin deployments for factories and cities were projected to exceed 500 installations globally by 2025.
Market Challenges
- Skills Gap in Edge Operations: Managing distributed edge fleets demands skills spanning cloud, networking, and OT systems; the talent pool of experienced edge engineers is constrained globally, raising labour costs.
- Hardware Refresh Cycles: Rapid evolution of AI accelerators and silicon designs shortens the useful lives of edge hardware, increasing the total cost of ownership and complicating capital planning for enterprise IT.
- Interoperability and Standards Fragmentation: Competing edge orchestration frameworks, proprietary APIs from hyperscalers, and a lack of universal edge-native standards create lock-in risks and limit workload portability across providers.
Emerging Market Trends
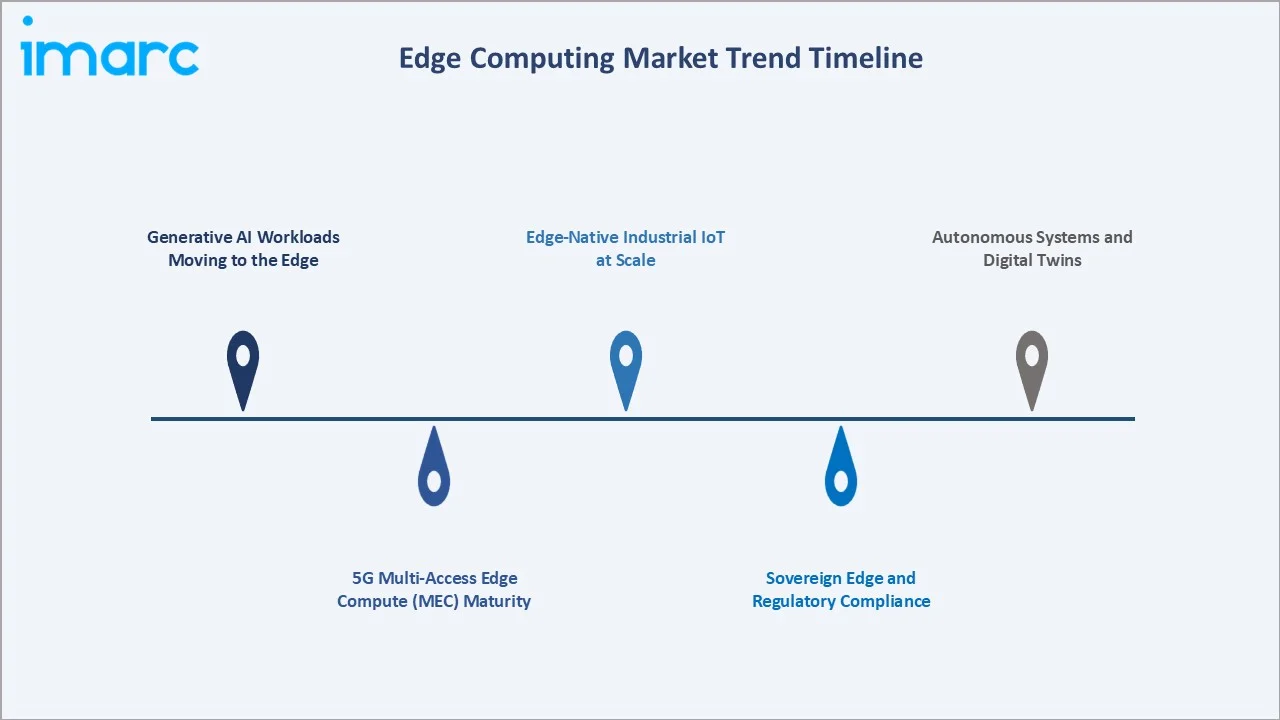
1. Generative AI Workloads Moving to the Edge
Large language models and computer vision models are increasingly deployed at edge nodes to preserve privacy, cut cloud egress costs, and meet latency SLAs. NVIDIA's January 2025 Cosmos platform and November 2025 Jetson AGX modules mark the decisive shift of generative AI workloads from cloud-only to hybrid cloud-edge.
2. 5G Multi-Access Edge Compute (MEC) Maturity
Telcos are commercialising 5G MEC as a revenue-bearing product beyond connectivity. AWS Wavelength, Azure Edge Zones, and Google Distributed Cloud Edge are embedded in carrier networks from AT&T, Verizon, and Vodafone, enabling sub-20 millisecond application latency for enterprise customers.
3. Sovereign Edge and Regulatory Compliance
Data-residency laws, including GDPR, EU Data Act, India's DPDP Act, and China's PIPL are creating demand for in-country sovereign edge deployments. Microsoft's November 2024 Azure Local rebrand signals hyperscaler investment in sovereign-edge product lines for regulated industries.
4. Edge-Native Industrial IoT at Scale
Manufacturing is the single largest enterprise edge vertical. AWS's Siemens partnership, Dell's Singapore Edge Innovation Center, and Cisco's June 2025 AI/ML edge server launches collectively illustrate the transition from pilot deployments to factory-wide rollouts across Tier-1 OEMs.
5. Autonomous Systems and Digital Twins
Autonomous vehicles, robotics, and digital-twin simulations require deterministic edge compute with sub-millisecond response envelopes. Cisco's edge networking platform for autonomous vehicles and HPE-KDDI's Osaka Sakai AI Data Center exemplify infrastructure investment aligned to this workload class.
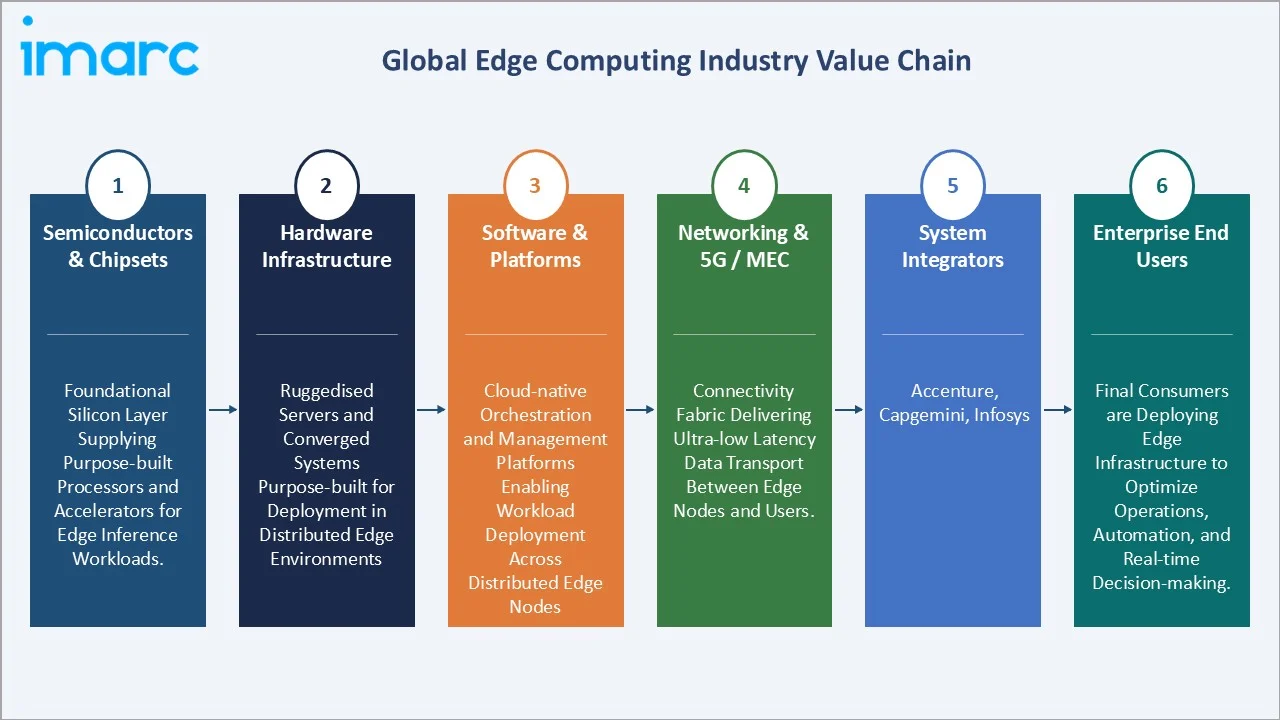
Industry Value Chain Analysis
The edge computing value chain spans six integrated stages from semiconductor supply through enterprise end-user deployment. Each stage presents distinct margin profiles, competitive dynamics, and strategic investment requirements.
|
Stage |
Key Players / Examples |
|
Semiconductors & Chipsets |
Foundational silicon layer supplying purpose-built processors and accelerators for edge inference workloads. |
|
Hardware Infrastructure |
Ruggedised servers and converged systems purpose-built for deployment in distributed edge environments. |
|
Software & Platforms |
Cloud-native orchestration and management platforms enabling workload deployment across distributed edge nodes. |
|
Networking & 5G / MEC |
Connectivity fabric delivering ultra-low latency data transport between edge nodes and users. |
|
System Integrators |
Translate edge technology stacks into industry-specific, production-ready solutions for enterprise customers. |
|
Enterprise End Users |
Final consumers are deploying edge infrastructure to optimise operations, automation, and real-time decision-making. |
Hardware infrastructure vendors and hyperscale platforms occupy the highest strategic value positions. HPE's 2024 Juniper Networks acquisition was driven by intense competition and consolidation activity at the upper value chain tiers.
Technology Landscape in the Edge Computing Industry
Compute and AI Acceleration
NVIDIA dominates the edge AI accelerator market through its Jetson, Orin, and 2025 Cosmos platforms, with Intel's Gaudi, AMD's Instinct MI-series, and specialised vendors like Hailo and Ambarella providing alternatives. Compute at the edge is moving from CPU-only to GPU-and-NPU architectures capable of 100+ TOPS inference performance.
Platform and Orchestration Software
Kubernetes-based orchestration has become the de facto standard, with Red Hat OpenShift, Rancher (SUSE), and native-hyperscaler platforms (AWS Outposts, Azure Local, Google Distributed Cloud Edge) competing on developer experience and hybrid management capabilities. Service-mesh and GitOps tooling are maturing rapidly.
Connectivity: 5G, Wi-Fi 6/7, and Private Networks
5G MEC, Wi-Fi 6E, and private 5G networks are converging to create the connectivity fabric for enterprise edge. By 2026, 95 operators worldwide had commercially launched 5G Standalone services, the architectural foundation for Multi-Access Edge Compute and network slicing.
Market Segmentation Analysis
The report covers the following segments:
|
Segment Category |
Leading Segment |
Market Share |
Year |
| Component | Hardware |
42.6% |
2025 |
| Organization Size | Large Enterprises |
61.3% |
2025 |
| Vertical | Energy and Utilities |
🔒 |
2025 |
|
Region |
North America |
34.7% |
2025 |

By Component
Hardware commands a 42.6% share in 2025, encompassing edge servers, gateways, AI accelerator cards, storage systems, and networking equipment. Dell, HPE, and Lenovo anchor general-purpose edge infrastructure, while NVIDIA, Intel, and AMD lead in AI accelerator silicon for edge deployments.
To access detailed market analysis, Request Sample
Software at 34.8% in 2025 covers edge orchestration platforms, AI model serving frameworks, management and monitoring tools, and security software. Services at 22.6% include integration, consulting, and managed edge offerings delivered by Accenture, Capgemini, and the Big Four consultancies alongside hyperscaler professional services teams.
By Organisation Size
Large Enterprises lead with 61.3% in 2025, reflecting the capital intensity of telco MEC rollouts, factory-wide Industry 4.0 deployments, and healthcare/financial services digital transformation programmes that often exceed USD 10 Million per engagement.
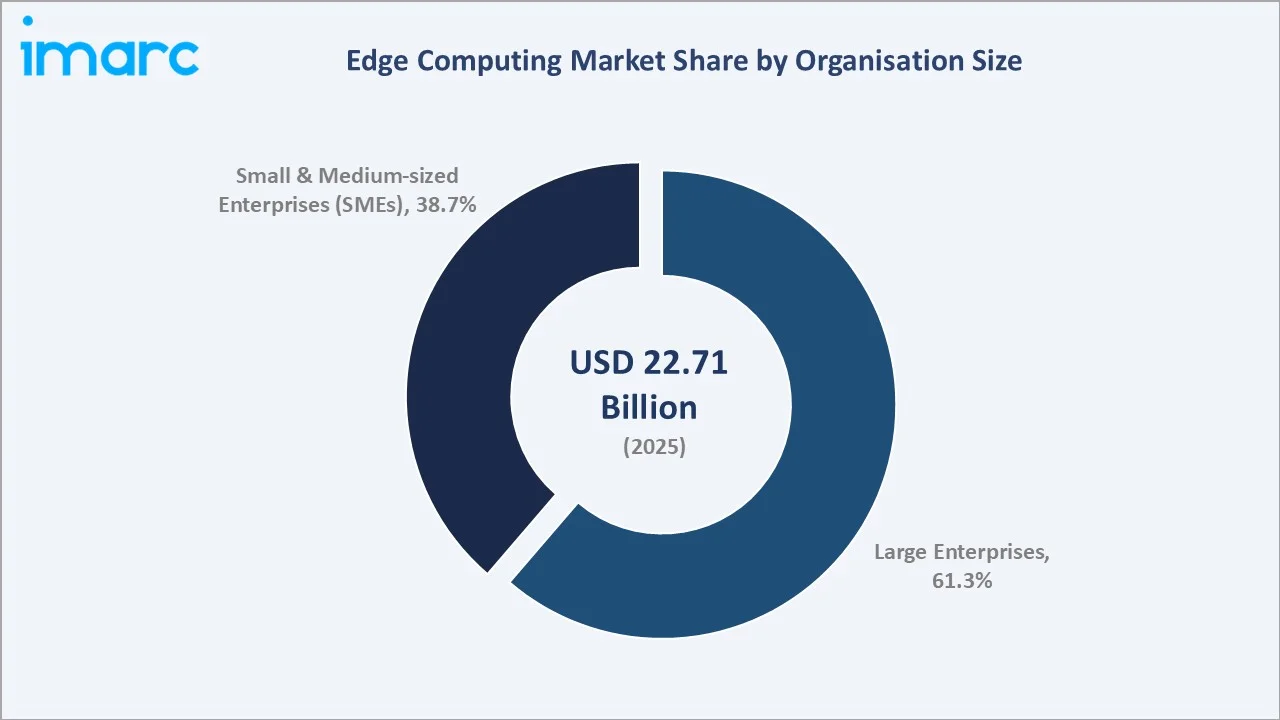
Small and Medium-sized Enterprises (SMEs) account for 38.7% in 2025, enabled by hyperscaler edge services including AWS Local Zones and Azure Edge Zones. The SME segment is projected to grow, outpacing large enterprises as subscription-based edge services lower entry barriers.
Regional Market Insights
|
Region |
Share (2025) |
Key Growth Drivers |
|
North America |
34.7% |
Hyperscale cloud dominance (AWS, Azure, GCP), CHIPS Act AI infrastructure, 5G/private 5G, AI capex |
|
Asia Pacific |
29.3% |
China 5G leadership, India DPI rollout, Japan Industry 5.0, Korea smart factories, ASEAN growth |
|
Europe |
22.6% |
GDPR data sovereignty, EU Data Act, sovereign edge investments, Industry 4.0 in DACH region |
|
Latin America |
7.4% |
Brazil and Mexico manufacturing digitalisation, retail edge deployments, growing telco MEC |
|
Middle East & Africa |
6.0% |
Saudi Vision 2030, UAE smart city programmes, South Africa financial services edge adoption |
North America commands a 34.7% global revenue share in 2025, led by the United States, which hosts AWS, Microsoft, Google Cloud, Dell, HPE, Cisco, and NVIDIA, effectively the entire hyperscale-plus-hardware value chain. The US edge computing market is further fuelled by the CHIPS Act's more than USD 395 Billion in announced semiconductor investment and by enterprise AI capex exceeding USD 300 Billion in 2025 alone.
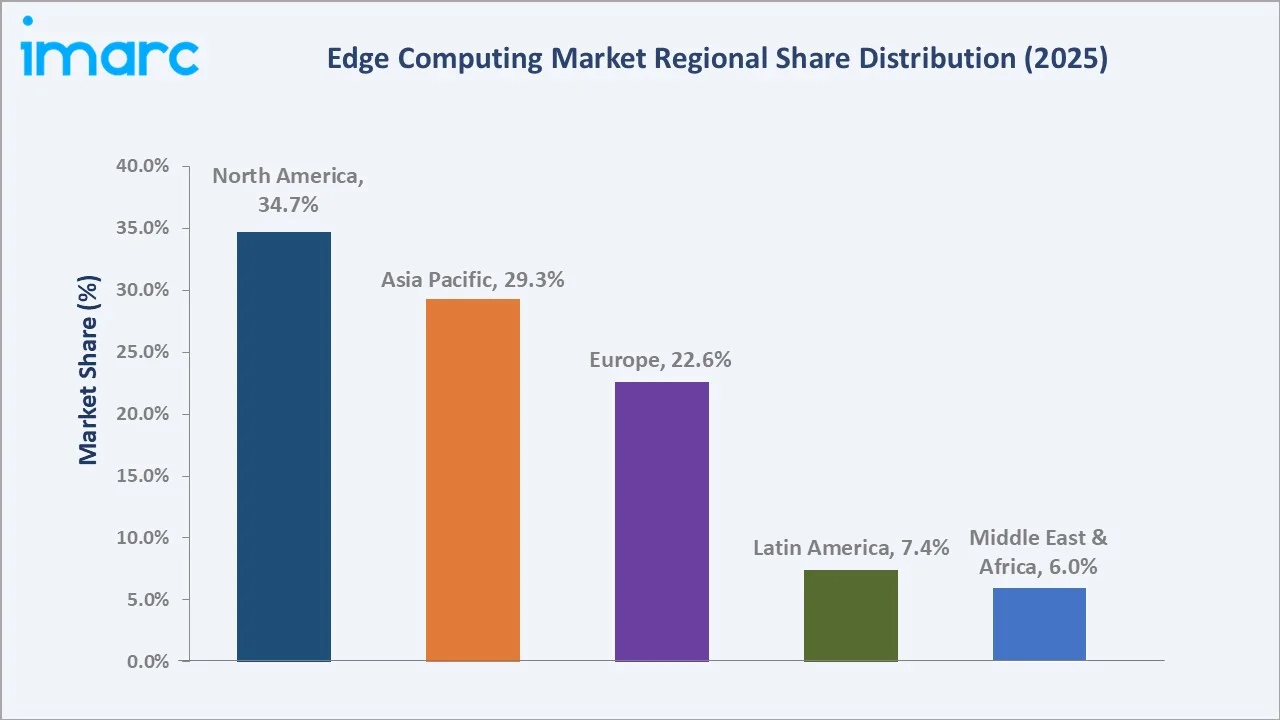
Asia Pacific accounts for 29.3% in 2025 and is the fastest-growing region. China leads the region with over 3 million 5G base stations deployed by the end of 2025, enabling nationwide MEC services. India's Digital Public Infrastructure is generating unprecedented edge data volumes, while Japan's Industry 5.0 programmes and South Korea's smart factory initiatives are scaling enterprise edge adoption.
Europe holds 22.6% in 2025, anchored by GDPR-driven data-sovereignty requirements and EU Data Act implementation. Latin America at 7.4% and Middle East & Africa at 6.0% remain smaller but feature high-growth pockets around Brazil's manufacturing, Saudi Arabia's Vision 2030, and the UAE's smart city programmes.
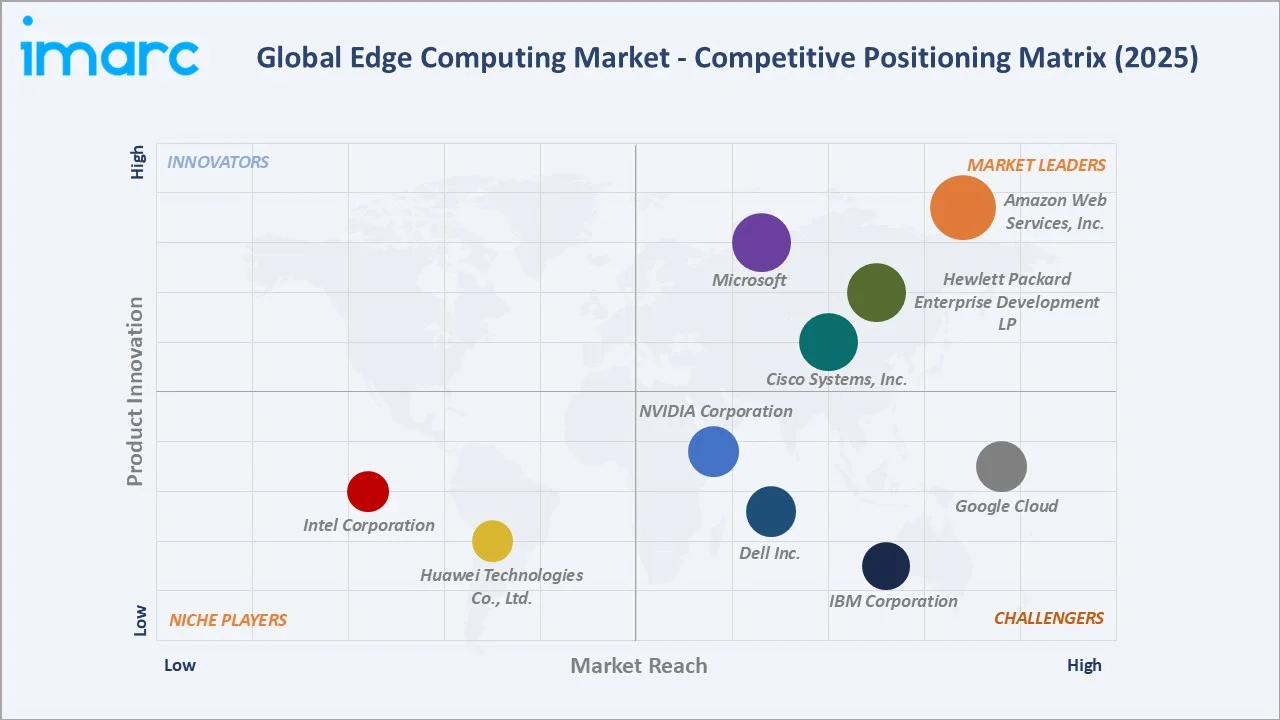
Competitive Landscape
|
Company Name |
Key Platform / Brand |
Position |
Core Strength |
|
Amazon Web Services, Inc. |
AWS Outposts and Wavelength |
Leader |
Hyperscale edge, IoT Greengrass, Local Zones, Snow |
|
Microsoft |
Azure Local and Edge Zones |
Leader |
Hybrid edge, Azure Arc, Kubernetes integration |
|
Hewlett Packard Enterprise Development LP |
HPE Edgeline and Aruba |
Leader |
Converged edge infra, networking, post-Juniper |
|
Cisco Systems, Inc. |
Cisco Unified Edge |
Leader |
Networking, secure edge, AI/ML edge servers |
|
Dell Inc. |
Dell NativeEdge |
Challenger |
Modular edge infra, Edge Gateway 5000 series |
|
Google Cloud |
Google Distributed Cloud Edge |
Challenger |
AI/ML workloads, Anthos hybrid orchestration |
|
NVIDIA Corporation |
Jetson, Cosmos, RTX Pro |
Challenger |
Edge AI accelerators, industrial reference architectures |
|
IBM Corporation |
IBM Edge Computing Solutions |
Challenger |
Enterprise AI, hybrid cloud edge, Red Hat OpenShift |
|
Intel Corporation |
OpenVINO, Tiber Edge |
Emerging |
Edge silicon, AI inference, reference platforms |
|
Huawei Technologies Co., Ltd. |
Huawei Atlas, CloudEngine |
Emerging |
Strong in China/APAC, telco MEC, industrial IoT |
The edge computing competitive landscape is moderately consolidated at the top. The seven largest suppliers, including AWS, HPE, Microsoft, Cisco, Dell, NVIDIA, and Intel, collectively accounted for approximately 37% of global market revenue in 2025.
Key Company Profiles
Amazon Web Services, Inc.
AWS is the global market leader in cloud and edge computing, a subsidiary of Amazon.com headquartered in Seattle, Washington. AWS operates the world's largest edge network through Local Zones, Wavelength, and Outposts.
- Product & Platform Portfolio: AWS Outposts (on-premises racks), AWS Wavelength (5G MEC), AWS Local Zones (metro edge), AWS IoT Greengrass (device edge), and AWS Snow Family (ruggedised edge).
- Recent Developments: In March 2025, AWS and Siemens expanded their industrial collaboration by incorporating Siemens Industrial Edge into the AWS Industrial Data Fabric solutions library.
- Strategic Focus: AWS's strategy centres on extending cloud-native developer experience to every edge location through Outposts, Wavelength, and Local Zones.
Microsoft
Microsoft is a global technology leader headquartered in Redmond, Washington. Azure is Microsoft's hyperscale cloud platform, and the company is a pioneer of hybrid cloud-edge computing through Azure Stack and Azure Arc.
- Product & Platform Portfolio: Azure Local (rebranded Azure Stack HCI), Azure Edge Zones, Azure Arc, Azure IoT Edge, Azure Stack Edge, and Azure Private MEC for 5G.
- Recent Developments: In November 2024, Microsoft rebranded Azure Stack HCI to Azure Local, unifying its distributed infrastructure portfolio under a single 'Local' brand.
- Strategic Focus: Microsoft's strategy prioritises hybrid cloud-edge as a single operating model, deep Kubernetes integration, and AI model deployment at the edge through Azure OpenAI on Azure Local.
Hewlett Packard Enterprise Development LP
HPE is a Houston-headquartered enterprise technology provider. HPE is a long-standing leader in edge infrastructure through its Edgeline converged systems and Aruba networking portfolio.
- Product & Platform Portfolio: HPE Edgeline converged edge systems, Aruba Networking (wireless/SD-WAN), Aruba Central, HPE GreenLake for edge, and post-acquisition Juniper Networks AI-driven networking.
- Recent Developments: In May 2025, HPE launched the Aruba Networking CX 10040 distributed services switch powered by AMD DPUs.
- Strategic Focus: HPE's strategy emphasises edge-to-cloud unified architecture through GreenLake's consumption model, strengthened by Juniper's Mist AI networking and the Axis Security and Morpheus Data acquisitions for secure access and multi-cloud orchestration.
Market Concentration Analysis
The global edge computing market exhibits moderate concentration at the top. The largest suppliers, including AWS, HPE, Microsoft, Cisco, Dell, NVIDIA, and Intel collectively held approximately 37% of global market revenue in 2025.
The market structure is bifurcated. At the hyperscale-platform tier, AWS, Microsoft, and Google operate in an effective oligopoly, combining global reach, developer mindshare, and deep integration with central cloud regions. This tier is consolidating further through strategic partnerships with telcos and sovereign cloud initiatives that require massive capital commitments.
At the hardware and specialised platform tier, the market is more fragmented. HPE, Dell, Cisco, and Lenovo compete with emerging players including Supermicro, Inspur, and specialised edge-only vendors like Vapor IO, StackPath, and Fastly. Venture-backed startups targeting AI-native edge orchestration and vertical-specific edge solutions are introducing competitive pressure at the innovation frontier, while Chinese domestic suppliers dominate APAC markets through Huawei and Inspur.
Investment & Growth Opportunities
Fastest-Growing Segments
AI at the Edge is the single fastest-growing sub-segment through 2034, driven by generative AI and computer vision workload deployment. Asia Pacific represents the largest geographic growth opportunity, while 5G-enabled edge services offer a distinct revenue pool for telcos and hyperscalers.
Emerging Market Expansion
Sovereign edge solutions for regulated industries, edge-native SaaS on Azure Local and AWS Outposts, industrial IoT platform consolidation, and autonomous systems / digital twins represent the most attractive emerging opportunity categories. India's digital public infrastructure ecosystem and Gulf Cooperation Council smart city programmes are creating significant regional pockets of demand.
Venture & Private Investment Trends
Notable 2024-2025 transactions include HPE's acquisition of Morpheus Data and NVIDIA's Cosmos platform launch. Venture capital flows are targeting edge AI startups, including Hailo, Ambarella spinouts, and specialised sovereign edge providers.
Future Market Outlook (2026-2034)
The global edge computing market is projected to grow from USD 22.71 Billion in 2025 to USD 139.01 Billion by 2034, representing an absolute increase of USD 116.30 Billion at a CAGR of 21.51%. The market will cross USD 60.14 Billion by 2030, with the forecast curve steepening materially from 2028 onwards as AI-native edge workloads, autonomous systems, and sovereign edge deployments reach commercial scale.
Three technology discontinuities are most likely to reshape the market through 2034. First, generative AI inference will migrate decisively from centralised cloud to edge, driven by privacy, latency, and egress-cost considerations. Second, 5G-Advanced and eventually 6G (commercial deployment expected 2028-2030) will enable deterministic ultra-low latency applications that are impossible today. Third, sovereign edge and data-residency compliance will fragment the hyperscale model, creating a parallel regional edge economy.
By 2034, the industry will have evolved from a hardware-and-infrastructure category into a hybrid software, platform, and services economy. Recurring revenue from edge-native SaaS, managed edge, and AI model subscription services will likely exceed one-time hardware sales as the primary revenue driver. Asia Pacific will continue to close the gap with North America, with China, India, and Japan collectively approaching parity with the US market size by the end of the forecast period.
Research Methodology
Primary Research
Primary research comprised over 60 structured interviews in 2024-2025 with edge computing stakeholders, including product managers at AWS, Microsoft, HPE, Dell, and Cisco; CTO/CIO-level executives at Fortune 500 enterprises; telco MEC product leads; systems integrators; and institutional investors. Primary insights validated market sizing assumptions, segment growth rates, and technology adoption timelines.
Secondary Research
Secondary sources included hyperscaler annual reports (Amazon, Microsoft, Alphabet), HPE and Dell 10-K filings, IDC edge computing tracker data, Gartner Magic Quadrants for edge infrastructure, GSMA mobile connectivity reports, EU Data Act and NIS2 documentation, and leading research publications.
Forecasting Models
Market size estimations and growth projections were developed using a combination of top-down and bottom-up forecasting models, incorporating 5G base station deployment curves, IoT device installed-base projections, cloud capex cycles, and enterprise AI adoption rates. Scenario analysis (base, optimistic, conservative) accounted for macroeconomic uncertainty, geopolitical risk, and the pace of generative AI enterprise adoption.
Edge Computing Market Report Scope
|
Attribute |
Details |
|
Market Size (2025) |
USD 22.71 Billion |
|
Forecast (2034) |
USD 139.01 Billion |
|
CAGR |
21.51% (2026-2034) |
|
Historical Period |
2020-2025 |
|
Base Year |
2025 |
|
Forecast Period |
2026-2034 |
|
Segmentation – Component |
Hardware, Software, Services |
|
Segmentation – Organisation Size |
Large Enterprises, Small and Medium-sized Enterprises (SMEs) |
|
Regions Covered |
North America, Asia Pacific, Europe, Latin America, Middle East & Africa |
|
Key Companies |
Amazon Web Services, Inc., Microsoft, Hewlett Packard Enterprise Development LP, Cisco Systems, Inc., Dell Inc., Google Cloud, NVIDIA Corporation, IBM Corporation, Intel Corporation, and Huawei Technologies Co., Ltd., etc. |
|
Report Format |
PDF, Excel |
Key Benefits for Stakeholders:
- IMARC’s report offers a comprehensive quantitative analysis of various market segments, historical and current market trends, market forecasts, and dynamics of the edge computing market from 2020-2034.
- The research study provides the latest information on the market drivers, challenges, and opportunities in the global edge computing market.
- The study maps the leading, as well as the fastest-growing, regional markets. It further enables stakeholders to identify the key country-level markets within each region.
- Porter's five forces analysis assists stakeholders in assessing the impact of new entrants, competitive rivalry, supplier power, buyer power, and the threat of substitution. It helps stakeholders to analyze the level of competition within the edge computing industry and its attractiveness.
- Competitive landscape allows stakeholders to understand their competitive environment and provides an insight into the current positions of key players in the market.
Frequently Asked Questions About the Edge Computing Market Report
The global edge computing market was valued at USD 22.71 Billion in 2025, driven by 5G rollouts, IoT expansion, and the rapid shift of AI inference workloads from cloud to edge locations.
The market is projected to reach USD 139.01 Billion by 2034, growing at a CAGR of 21.51% during 2026-2034, fuelled by generative AI at the edge, sovereign cloud, and 5G MEC scale-up.
Hardware leads with a 42.6% share in 2025, covering edge servers, gateways, and AI accelerators from NVIDIA, Intel, and AMD, followed by software at 34.8% and services at 22.6%.
Large Enterprises dominate with a 61.3% share in 2025, reflecting capital-intensive telco MEC, factory-wide Industry 4.0 programmes, and healthcare and financial services digital transformation initiatives.
North America leads with a 34.7% share in 2025, anchored by hyperscale providers AWS, Microsoft, and Google, alongside HPE, Dell, Cisco, and NVIDIA, plus CHIPS Act-funded AI infrastructure investment.
Key drivers include 5G rollouts, the projected 75 billion IoT device installed base by 2030, AI inference migration from cloud to edge, and Industry 4.0 and smart manufacturing capex exceeding USD 350 Billion in 2024.
AI at the edge is the fastest-growing sub-segment at ~28.4% CAGR, while Asia Pacific is the fastest-growing region at ~24.6% CAGR through 2034, driven by China 5G and India digital public infrastructure.
Leading companies include Amazon Web Services, Inc., Microsoft, Hewlett Packard Enterprise Development LP, Cisco Systems, Inc., Dell Inc., Google Cloud, NVIDIA Corporation, IBM Corporation, Intel Corporation, and Huawei Technologies Co., Ltd.
Generative AI and computer vision workloads are migrating from centralised cloud to edge nodes to reduce latency, protect privacy, and lower cloud egress costs, with NVIDIA Jetson and Cosmos as reference platforms.
5G enables Multi-Access Edge Compute (MEC), delivering sub-20 millisecond latency. Global 5G connections exceeded 2.25 billion in 2024, with AWS Wavelength and Azure Edge Zones commercialising MEC at telco networks.
Need more help?
- Speak to our experienced analysts for insights on the current market scenarios.
- Include additional segments and countries to customize the report as per your requirement.
- Gain an unparalleled competitive advantage in your domain by understanding how to utilize the report and positively impacting your operations and revenue.
- For further assistance, please connect with our analysts.
 Request Customization
 Speak to an Analyst
 Request Brochure
 Inquire Before Buying
Benefits of Customization
- Personalize this research
- Triangulate with your data
- Get data as per your format and definition
- Gain a deeper dive into a specific application, geography, customer, or competitor
- Any level of personalization
Get in Touch With Us
UNITED STATES
Phone: +1-201-971-6302
INDIA
Phone: +91-120-433-0800
UNITED KINGDOM
Phone: +44-753-714-6104
Email: [email protected]
Client Testimonials


.webp)


