
Ethanol Bus Market Report by Type (First-Generation Ethanol Bus, Second-Generation Ethanol Bus), Application (School, Municipal Traffic, and Others), Ethanol Source (Corn, Sugarcane, Wheat, and Others), and Region 2026-2034
Market Overview 2026-2034:
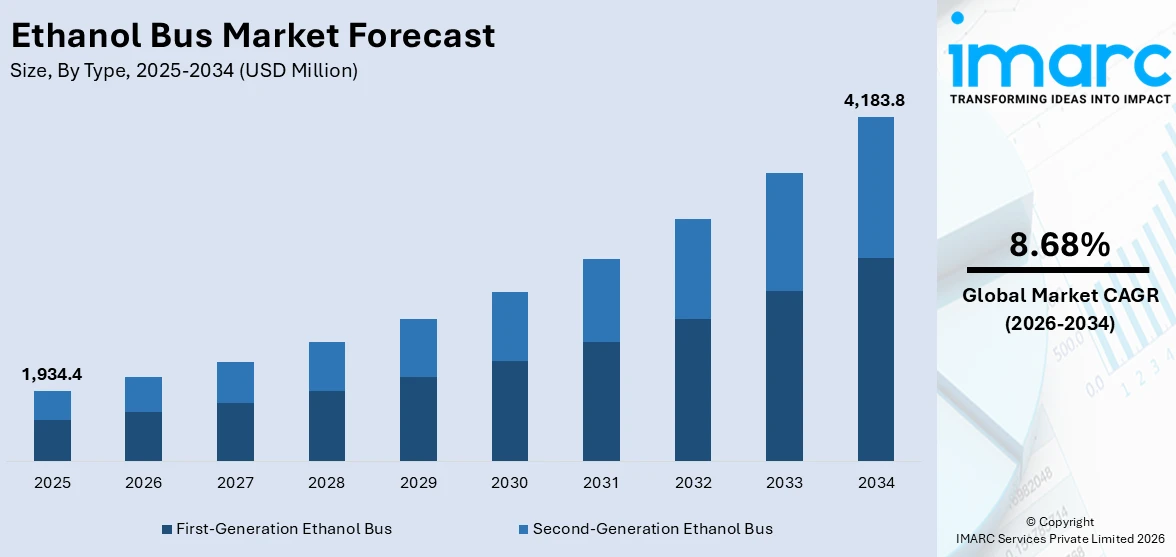
The global ethanol bus market size reached USD 1,934.4 Million in 2025. Looking forward, IMARC Group expects the market to reach USD 4,183.8 Million by 2034, exhibiting a growth rate (CAGR) of 8.68% during 2026-2034.
|
Report Attribute
|
Key Statistics
|
|---|---|
|
Base Year
|
2025
|
|
Forecast Years
|
2026-2034
|
|
Historical Years
|
2020-2025
|
|
Market Size in 2025
|
USD 1,934.4 Million |
|
Market Forecast in 2034
|
USD 4,183.8 Million |
| Market Growth Rate 2026-2034 | 8.68% |
An ethanol bus is a passenger bus that uses ethanol as a fuel source. Ethanol is produced from agricultural feedstock, plant materials (switchgrass and wood pulp), starchy crops (corn, sorghum and barley) and sweet crops (sugarcane, citrus and sugar beets). In comparison to traditional diesel- and petrol-run buses, these vehicles are environment-friendly, cost-effective and reduce the overall dependency of fossil fuels. Owing to this, they are widely being adopted by public and government institutions for mass transportation.
To get more information on this market Request Sample
The increasing adoption of green fuels, along with the introduction of environment-friendly automobiles, is one of the key factors driving the growth of the market. There is an increasing preference for first-generation biofuels (bioethanol) that are manufactured using sugars and oils found in crops, followed by second-generation biofuels, which are produced using lignocellulosic biomass or woody crops, agricultural residues, and waste. Furthermore, increasing environmental consciousness and the implementation of government initiatives to minimize air pollution level, are also providing a boost to the market growth. For instance, emerging nations, such as India, are launching ethanol buses on a large-scale to minimize carbon and greenhouse gas (GHG) emissions into the environment and offer a cost-effective mode of public transport. Additionally, various technological advancements in the manufacturing processes of ethanol and other biofuels are also creating a positive outlook for the market. The improvements in biomass and yeast performance have enhanced the efficiency of bioethanol production.
Key Market Segmentation:
IMARC Group provides an analysis of the key trends in each segment of the global ethanol bus market report, along with forecasts at the global, regional and country levels from 2026-2034. Our report has categorized the market based on type, application and ethanol source.
Breakup by Type:
- First-Generation Ethanol Bus
- Second-Generation Ethanol Bus
Breakup by Application:
Access the comprehensive market breakdown Request Sample
- School
- Municipal Traffic
- Others
Breakup by Ethanol Source:
- Corn
- Sugarcane
- Wheat
- Others
Breakup by Region:
- North America
- United States
- Canada
- Asia Pacific
- China
- Japan
- India
- South Korea
- Others
- Europe
- Germany
- France
- United Kingdom
- Italy
- Russia
- Others
- Latin America
- Brazil
- Mexico
- Others
- Middle East and Africa
Competitive Landscape:
The competitive landscape of the industry has also been examined with some of the key players being AUDI AG, Fiat Chrysler Automobiles N.V., Ford Motor Credit Company LLC, General Motors Company, Isuzu Motors Limited, Jaguar Land Rover Limited, Deere & Company, Nissan Motor Company, Scania CV AB, Toyota Motor Corporation, and Volkswagen AG.
Report Coverage:
| Report Features | Details |
|---|---|
| Base Year of the Analysis | 2025 |
| Historical Period | 2020-2025 |
| Forecast Period | 2026-2034 |
| Units | Million USD |
| Segment Coverage | Type, Application, Ethanol Source, Region |
| Region Covered | Asia Pacific, Europe, North America, Latin America, Middle East and Africa |
| Countries Covered | United States, Canada, Germany, France, United Kingdom, Italy, Russia, China, Japan, India, South Korea, Brazil, Mexico |
| Companies Covered | AUDI AG, Fiat Chrysler Automobiles N.V., Ford Motor Credit Company LLC, General Motors Company, Isuzu Motors Limited, Jaguar Land Rover Limited, Deere & Company, Nissan Motor Company, Scania CV AB, Toyota Motor Corporation, and Volkswagen AG |
| Customization Scope | 10% Free Customization |
| Post-Sale Analyst Support | 10-12 Weeks |
| Delivery Format | PDF and Excel through Email (We can also provide the editable version of the report in PPT/Word format on special request) |
Frequently Asked Questions About the Ethanol Bus Market Report
We expect the global ethanol bus market to exhibit a CAGR of 8.68% during 2026-2034.
The shifting consumer preferences from conventional fuel-based transportation facilities towards eco-friendly alternatives to reduce carbon emissions are currently driving the global ethanol bus market.
The sudden outbreak of the COVID-19 pandemic had led to the implementation of stringent lockdown regulations across several nations resulting in temporary shutdown of numerous manufacturing units for ethanol buses, thereby negatively impacting the overall market.
Based on the type, the global ethanol bus market can be segmented into first-generation ethanol bus and second-generation ethanol bus. Currently, first-generation ethanol bus holds the majority of the total market share.
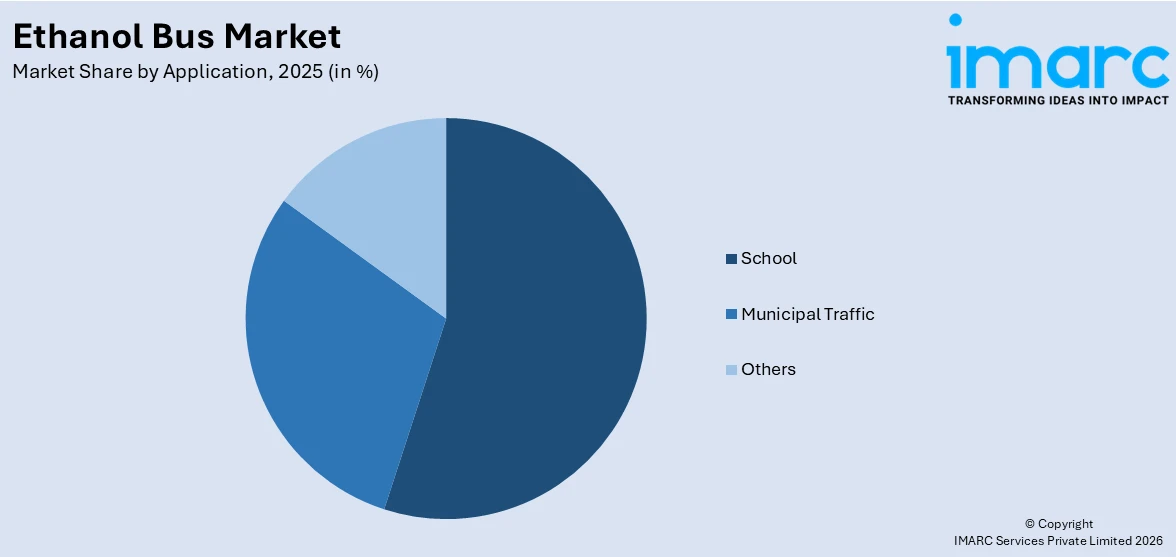
Based on the application, the global ethanol bus market has been divided into school, municipal traffic, and others, where municipal traffic currently exhibits a clear dominance in the market.
Based on the ethanol source, the global ethanol bus market can be categorized into corn, sugarcane, wheat, and others.
On a regional level, the market has been classified into North America, Asia Pacific, Europe, Latin America, and Middle East and Africa, where North America currently dominates the global market.
Some of the major players in the global ethanol bus market include AUDI AG, Fiat Chrysler Automobiles N.V., Ford Motor Credit Company LLC, General Motors Company, Isuzu Motors Limited, Jaguar Land Rover Limited, Deere & Company, Nissan Motor Company, Scania CV AB, Toyota Motor Corporation, and Volkswagen AG, etc.
Need more help?
- Speak to our experienced analysts for insights on the current market scenarios.
- Include additional segments and countries to customize the report as per your requirement.
- Gain an unparalleled competitive advantage in your domain by understanding how to utilize the report and positively impacting your operations and revenue.
- For further assistance, please connect with our analysts.
 Request Customization
 Speak to an Analyst
 Request Brochure
 Inquire Before Buying
Benefits of Customization
- Personalize this research
- Triangulate with your data
- Get data as per your format and definition
- Gain a deeper dive into a specific application, geography, customer, or competitor
- Any level of personalization
Get in Touch With Us
UNITED STATES
Phone: +1-201-971-6302
INDIA
Phone: +91-120-433-0800
UNITED KINGDOM
Phone: +44-753-714-6104
Email: [email protected]
Client Testimonials


.webp)


