
Fermenters Market Report by Process (Batch, Fed-Batch, Continuous), Mode of Operation (Semi-Automatic, Automatic), Material (Stainless-Steel, Glass), End User (Food and Beverages, Pharmaceutical, Personal Care, and Others), and Region 2026-2034
Fermenters Market Size:
The global fermenters market size reached USD 1.9 Billion in 2025. Looking forward, IMARC Group expects the market to reach USD 3.0 Billion by 2034, exhibiting a growth rate (CAGR) of 5.30% during 2026-2034. The increasing demand for bio-based products and sustainable manufacturing processes, the growing sectors such as pharmaceuticals, biotechnology, and food & beverages, significant advancements in fermenter technology, and rising interest in personalized medicine and renewable energy are some of the major factors propelling the market growth.
|
Report Attribute
|
Key Statistics
|
|---|---|
|
Base Year
|
2025 |
|
Forecast Years
|
2026-2034
|
|
Historical Years
|
2020-2025
|
| Market Size in 2025 | USD 1.9 Billion |
| Market Forecast in 2034 | USD 3.0 Billion |
| Market Growth Rate (2026-2034) | 5.30% |
Fermenters Market Analysis:
- Major Market Drivers: The growing demand for bio-based products unsustainable in fracturing processes represents the major driver of the market. Industries including pharmaceuticals, food and beverages, and biotechnology rely on fermenters for efficient production of biofuels, fermented foods, and antibiotics. Technological advancements such as automation and enhanced scalability, boost productivity and reduce costs.
- Key Market Trends: The rising shift toward automation and digitalization to enhance process efficiency and data management represents the key trends in the market. There is a growing focus on modular and scalable fermenter designs to accommodate varying production scales. The increasing integration of advanced control systems and real-time monitoring technologies is improving fermentation accuracy and product quality.
- Geographical Trends: According to the fermenters market overview, North America accounts for the largest region in the market. The strong focus on pharmaceuticals and biotechnology, along with increased investment in research and development (R&D), and the growing demand for bio-based products are driving the growth of the market across the North American region. The region’s advanced infrastructure, high levels of innovation, and the emphasis on sustainable manufacturing practices are further propelling the market, alongside rising interest in renewable energy and personalized medicine.
- Competitive Landscape: Some of the major market players in the fermenters industry include Applikon Biotechnology B.V. (Getinge AB), bbi-biotech GmbH, Bioengineering AG, CerCell A/S, Electrolab Biotech Ltd, GEA Group Aktiengesellschaft, General Electric Company, Pierre Guérin SAS (ENGIE Group Company), Sartorius AG, Thermo Fisher Scientific Inc., and ZETA Holding GmbH, among many others.
- Challenges and Opportunities: The market faces several challenges including high initial capital costs and complexity in designing systems that meet diverse industrial needs. Ensuring consistent quality and performance across different scales and applications can be difficult. However, the market also faces various opportunities such as expanding applications for fermenters in emerging sectors like personalized medicine and renewable energy. Advancements in automation, real-time monitoring, and modular designs offer the potential for enhanced efficiency and scalability.
To get more information on this market Request Sample
Fermenters Market Trends:
Increased Demand for Bio-Based Products
The growing need for bio-based products in several industries such as pharmaceuticals, biotechnology, and food & beverages is driving the growth of the market. For instance, in February 2024, 21st.Bio, a bioproduction company launched a precision fermentation technology platform for ingredient manufacturers aiding the manufacturing of dairy proteins. The new platform, created in partnership with Novozymes, signifies a step forward for large-scale production for producers in the industry. This action follows the company’s successful scale-up of its beta-lactoglobulin production. In line with this, fermenters are essential for producing high-value products such as biofuels, fermented foods, and antibiotics which makes them critical to meet consumer and industrial demands, thereby creating a positive fermenters market outlook.
Significant Technological Advancements
Innovations in fermentation technologies, such as automation, real-time monitoring, and scalable designs enhance fermentation processes and improve productivity which is boosting the market growth. For instance, in October 2023, MycoTechnology launched the Fermentation as a Service (FaaS) platform. This platform is designed to help enterprises and startups that are stressed to protect fermentation capacity. This platform is expected to facilitate various corporations to have access to tools and expertise and overcome issues including yield, quality, and cost management while trying to scale up their commercial production and/or fermentation operations. Similarly, in January 2024, ABB launched its new process automation solution for the cold block stage of beer production to drive optimization and efficiency improvements. Fermentation and maturation, filtration, yeast management, cleaning in place (CIP), bright beer tanks (BBT) area, and other secondary processes are all part of the brewing process during the cold block stage. According to the fermenters market forecast, these advanced fermenters provide better control, improved productivity, and reduced operational costs, which is further expected to boost their adoption across various applications.
Rising Sustainability and Renewable Energy
The rising interest in sustainable manufacturing practices and renewable energy drives the need for advanced fermenter systems, supporting the development of eco-friendly and bio-based solutions. For instance, GNT is working to develop new plant-based, sustainable Exberry color solutions for food and drink using fermentation technologies. According to GNT, producing colors through fermentation allows for improved functionality as well as highly efficient and sustainable year-round production. After being grown, the raw materials can be expanded for industrial manufacturing in massive bioreactors. To accomplish its goals, GNT has decided to work with Plume Biotechnology, a start-up company based in the UK that specializes in fermentation science and bioprocessing for natural color creation.
Fermenters Market Segmentation:
IMARC Group provides an analysis of the key trends in each segment of the market, along with forecasts at the global, regional, and country levels for 2026-2034. Our report has categorized the market based on process, mode of operation, material, and end user.
Breakup by Process:
To get detailed segment analysis of this market Request Sample
- Batch
- Fed-Batch
- Continuous
Fed-batch accounts for the majority of the market share
The report has provided a detailed breakup and analysis of the market based on the process. This includes batch, fed-batch, and continuous. According to the report, fed-batch represented the largest segment.
The fed-batch method allows for greater control over nutrient levels and metabolic conditions, leading to improved product yield and quality. It is particularly advantageous for processes requiring high cell densities or extended production times, including in the pharmaceutical and biotechnology industries. Additionally, the fed-batch process minimizes the risk of contamination and can enhance the efficiency of expensive substrates. Its adaptability for both small-scale and large-scale production further boosts its adoption across various sectors, such as food and beverage and biopharmaceuticals.
Breakup by Mode of Operation:
- Semi-Automatic
- Automatic
Automatic holds the largest share of the industry
A detailed breakup and analysis of the market based on the mode of operation have also been provided in the report. This includes semi-automatic and automatic. According to the fermenters market report, automatic accounted for the largest market share.
The demand for automatic modes of operation in the market is driven by the need for increased precision and efficiency in fermentation processes. Automation enhances process control by providing real-time monitoring and adjustments, reducing human error, and improving consistency. It also allows for better scalability and integration with other production systems. Automatic operations streamline workflows, reduce labor costs, and enhance overall productivity. The growing complexity of fermentation processes and the emphasis on high-quality product output further propel the adoption of automated fermenter systems across various industries, including pharmaceuticals, biotechnology, and food & beverages.
Breakup by Material:
- Stainless-Steel
- Glass
Stainless-steel represents the leading market segment
The report has provided a detailed breakup and analysis of the market based on the material. This includes stainless-steel and glass. According to the report, stainless-steel represented the largest segment.
The demand for stainless steel material in the market is driven by its superior properties such as corrosion resistance, durability, and ease of cleaning. Stainless steel’s resistance to harsh chemicals and high temperatures ensures longevity and reliability in fermentation processes. Its non-reactive nature prevents contamination and maintains product purity, essential for industries like pharmaceuticals and food & beverages. Stainless steel's strength and structural integrity support the design of robust and scalable fermenter systems which is further driving the fermenters market growth.
Breakup by End User:
- Food and Beverages
- Pharmaceutical
- Personal Care
- Others
Food and beverages exhibits a clear dominance in the market
A detailed breakup and analysis of the market based on the end user have also been provided in the report. This includes food beverages, pharmaceuticals, personal care, and others. According to the report, food and beverages accounted for the largest market share.
The demand for fermenters in the food and beverages sector is driven by the increasing popularity of fermented products such as yogurt, beer, and kombucha. Fermenters enable precise control over fermentation conditions, ensuring product consistency and quality. The growing consumer preference for probiotic-rich and health-oriented foods is boosting the need for advanced fermentation technology which is further enhancing the fermenters market value. In addition to this, innovations in fermenter design, such as enhanced automation and scalability, support large-scale production and improve efficiency. The focus on sustainability and reducing waste also drives the adoption of fermenters, as they allow for efficient utilization of raw materials and energy.
Breakup by Region:
To get more information on the regional analysis of this market Request Sample
- North America
- United States
- Canada
- Asia-Pacific
- China
- Japan
- India
- South Korea
- Australia
- Indonesia
- Others
- Europe
- Germany
- France
- United Kingdom
- Italy
- Spain
- Russia
- Others
- Latin America
- Brazil
- Mexico
- Others
- Middle East and Africa
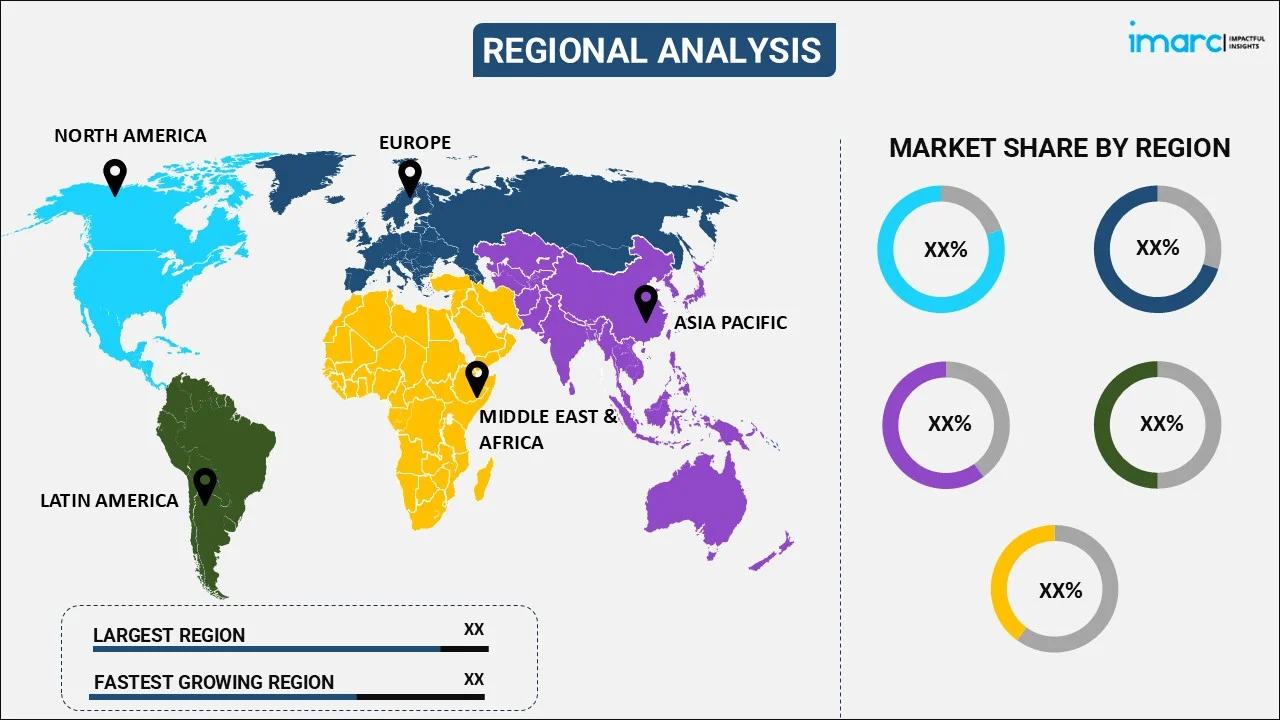
North America leads the market, accounting for the largest fermenters market share
The report has also provided a comprehensive analysis of all the major regional markets, which include North America (the United States and Canada); Europe (Germany, France, the United Kingdom, Italy, Spain, Russia, and others); Asia Pacific (China, Japan, India, South Korea, Australia, Indonesia, and others); Latin America (Brazil, Mexico, and others); and the Middle East and Africa. According to the report, North America represents the largest regional market for fermenters.
The rising emphasis on biotechnology and pharmaceuticals is fueling the demand for advanced fermentation technologies used in drug development and production which is further driving the market growth across the region. Significant investments in research and development (R&D) support innovations in fermentation processes and equipment which is further boosting the fermenters demand. For instance, in July 2024, a Canadian specialist in regenerative ingredients announced its acquisition of European plant-based food and technology company Brotalia. A specialist in 3D bioprinting and dry fermentation technologies, Brotalia produces a range of plant-based meat alternatives under the commercial name Foody’s. Its fermentation process upcycles ingredients and their byproducts into high-value end products while enhancing nutrient density. In line with this, the growing emphasis on sustainability and renewable energy is prompting industries to adopt eco-friendly and efficient fermentation solutions which is further influencing the market growth across the region.
Competitive Landscape:
- The market research report has also provided a comprehensive analysis of the competitive landscape in the market. Detailed profiles of all major companies have also been provided. Some of the major market players in the fermenters industry include Applikon Biotechnology B.V. (Getinge AB), bbi-biotech GmbH, Bioengineering AG, CerCell A/S, Electrolab Biotech Ltd, GEA Group Aktiengesellschaft, General Electric Company, Pierre Guérin SAS (ENGIE Group Company), Sartorius AG, Thermo Fisher Scientific Inc., and ZETA Holding GmbH.
(Please note that this is only a partial list of the key players, and the complete list is provided in the report.)
- The market for fermenters features a competitive landscape with key players such as GE Healthcare, Sartorius, and Eppendorf leading in innovation and technology. These companies are focusing on automation, scalability, and real-time monitoring to enhance performance and efficiency. New entrants and established firms are also investing in modular designs and sustainable solutions to address diverse industry needs. For instance, in January 2024, Kao Corporation succeeded in the production of bio gallic acid*2 from glucose through fermentative creation using microorganisms and launched sales in Japan in December 2023. Moreover, strategic partnerships, mergers, and acquisitions are common as various fermenters companies seek to expand their market presence and technological capabilities.
Fermenters Market News:
- In June 2024, French dairy conglomerate Danone announced a partnership to scale up precision fermentation, aiming to foster the development of healthier and more sustainable food products. The initiative dubbed the Biotech Open Platform, is a collaboration with local industrial titan Michelin, known primarily for its tire manufacturing, Crédit Agricole, a major investment bank, and American biotech startup DMC Biotechnologies.
- In May 2024, Olon Group, a global leader in food biomanufacturing and development, and Chromologics, a Danish biotech company specializing in the production of innovative natural food colors, announced an ongoing partnership to leverage Olon’s vast fermentation infrastructure to manufacture Chromologics products. Olon and Chromologics established this partnership to leverage Olon’s fermentation sites across Italy.
Fermenters Market Report Scope:
| Report Features | Details |
|---|---|
| Base Year of the Analysis | 2025 |
| Historical Period | 2020-2025 |
| Forecast Period | 2026-2034 |
| Units | Billion USD |
| Scope of the Report | Exploration of Historical Trends and Market Outlook, Industry Catalysts and Challenges, Segment-Wise Historical and Future Market Assessment:
|
| Processes Covered | Batch, Fed-Batch, Continuous |
| Mode of Operations Covered | Semi-Automatic, Automatic |
| Materials Covered | Stainless-Steel, Glass |
| End Users Covered | Food Beverages, Pharmaceuticals, Personal Care, Others |
| Regions Covered | Asia Pacific, Europe, North America, Latin America, Middle East and Africa |
| Countries Covered | United States, Canada, Germany, France, United Kingdom, Italy, Spain, Russia, China, Japan, India, South Korea, Australia, Indonesia, Brazil, Mexico |
| Companies Covered | Applikon Biotechnology B.V. (Getinge AB), bbi-biotech GmbH, Bioengineering AG, CerCell A/S, Electrolab Biotech Ltd, GEA Group Aktiengesellschaft, General Electric Company, Pierre Guérin SAS (ENGIE Group Company), Sartorius AG, Thermo Fisher Scientific Inc., ZETA Holding GmbH, etc. |
| Customization Scope | 10% Free Customization |
| Post-Sale Analyst Support | 10-12 Weeks |
| Delivery Format | PDF and Excel through Email (We can also provide the editable version of the report in PPT/Word format on special request) |
Key Questions Answered in This Report:
- How has the global fermenters market performed so far, and how will it perform in the coming years?
- What are the drivers, restraints, and opportunities in the global fermenters market?
- What is the impact of each driver, restraint, and opportunity on the global fermenters market?
- What are the key regional markets?
- Which countries represent the most attractive fermenters market?
- What is the breakup of the market based on the process?
- Which is the most attractive process in the fermenters market?
- What is the breakup of the market based on the mode of operation?
- Which is the most attractive mode of operation in the fermenters market?
- What is the breakup of the market based on the material?
- Which is the most attractive material in the fermenters market?
- What is the breakup of the market based on the end user?
- Which is the most attractive end user in the fermenters market?
- What is the competitive structure of the market?
- Who are the key players/companies in the global fermenters market?
Key Benefits for Stakeholders:
- IMARC’s industry report offers a comprehensive quantitative analysis of various market segments, historical and current market trends, market forecasts, and dynamics of the fermenters market from 2020-2034.
- The research report provides the latest information on the market drivers, challenges, and opportunities in the global fermenters market.
- The study maps the leading, as well as the fastest-growing, regional markets. It further enables stakeholders to identify the key country-level markets within each region.
- Porter's five forces analysis assists stakeholders in assessing the impact of new entrants, competitive rivalry, supplier power, buyer power, and the threat of substitution. It helps stakeholders to analyze the level of competition within the fermenters industry and its attractiveness.
- The competitive landscape allows stakeholders to understand their competitive environment and provides insight into the current positions of key players in the market.
Need more help?
- Speak to our experienced analysts for insights on the current market scenarios.
- Include additional segments and countries to customize the report as per your requirement.
- Gain an unparalleled competitive advantage in your domain by understanding how to utilize the report and positively impacting your operations and revenue.
- For further assistance, please connect with our analysts.
 Request Customization
 Speak to an Analyst
 Request Brochure
 Inquire Before Buying
Benefits of Customization
- Personalize this research
- Triangulate with your data
- Get data as per your format and definition
- Gain a deeper dive into a specific application, geography, customer, or competitor
- Any level of personalization
Get in Touch With Us
UNITED STATES
Phone: +1-201-971-6302
INDIA
Phone: +91-120-433-0800
UNITED KINGDOM
Phone: +44-753-714-6104
Email: [email protected]
Client Testimonials


.webp)


