
Fertilizer Market Size, Share, Trends and Forecast by Product Type, Product, Product Form, Crop Type, and Region, 2026-2034
Global Fertilizer Market Size, Share, Trends & Forecast (2026-2034)
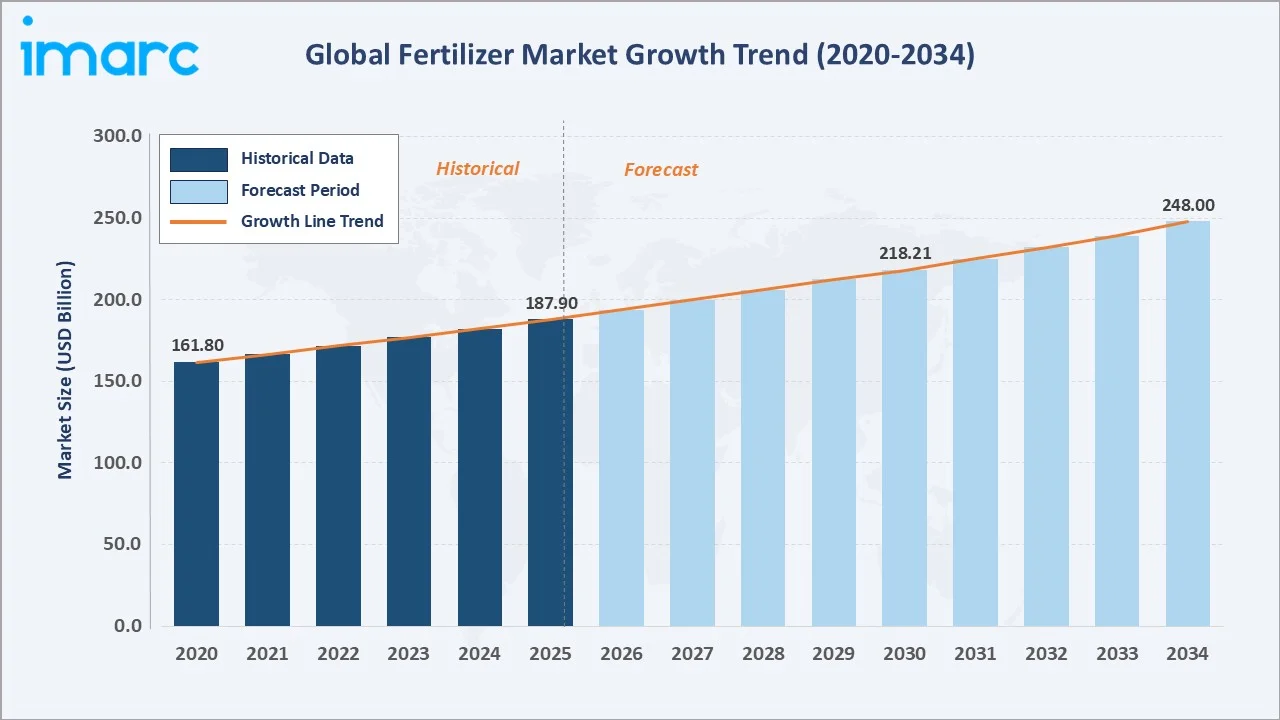
The global fertilizer market was valued at USD 187.90 Billion in 2025 and is projected to reach USD 248.00 Billion by 2034, expanding at a CAGR of 3.04% during the forecast period (2026-2034). The market is propelled by rising global food demand, which may increase by 50-60% from 2019 to 2050, as the world’s population grows by 1.5 Billion, growing adoption of precision agriculture, and sustained government subsidy programs across Asia Pacific and Latin America. Chemical fertilizers dominate with a 66.6% share (2025), while dry product forms account for 81.8% of total demand. Asia Pacific leads globally with a 52.5% revenue share.
Market Snapshot
|
Metric |
Value |
|
Market Size (2025) |
USD 187.90 Billion |
|
Forecast Market Size (2034) |
USD 248.00 Billion |
|
CAGR (2026-2034) |
3.04% |
|
Base Year |
2025 |
|
Historical Period |
2020-2025 |
|
Forecast Period |
2026-2034 |
|
Largest Region |
Asia Pacific (52.5%, 2025) |
|
Fastest Growing Region |
Latin America (CAGR ~3.8%, 2026-2034) |
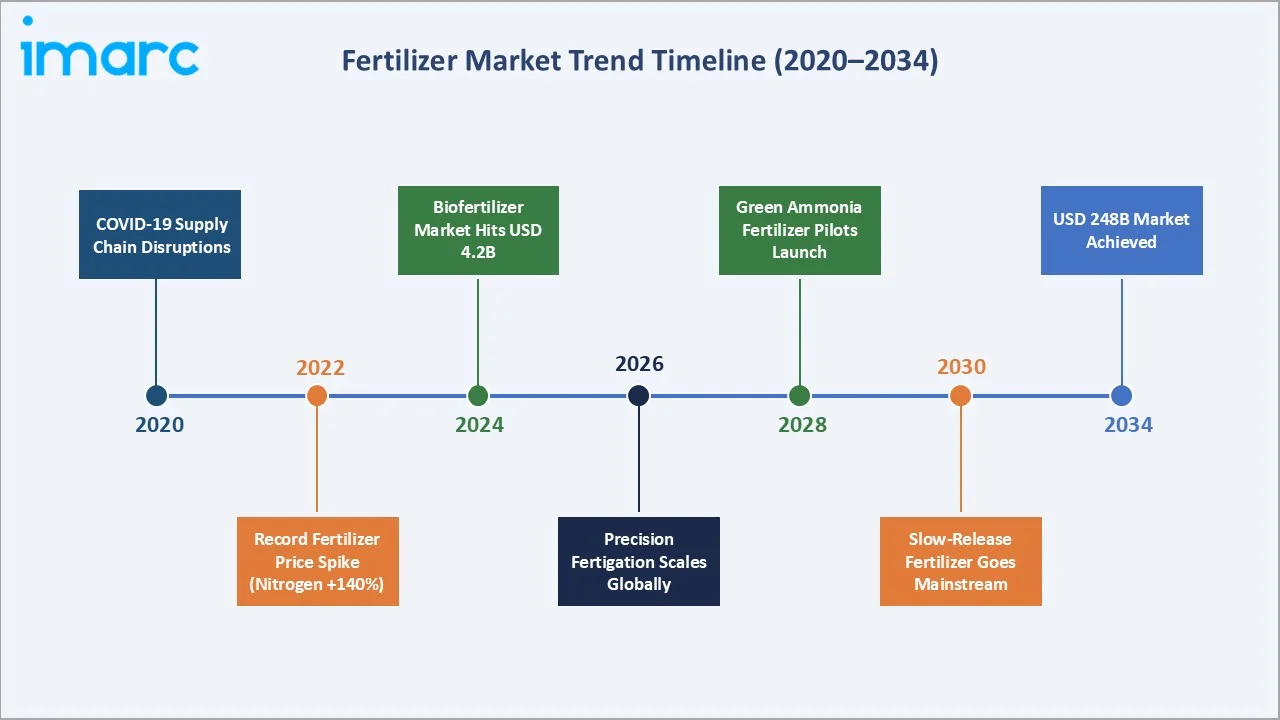
The fertilizer market from 2020 through 2034 expanded from USD 161.80 Billion in 2020 to USD 187.90 Billion in 2025, anchored at USD 218.20 Billion in 2030 before reaching USD 248.00 Billion by 2034.
To get more information on this market, Request Sample
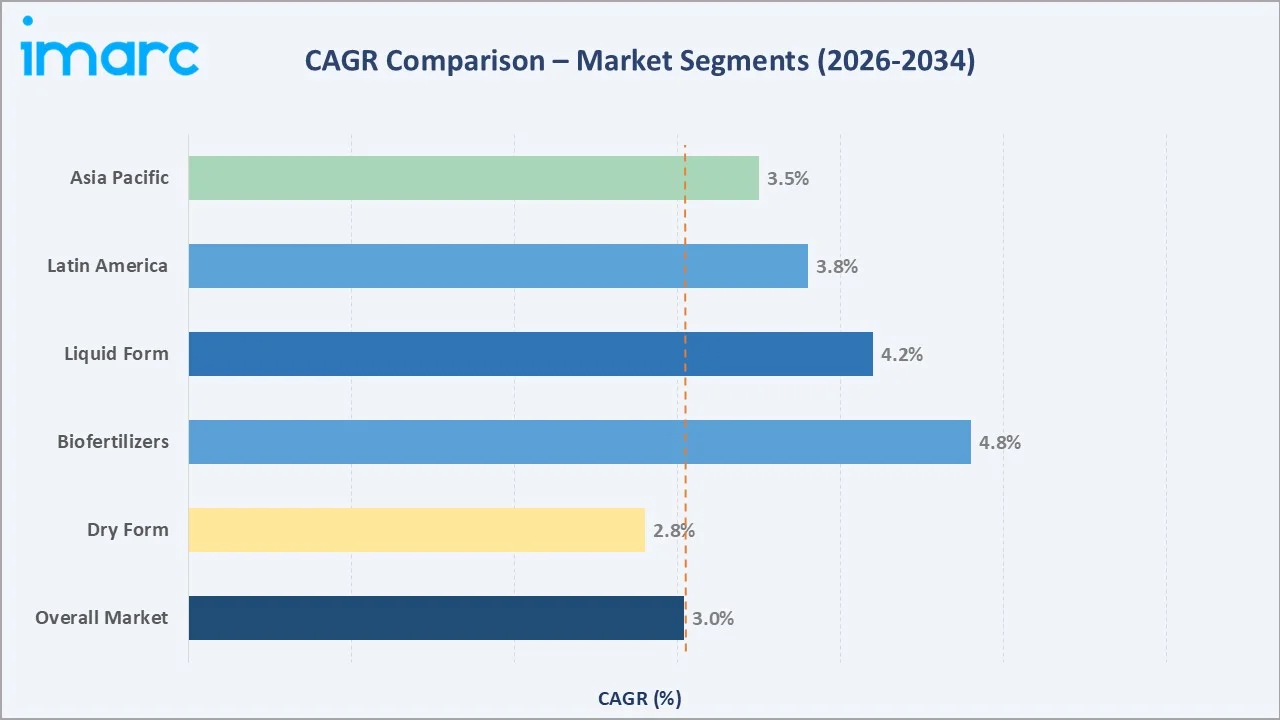
The overall market CAGR is 3.04%, the biofertilizers segment is growing at a CAGR of 4.8%, the liquid form segment is growing at a CAGR of 4.2%, and the Latin America region is growing at 3.8% CAGR.
Executive Summary
The global fertilizer market demonstrates steady, structurally-supported growth underpinned by escalating global food security imperatives. Valued at USD 187.90 Billion in 2025, the market is forecast to reach USD 248.00 Billion by 2034, at a CAGR of 3.04%. The world must feed approximately 9.7 Billion people by 2050, requiring an estimated increase in global food production, a target impossible without sustained intensification of fertilizer application rates across staple crop farming systems worldwide.
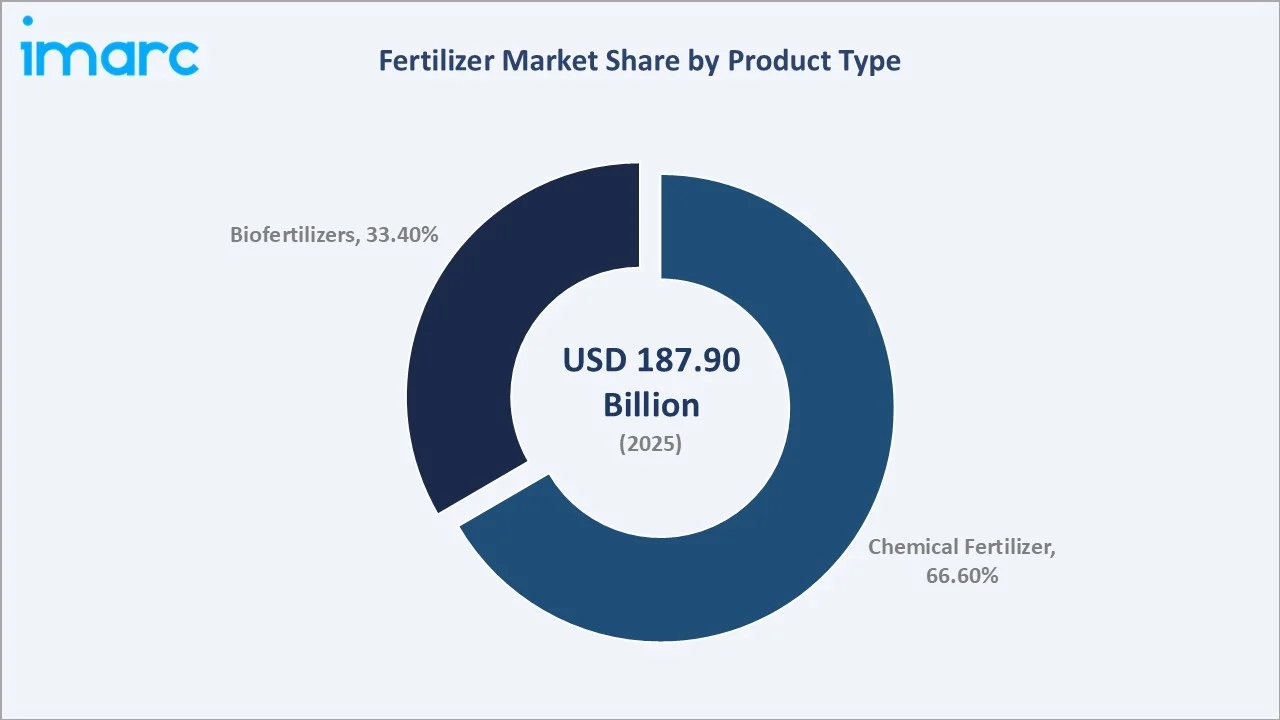
Chemical fertilizers command a 66.6% market share (2025), anchored by nitrogenous fertilizer demand for rice, wheat, and maize cultivation. Dry product forms dominate at 81.8%, reflecting the logistical and handling advantages of granular urea, DAP, and MOP for large-scale mechanized farming. Biofertilizers, though a smaller segment at 33.4% (2025), are the fastest growing category at approximately 4.8% CAGR, driven by regulatory restrictions on synthetic inputs and growing interest in regenerative and organic agriculture practices globally.
Asia Pacific's 52.5% market dominance (2025) reflects the region's agricultural intensity and massive government-subsidized distribution systems. North America follows at 17.6%, anchored by the U.S. corn belt and Canada's canola and wheat production systems. Latin America at 9.6% is emerging as the most dynamic regional growth opportunity, driven by Brazil's soybean and sugarcane expansion and zero import tariff policies on fertilizers.
Key Market Insights
|
Insight |
Data |
|
Largest Product Type |
Chemical Fertilizer – 66.6% share (2025) |
|
Largest Product Form |
Dry Fertilizers – 81.8% share (2025) |
|
Leading Region |
Asia Pacific – 52.5% revenue share (2025) |
|
Fastest Growing Region |
Latin America (CAGR ~3.8%, 2026-2034) |
Key Analytical Observations Supporting The Above Data:
- Chemical fertilizers dominate with 66.6% share (2025), driven by nitrogen's irreplaceable role in protein synthesis for cereal crops. Global urea demand exceeded 185.7 million metric tons in 2025, with China, India, and the U.S. as the three largest consuming markets.
- Dry fertilizers command 81.8% of market demand (2025), reflecting granular urea's dominant position in large-scale crop production.
- Asia Pacific holds a commanding 52.5% market share (2025), with India's government allocating INR 1.64 lakh crore in fertilizer subsidies in FY2025, sustaining urea retail prices 80% below market rates for farmers.
- Latin America's fertilizer market is growing at ~3.8% CAGR, driven by Brazil's agribusiness expansion. Brazil is the world's largest fertilizer importer, imported around 45.5 million metric tons in 2025.
Global Fertilizer Market Overview
Fertilizers are chemical or biological substances applied to soil or plant tissue to supply essential nutrients for crop growth. The global fertilizer ecosystem spans three core macronutrient categories, nitrogen (N), phosphorus (P), and potassium (K), alongside secondary macronutrients (calcium, magnesium, sulfur) and micronutrients (zinc, boron, manganese). The industry value chain extends from raw material extraction (phosphate rock, potash mining, natural gas for ammonia synthesis) through chemical processing, formulation, and distribution to agricultural end users across 160+ countries.
Applications span grains and cereals, oilseeds, fruits and vegetables, and floriculture. Macroeconomic drivers are powerful, with the world total cropland area per person decreased by about 20% from 2001 to 2023, making yield intensification via fertilization the primary strategy for meeting food demand.
Market Dynamics
To evaluate market opportunities, Request Sample
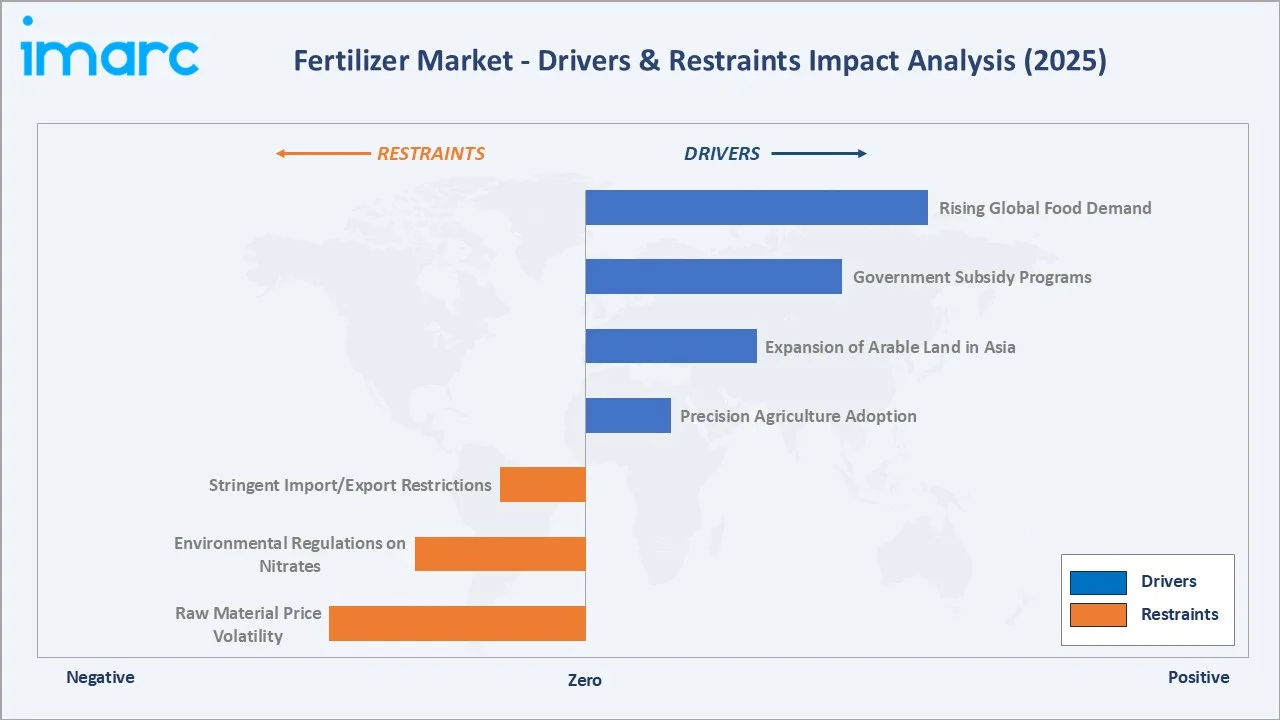
Market Drivers
- Rising Global Food Demand: The world population is projected to reach 9.7 Billion by 2050, requiring an increase in food production. Annual cereal production needs to rise to about 3 Billion tonnes by 2050 from 2.1 Billion, creating an indispensable structural demand floor for nitrogen, phosphate, and potash fertilizers.
- Government Subsidy and Food Security Programs: India's fertilizer subsidy program, China's agricultural input support programs, and Brazil's zero import tariff on fertilizers collectively sustain demand at artificially high levels across the three largest consuming nations globally.
- Precision Agriculture and Variable-Rate Technology: Satellite AI maps nutrient stress with 92% accuracy, guided variable-rate fertilization across 12 million hectares by 2025, optimizes fertilizer placement and timing, increasing yield per crop cycle while maintaining or growing total fertilizer expenditure per farm.
Market Restraints
- Raw Material Price Volatility: 70% to 80% of the cost price of gray ammonia are natural gas costs. This high cost hampering the market growth.
- Stringent Environmental Regulations on Nitrogen Application: The EU Nitrates Directive restricts nitrogen application rates to 170 kg N/ha in vulnerable zones, affecting EU agricultural land.
Market Opportunities
- Biofertilizer and Microbiome Technology: Rhizobium-based and mycorrhizal inoculants can replace synthetic nitrogen inputs in legume crops, creating a premium product category that commands price premiums over conventional fertilizers.
- Enhanced-Efficiency and Slow-Release Fertilizers: Slow-release and controlled-release fertilizers (CRF) reduce nitrogen losses versus conventional urea.
- Sub-Saharan Africa's Fertilizer Deficit: Sub-Saharan Africa applies an average of 17 kg of nutrients per hectare, seven times below the global average. The African Union's Fertilizer and Soil Health Action Plan targets a improving the fertilizer use, representing an incremental demand opportunity.
Market Challenges
- Groundwater and Soil Acidification: Excessive nitrogen application will trigger regulatory restrictions that are beginning to constrain demand growth in the world's largest fertilizer-consuming nations.
- Climate Change Impact on Crop Cycles: Increased drought frequency in North America's corn belt and flooding in South Asian rice belts are disrupting fertilizer application timing windows, reducing fertilizer use efficiency in affected regions and creating pricing uncertainty for input planning by both farmers and distributors.
Emerging Market Trends
1. Nano Fertilizers Disrupting Conventional Application Models
IFFCO's Nano Urea fertilizer, launched commercially in 2021, requires only 500 ml per acre, reducing nitrogen input while maintaining or improving yields. Fertilizer companies have sold 10.68 crore bottles (500 ml each) of Nano Urea and 2.75 crore bottles (500 ml each) of Nano DAP across all regions of India, since inception.
2. Green and Blue Ammonia for Low-Carbon Fertilizer Production
Green ammonia and blue ammonia are being commercialized by Yara, CF Industries, and SABIC as pathways to decarbonize nitrogen fertilizer production. Yara's Porsgrunn green ammonia plant produces 20,500 tons of green ammonia annually.
3. Biostimulants and Biofertilizer Integration
The global biostimulants, including humic acids, seaweed extracts, and amino acid-based plant biostimulants, are growing rapidly. These products are increasingly co-formulated with conventional fertilizers, creating premium-priced combination products that reduce synthetic input requirements while supporting soil health certification programs.
4. India's Nano DAP and Fertilizer 2.0 Revolution
Following the success of Nano Urea, IFFCO launched Nano DAP in 2023, a liquid phosphate fertilizer delivering equivalent agronomic performance to conventional DAP at lower volume and lower cost per hectare.
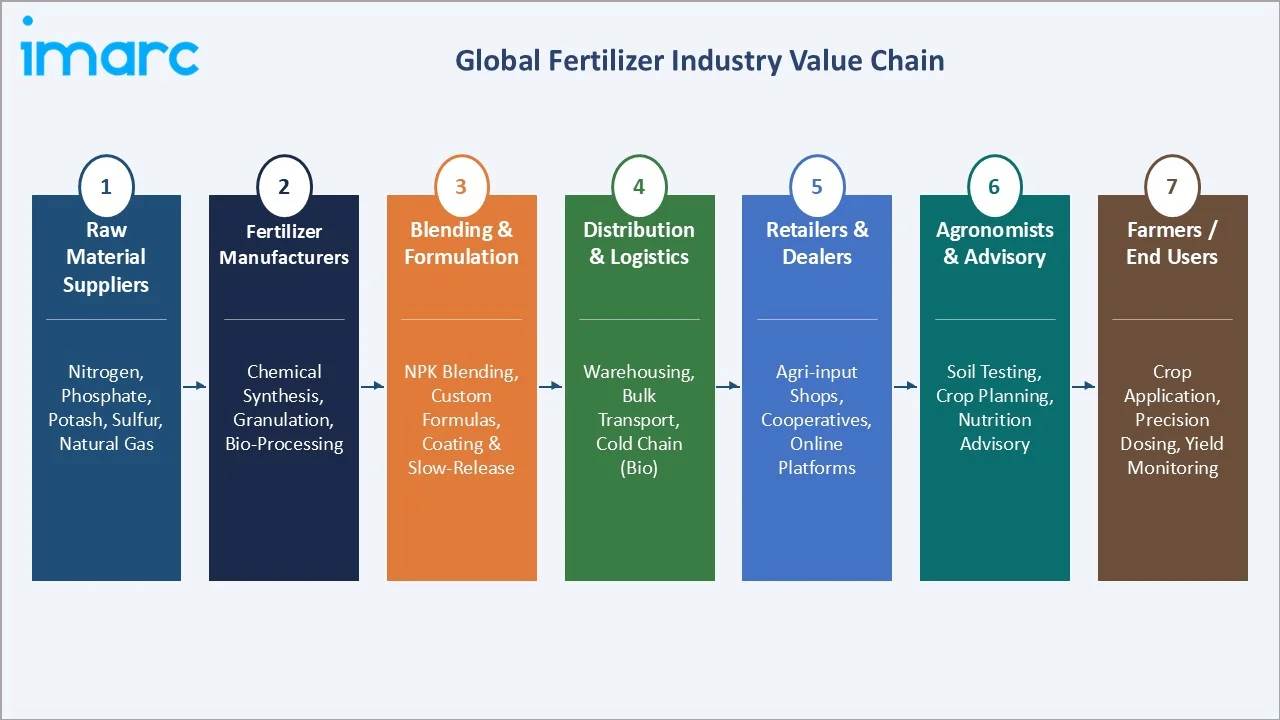
Industry Value Chain Analysis
The fertilizer industry value chain spans from geological mineral extraction through to farm-level nutrient application. Each stage is capital-intensive, technically specialized, and governed by distinct competitive dynamics, creating barriers to entry and stable market positions for established players.
|
Stage |
Key Players / Examples |
|
Raw Material Mining & Extraction |
Phosphate, potash, PhosAgro |
|
Chemical Processing & Synthesis |
Nitrogen, ammonia |
|
Blending & Formulation |
Custom NPK blenders, regional fertilizer cooperatives |
|
Distribution & Logistics |
Agricultural wholesalers, cooperative networks, and port terminals |
|
Retail & Agri-Dealer Networks |
Farm supply stores, agri-input dealers, e-commerce platforms |
|
Farmers & End Users |
Grain farmers, fruit/vegetable growers, floriculture producers |
The fertilizer manufacturing stage captures the highest margin layer, with integrated producers. Distribution and retail margins are structurally lower and provide high-frequency revenue and deep farmer relationship advantages that enable premium product introductions such as specialty blends and biofertilizer co-formulations.
Technology Landscape in the Fertilizer Industry
Nitrogen Synthesis and Green Ammonia Technology
The Haber-Bosch process has produced synthetic nitrogen for over a century, but is now being challenged by electrochemical nitrogen fixation and green ammonia synthesis. Yara International and CF Industries have invested in green and blue ammonia projects. In April 2025, CF Industries Holdings, Inc. announced that it has formed a joint venture with JERA Co., Inc. and Mitsui & Co., Ltd. for the construction, production and offtake of low-carbon ammonia.
Controlled-Release and Polymer-Coated Fertilizer Technology
Polymer-coated urea (PCU) and sulfur-coated urea (SCU) release nitrogen progressively, matching crop uptake curves and reducing nitrogen leaching losses. Polymer coated urea for rice use 60–120 day controlled release formulations.
Nanotechnology in Fertilizer Delivery
Nano-encapsulation technology allows targeted delivery of nutrients directly to root zones, reducing nutrient loss through volatilization and leaching. IFFCO's Nano Urea contains 4% nitrogen in nanoparticle form. Carbon nanotube-based micronutrient carriers and nano-zeolite nitrogen carriers are in commercial pilot phase with multiple global fertilizer producers.
Digital Agriculture and IoT-Enabled Precision Fertilization
Satellite multispectral imaging, IoT soil moisture and EC sensors, and AI-driven crop modeling platforms enable real-time, field-level fertilizer rate recommendations. These platforms reduce over-fertilization, cutting input costs while qualifying participating farmers for premium-priced sustainable supply chain certification programs.
Fertilizer Market Segmentation Analysis
The report covers the following segments:
|
Segment Category |
Leading Segment |
Market Share |
Year |
|
Product Type |
Chemical Fertilizer |
66.6% |
2025 |
|
Product |
Straight Fertilizers |
🔒 |
2025 |
|
Product Form |
Dry |
81.8% |
2025 |
|
Crop Type |
Grains and Cereals |
45.8% |
2025 |
|
Region |
Asia Pacific |
52.5% |
2025 |

By Product Type
Chemical fertilizer dominates with a 66.6% market share in 2025. This segment is anchored by nitrogenous fertilizers, primarily urea, ammonium nitrate (AN), and diammonium phosphate (DAP), which are essential for cereal crop cultivation globally. India consumed 62.98 million tonnes of chemical fertilizers in 2020–21, excluding SSP, an 82.5 % increase from 2000 to 2001.
To access detailed market analysis, Request Sample
Biofertilizers hold a 33.4% market share (2025). While this includes all biological and organic-compatible nutrient inputs, the pure biofertilizer subcategory is growing at ~4.8% CAGR through 2034, driven by the EU's Farm to Fork Strategy, India's promotion of natural farming, and premium pricing in export-oriented organic agriculture.
By Product Form
Dry fertilizers command an 81.8% market share (2025), representing approximately USD 153.7 Billion. Granular and prilled forms, dominated by granular urea, DAP, and MOP, offer superior logistics handling, stability, and compatibility with mechanized broadcast and banded application equipment.
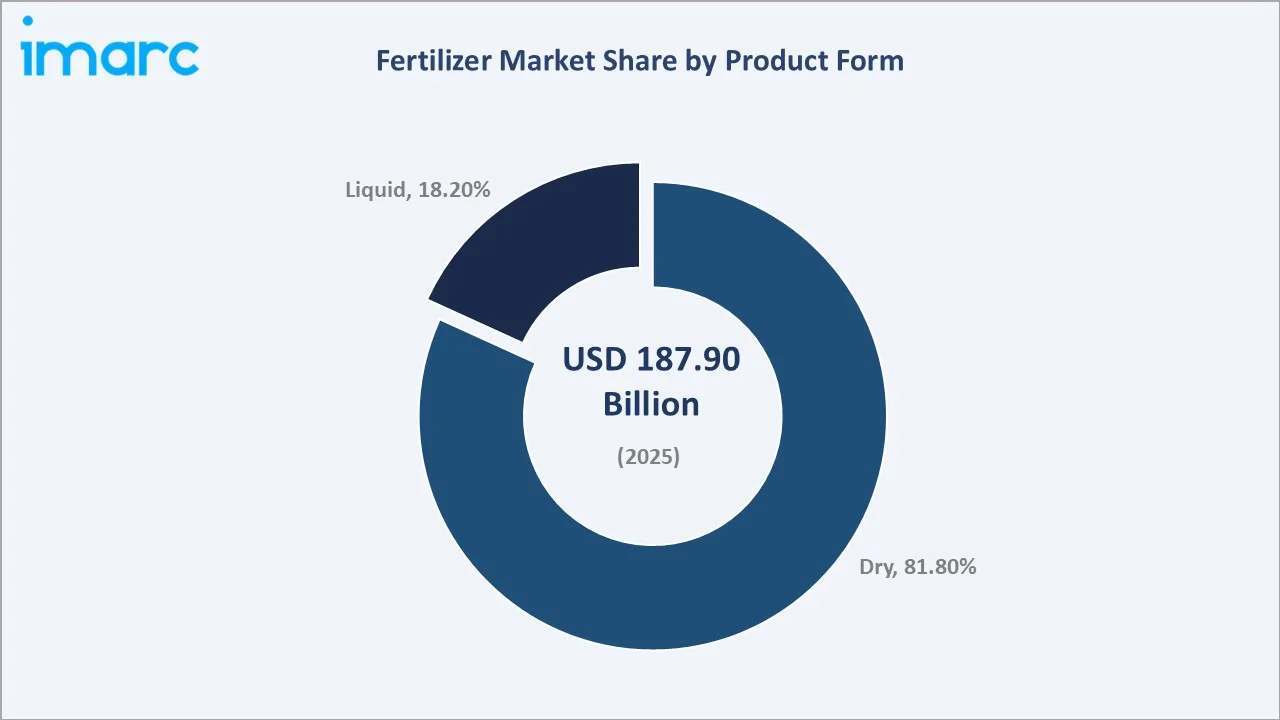
Liquid fertilizers hold 18.2% market share (2025). Liquid UAN (urea ammonium nitrate solution) and liquid phosphoric acid are the primary liquid forms, used predominantly in North American corn and wheat production via high-efficiency injection application. Liquid fertilizers offer superior nutrient uniformity and compatibility with fertigation.
Regional Market Insights
|
Region |
Share (2025) |
Key Growth Drivers |
|
Asia Pacific |
52.5% |
Rice/wheat cultivation in China, India, Indonesia palm oil, government subsidy programs |
|
North America |
17.6% |
U.S. corn/soybean belt demand; precision agriculture; Canada canola acreage expansion |
|
Europe |
14.8% |
EU Farm to Fork Strategy; Ukraine conflict impacting supply; specialty crop demand |
|
Latin America |
9.6% |
Brazil soybean/sugar expansion; Argentina corn growth; Peru agri-export targets |
|
Middle East & Africa |
5.5% |
Saudi food security Vision 2030; Morocco phosphate exports; Sub-Saharan food security |
Asia Pacific's commanding 52.5% market share (2025) is driven by the region's agricultural intensity. India fertilizer production reached 509.57 lakh tonnes in 2024 and further accelerated to an all-time high of 524.62 lakh tonnes in 2025.
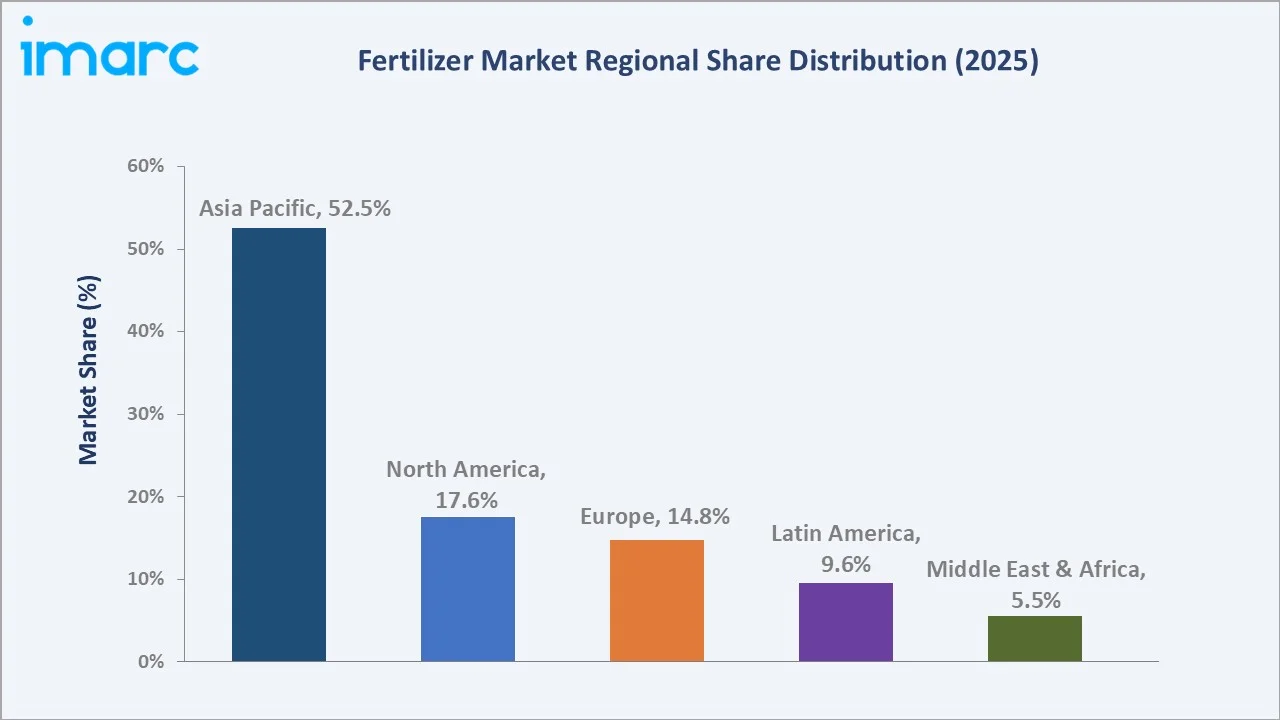
North America's 17.6% share (2025) is anchored by the U.S. corn belt's nitrogen intensity and Canada's expanding canola acreage. The U.S. fertilizer market benefited from the Inflation Reduction Act's (IRA) climate-smart agriculture funding, a portion of which supports precision fertilizer application technology adoption through USDA EQIP cost-share programs for farmers implementing 4R nutrient stewardship.
Latin America at 9.6% (2025) is the most dynamically growing developed market region. Brazil imported 38.3 million tons of fertilizers between January and October of 2025, driven by soybean, corn, sugarcane, and coffee cultivation expansion.
Competitive Landscape
The global fertilizer market is moderately concentrated at the production tier, with the top five companies, Nutrien, Yara International, The Mosaic Company, CF Industries, and IFFCO, collectively accounting for approximately 22–26% of global fertilizer revenues.
|
Company Name |
Key Brands/ Product Line |
Market Position |
Core Strength |
|
Nutrien Ltd |
Potash, Nitrogen, Phosphate |
Market Leader |
World's largest potash and second largest nitrogen producer |
|
Yara International ASA |
YaraBela, YaraMila, YaraLiva, YaraVita |
Market Leader |
Leading nitrogen and crop nutrition solutions, digitally enabled precision farming tools |
|
The Mosaic Company |
MicroEssentials, Pegasus, Aspire |
Strong Challenger |
World's largest phosphate and potash producer, strong Brazil position |
|
CF Industries Holdings |
Ammonia, Granular Urea, Urea Ammonium Nitrate, Ammonium Nitrate |
Strong Challenger |
North America's largest nitrogen fertilizer manufacturer |
|
SQM (Sociedad Química y Minera) |
Ultrasol, Qrop, Allganic, Speedfol |
Established |
World's second-largest lithium and iodine producer; dominant in potassium nitrate and specialty fertilizers |
|
IFFCO |
Water Soluble Fertilizers, Organic and Bio-Fertilizers, Nano Fertilizers |
Cooperative Leader |
India's largest fertilizer cooperative, pioneered nano urea liquid fertilizer |
|
Haifa Group |
Multi-K Potassium Nitrate Fertilizers, Water Soluble Fertilizers, Controlled Release Fertilizers, Granular NPK |
Niche Specialist |
Potassium nitrate and controlled-release fertilizer leader, horticultural crop focus |
|
Uralkali |
Pink and white muriate of potash (MOP) |
Regional Leader |
One of the world's largest potash producers |
The market's fragmentation at the distribution and retail tier is much higher, with thousands of regional blenders, cooperative distributors, and agri-input dealers competing on service, credit terms, and agronomic advisory rather than product differentiation.
Key Company Profiles
Nutrien Ltd
Nutrien is the world's largest producer of potash and the second-largest producer of nitrogen fertilizers globally, operating potash, nitrogen, and phosphate facilities.
- Product Portfolio: Potash, Nitrogen, Phosphate.
- Recent Developments: In November 2023, CoteX Technologies and Nutrien entered into a Memorandum of Understanding (MOU) to explore the joint commercialization of a coating technology to produce an affordable, environmentally-friendly nitrogen fertilizer solution for large acreage crops in the North American market.
- Strategic Focus: Low-carbon potash and nitrogen leadership, digital agronomy platform expansion, South American retail network buildout, blue/green ammonia commercialization.
Yara International ASA
Yara International is the world's leading nitrogen fertilizer company and a pioneer in crop nutrition solutions.
- Product Portfolio: YaraBela, YaraMila, YaraLiva, YaraVita.
- Recent Developments: In May 2023, Yara International is building a new global production plant for specialty crop nutrition products and biostimulants designed to increase yields and improve quality.
- Strategic Focus: Green and blue ammonia transition; digital precision nutrition tools; high-value crop specialty fertilizer expansion; climate-positive operations by 2030 through CCS and renewable energy integration at production sites.
The Mosaic Company
Mosaic is one of the world's largest integrated producers of concentrated phosphate and potash.
- Product Portfolio: MicroEssentials, Pegasus, Aspire.
- Recent Developments: In December 2024, Saudi Arabian Mining Co. (Maaden) successfully acquired all shares held by Mosaic Phosphates BV in Ma'aden Wa'ad Al Shamal Phosphate Co., along with the associated marketing rights for phosphate and fertilizer products.
- Strategic Focus: Premium branded phosphate differentiation (MicroEssentials), Brazil agribusiness expansion, innovation in phosphate sustainability and mine efficiency, Ma'aden partnership for Middle East fertilizer market development.
CF Industries Holdings
CF Industries is one of the world’s largest nitrogen fertilizer manufacturers, operating nine world-scale manufacturing complexes in the U.S., Canada, and UK.
- Product Portfolio: Ammonia, Granular Urea, Urea Ammonium Nitrate, Ammonium Nitrate.
- Recent Developments: Entered ammonia export partnership for Asian energy market supply.
- Strategic Focus: North American nitrogen market share defense, blue/green ammonia commercialization for export to Asian energy and hydrogen markets, CCS integration across all major production sites by 2030.
Market Concentration Analysis
The global fertilizer market exhibits moderate concentration at the production tier and high fragmentation at the distribution and end-market tier. The top five producers collectively control approximately 22–26% of global fertilizer revenues. This concentration is lower than many commodity chemical markets due to state-owned enterprise participation.
The potash market exhibits the highest concentration, controlling approximately 68% of global potash production capacity. The nitrogen market is less concentrated, reflecting the geographic distribution of natural gas feedstock and the relatively lower capital requirements for urea versus potash mining.
Consolidation activity has accelerated since 2020. The specialty fertilizer subsegment, including biofertilizers, controlled-release products, and water-soluble fertilizers, remains highly fragmented, presenting roll-up opportunities for well-capitalized acquirers.
Investment & Growth Opportunities
Fastest Growing Segments
Biofertilizers growing at a CAGR of ~4.8%, liquid fertilizers for fertigation at a CAGR of ~4.2%, and controlled-release fertilizers at a CAGR of ~6.8% represent the three highest-growth investment vectors through 2034. The nano fertilizer subsegment, representing perhaps the most disruptive technology investment opportunity within the broader fertilizer value chain.
Emerging Market Expansion
Sub-Saharan Africa represents the most structurally underpenetrated fertilizer market globally. With average application rates of 17 kg/ha versus a global average of 136 kg/ha, and the AU's target to fertilizer usage by 2035.
Venture Investment Trends
The investments signal investor conviction that biological and digital solutions will erode conventional fertilizer volumes at the margin.
- Key growth bets: Nano-fertilizer platforms, biostimulant-fertilizer co-formulations, green ammonia production, and carbon-credit-generating precision fertilization technology businesses.
- ESG-aligned investors are specifically targeting fertilizer companies with credible decarbonization roadmaps, Polysulphate and potassium nitrate producers (naturally lower carbon footprint), and biofertilizer companies enabling farmer transition to lower-emission cropping systems.
- Strategic private equity is actively consolidating specialty fertilizer distribution networks in Brazil, India, and Southeast Asia, where fragmented agri-input dealer markets offer attractive roll-up economics and digital platform integration opportunities.
Future Market Outlook (2026-2034)
The global fertilizer market is set for steady, demand-driven growth through 2034. From USD 187.90 Billion in 2025, the market is forecast to reach USD 248.00 Billion by 2034, an absolute value addition of USD 60.1 Billion over nine years. This growth is anchored by two structural certainties: global population expansion requiring more food production per unit of arable land, and the irreplaceable role of balanced plant nutrition in achieving yield targets that sustain agricultural GDP in developing and developed economies alike.
Between 2026 and 2030, the dominant transformation will be the bifurcation of the fertilizer market into commodity and precision/specialty tiers. The commodity tier, bulk urea, DAP, MOP, will grow at or below GDP rates, with price cycles driven by energy costs and geopolitical supply disruptions. The specialty and precision tier, nano fertilizers, controlled-release products, biofertilizers, and digital agronomy services, will grow, capturing a disproportionate share of farmer value added.
Research Methodology
Primary Research
Primary research included structured interviews with over 170 industry stakeholders in 2025, comprising fertilizer executives, agronomists, farm cooperative managers, government agricultural officials, and financial analysts covering the agri-input sector across North America, Europe, Asia Pacific, Latin America, and the Middle East. Primary insights validated market sizing, segment shares, and identified technology transition dynamics not visible in secondary data alone.
Secondary Research
Secondary research encompassed a comprehensive review of company annual reports, IFA fertilizer trade statistics, FAO food and agriculture databases, USDA NASS and FAS data, national agricultural ministry production records, trade publications, and regulatory documents across 40 countries. Over 310 secondary sources were triangulated and cross-validated.
Forecasting Models
Market size and segmentation forecasts were developed using a hybrid bottom-up and top-down methodology. Key input variables include population and food demand projections, crop acreage expansion data, government subsidy program budgets, energy price trajectories, and biofertilizer adoption rate scenarios.
Fertilizer Market Report Scope:
| Report Features | Details |
|---|---|
| Base Year of the Analysis | 2025 |
| Historical Period | 2020-2025 |
| Forecast Period | 2026-2034 |
| Units | Billion USD |
| Scope of the Report |
Exploration of Historical Trends and Market Outlook, Industry Catalysts and Challenges, Segment-Wise Historical and Future Market Assessment:
|
| Product Types Covered | Chemical Fertilizer, Biofertilizers |
| Products Covered |
|
| Product Forms Covered | Dry, Liquid |
| Crop Types Covered | Grains And Cereals, Pulses And Oilseeds, Fruits And Vegetables, Flowers And Ornamentals, Others |
| Regions Covered | Asia Pacific, Europe, North America, Latin America, Middle East and Africa |
| Countries Covered | United States, Canada, Germany, France, United Kingdom, Italy, Spain, Russia, China, Japan, India, South Korea, Australia, Indonesia, Brazil, Mexico |
| Companies Covered | Nutrien Ltd, Yara International ASA, The Mosaic Company, CF Industries Holdings, SQM (Sociedad Química y Minera), IFFCO, Haifa Group, Uralkali etc. |
| Customization Scope | 10% Free Customization |
| Post-Sale Analyst Support | 10-12 Weeks |
| Delivery Format | PDF and Excel through Email (We can also provide the editable version of the report in PPT/Word format on special request) |
Key Benefits for Stakeholders:
- IMARC’s report offers a comprehensive quantitative analysis of various market segments, historical and current market trends, market forecasts, and dynamics of the fertilizer market from 2020-2034.
- The research study provides the latest information on the market drivers, challenges, and opportunities in the global fertilizer market.
- The study maps the leading, as well as the fastest-growing, regional markets. It further enables stakeholders to identify the key country-level markets within each region.
- Porter's Five Forces analysis assists stakeholders in assessing the impact of new entrants, competitive rivalry, supplier power, buyer power, and the threat of substitution. It helps stakeholders to analyze the level of competition within the fertilizer industry and its attractiveness.
- Competitive landscape allows stakeholders to understand their competitive environment and provides an insight into the current positions of key players in the market.
Frequently Asked Questions About the Fertilizer Market Report
The global fertilizer market was valued at USD 187.90 Billion in 2025 and is projected to reach USD 248.00 Billion by 2034, growing at a CAGR of 3.04%.
Asia Pacific dominates with a 52.5% revenue share (2025), anchored by massive fertilizer consumption in China, India, and Indonesia for rice, wheat, and palm oil production.
Latin America is the fastest growing region at ~3.8% CAGR, driven by Brazil's soybean/sugarcane expansion, zero import tariffs, and the National Fertilizer Plan investments through 2034.
Key drivers include rising global food demand, government subsidies, precision agriculture adoption, and expansion of arable land in Asia and Latin America.
Chemical fertilizers dominate with a 66.6% share (2025), driven by nitrogenous fertilizers’ essential role in cereal crop production. Global urea demand exceeded 185.7 million tons by 2025.
Biofertilizers are the fastest growing product type at approximately 4.8% CAGR, driven by EU Farm to Fork Strategy, organic farming growth, and regulatory restrictions on synthetic inputs.
The leading companies include Nutrien Ltd, Yara International ASA, The Mosaic Company, CF Industries Holdings, SQM (Sociedad Química y Minera), IFFCO, Haifa Group, and Uralkali.
Dry fertilizers hold 81.8% market share (2025), with granular urea, DAP, and MOP dominating.
Key trends include nano-fertilizer adoption (IFFCO Nano Urea), green/blue ammonia transition, digital precision nutrition platforms, biostimulant integration, and carbon-credit-linked fertilizer programs.
Key challenges include raw material price volatility (gas prices impact nitrogen costs), EU nitrates regulations reducing demand, import/export restrictions, soil acidification, and supply chain concentration risks.
High-growth opportunities include nano-fertilizers, biofertilizer technology, green ammonia production, Sub-Saharan Africa market development, and digital precision agronomy platforms generating recurring SaaS-style revenue.
Need more help?
- Speak to our experienced analysts for insights on the current market scenarios.
- Include additional segments and countries to customize the report as per your requirement.
- Gain an unparalleled competitive advantage in your domain by understanding how to utilize the report and positively impacting your operations and revenue.
- For further assistance, please connect with our analysts.
 Request Customization
 Speak to an Analyst
 Request Brochure
 Inquire Before Buying
Benefits of Customization
- Personalize this research
- Triangulate with your data
- Get data as per your format and definition
- Gain a deeper dive into a specific application, geography, customer, or competitor
- Any level of personalization
Get in Touch With Us
UNITED STATES
Phone: +1-201-971-6302
INDIA
Phone: +91-120-433-0800
UNITED KINGDOM
Phone: +44-753-714-6104
Email: [email protected]
Client Testimonials


.webp)


