
Forage Market Size, Share, Trends and Forecast by Crop Type, Product Type, Animal Type, and Region, 2026-2034
Forage Market Size, Share, Trends & Forecast (2026-2034)
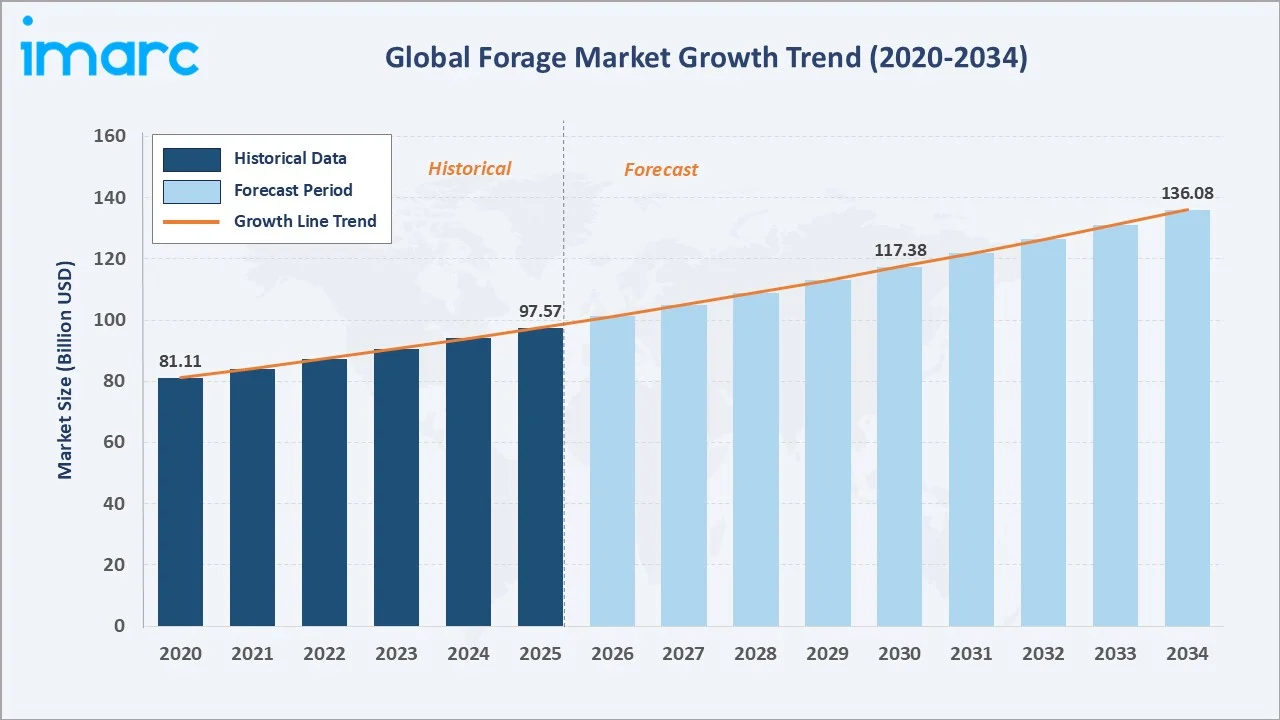
The global forage market reached USD 97.57 Billion in 2025 and is projected to reach USD 136.08 Billion by 2034, growing at a CAGR of 3.77% during 2026-2034. The market is driven by rising demand for meat and dairy products, expanding global livestock population, supportive government policies on sustainable agriculture, and the growing adoption of precision farming technologies.
Stored Forage dominates product type at 61.3%. Cereals lead crop type at 42.8%. North America commands 36.5% of global market share.
Market Snapshot
|
Metric |
Value |
|
Market Size (2025) |
USD 97.57 Billion |
|
Forecast Market Size (2034) |
USD 136.08 Billion |
|
CAGR (2026-2034) |
3.77% |
|
Base Year |
2025 |
|
Historical Period |
2020-2025 |
|
Forecast Period |
2026-2034 |
|
Dominant Product Type |
Stored Forage (61.3%, 2025) |
|
Dominant Crop Type |
Cereals (42.8%, 2025) |
|
Leading Region |
North America (36.5%, 2025) |
The market expanded from USD 81.11 Billion in 2020 to USD 97.57 Billion in 2025, growing steadily through rising livestock population and increasing meat and dairy consumption globally. The forecast trajectory anchors at approximately USD 117.38 Billion in 2030, reaching USD 136.08 Billion by 2034.
To get more information on this market, Request Sample
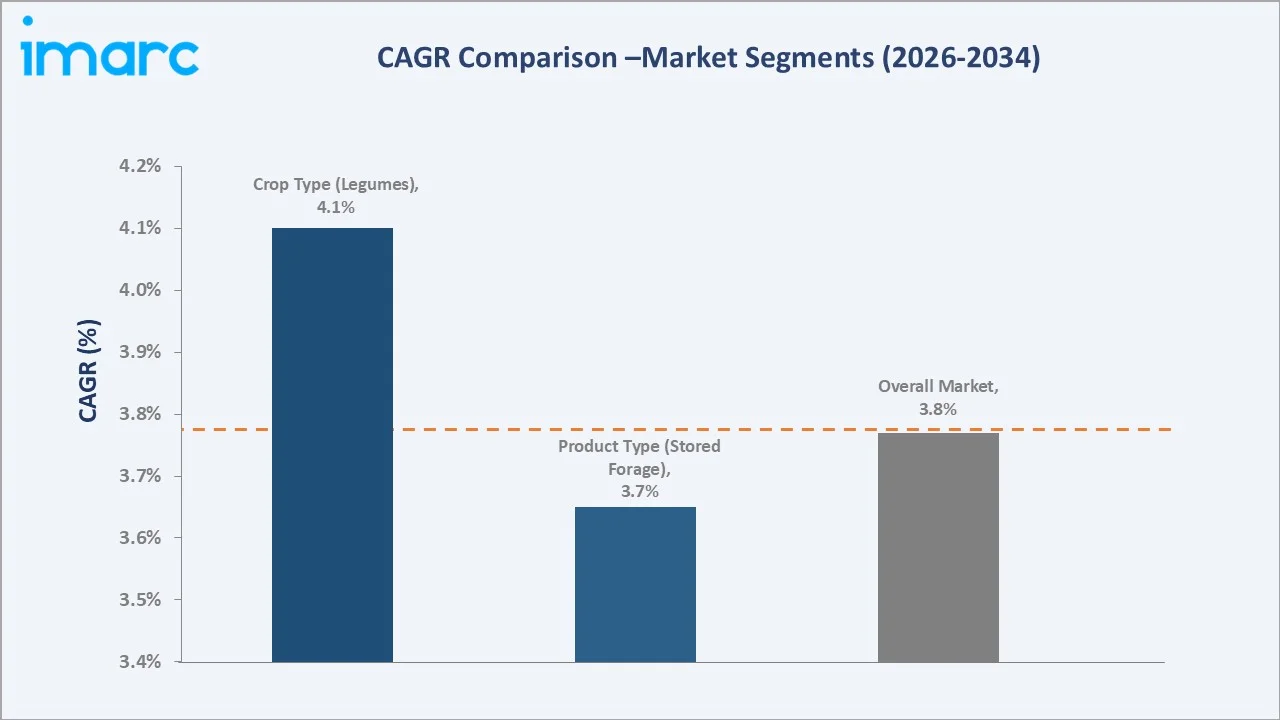
Stored forage grows steadily at ~3.65% CAGR through sustained silage and hay demand for ruminant livestock. Legumes grow fastest at ~4.10% CAGR driven by protein-rich feed demand for intensive livestock operations.
Executive Summary
The global forage market reached by 2034 at a CAGR of 3.77%.
Stored Forage at 61.3% dominates by providing year-round feed security through silage and hay. Cereals at 42.8% lead crop type through the highest yield and energy density in livestock diets. North America at 36.5% leads globally through the United States' large-scale beef and dairy cattle operations and advanced commercial forage infrastructure.
Key Market Insights
|
Insight |
Data |
|
Dominant Product Type |
Stored Forage – 61.3% share (2025) |
|
Dominant Crop Type |
Cereals – 42.8% market share (2025) |
|
Leading Region |
North America – 36.5% market share (2025) |
|
Market Opportunity |
Drought-resistant crop development; organic forage certification; precision harvesting; stored forage cold-chain expansion |
Key Analytical Observations Supporting the Above Data:
- Stored Forage at 61.3%: Stored forage dominates as it enables year-round livestock feed supply through silage, hay, and haylage, decoupling forage availability from seasonal growing conditions. Its critical role in dairy and beef cattle operations in North America and Europe sustains its dominant position globally.
- Cereals at 42.8%: Cereals lead the forage crop type segment due to their high dry matter yield, energy density, and versatility across ruminant diets. Maize silage and cereal grain forages are integral to intensive dairy and beef production systems worldwide, delivering the highest metabolizable energy per unit of forage.
- North America at 36.5%: North America leads through the United States' massive beef and dairy cattle herd, which generates the world's highest per-country demand for commercial forage. The region's advanced forage production, storage, and distribution infrastructure further reinforces its market leadership position.
Forage Market Overview
The global forage market encompasses the production, processing, storage, distribution, and consumption of all plant materials grown or harvested for livestock feed, including stored forage (silage and hay) and fresh forage, across crop types including cereals, grasses, and legumes.
The ecosystem integrates seed input suppliers, forage crop producers, harvesting and storage operators, quality testing laboratories, logistics and distribution networks, and end-use livestock operations including dairy farms, beef cattle ranches, sheep stations, and mixed livestock enterprises. Macroeconomic factors include rising global protein consumption, government agricultural subsidies, climate variability, and investments in sustainable farming technology.
Market Dynamics
To evaluate market opportunities, Request Sample
Market Drivers
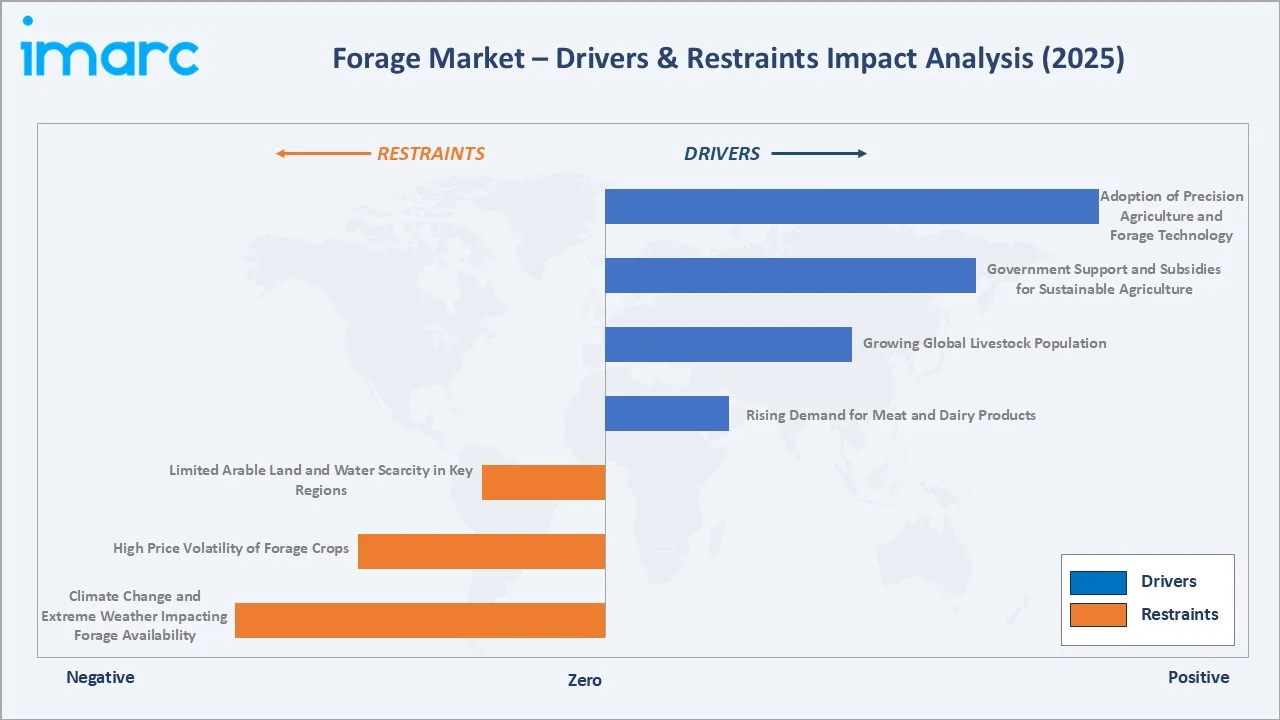
- Rising Demand for Meat and Dairy Products: The escalating global demand for high-quality meat and dairy products is the primary demand driver for forage, as it is a key ingredient in the diet of livestock. Growing population and rising income levels in developing economies are expanding livestock production, requiring higher forage volumes for animal nutrition and productivity.
- Growing Global Livestock Population: The expanding global livestock population, particularly ruminant cattle and sheep, directly increases forage demand. The January U.S. Cattle Inventory report shows the cattle inventory on January 1, 2026, was 86.2 million head, each requiring substantial daily forage intake for productive dairy output and beef growth, creating a persistent and compounding forage demand base.
- Government Support and Subsidies for Sustainable Agriculture: Government policies supporting sustainable forage production through subsidies, research funding, and agri-environmental schemes are accelerating market growth. Programs such as the EU Common Agricultural Policy and USDA conservation initiatives incentivize forage crop expansion and best-practice adoption among commercial producers.
- Adoption of Precision Agriculture and Forage Technology: Precision agriculture tools including GPS-guided harvesting, drone-based canopy monitoring, and soil moisture sensors are improving forage yields and quality. Advanced silage additives and improved hay preservation technologies are reducing spoilage and improving nutritional value retention, increasing commercial forage value.
Market Restraints
- Climate Change and Extreme Weather Impacting Forage Availability: Climate change is creating increased frequency of droughts, floods, and heatwaves that severely impact forage crop yields. Erratic rainfall patterns and temperature extremes reduce both the quantity and quality of available forage, creating supply volatility that constrains livestock operations and market growth.
- High Price Volatility of Forage Crops: Forage markets are subject to significant price volatility due to weather-induced production variability, energy cost fluctuations for harvesting and storage, and commodity market dynamics. Price instability constrains livestock producer planning, investment, and profitability across the supply chain.
- Limited Arable Land and Water Scarcity in Key Regions: Competition for arable land from food crop production and urbanization, combined with water scarcity in key forage-producing regions, restricts capacity expansion. Water-intensive forage crops face growing regulatory and operational constraints in semi-arid and water-stressed agricultural regions globally.
Market Opportunities
- Drought-Resistant Forage Crop Development: Advances in plant biotechnology are enabling the development of drought-tolerant and water-efficient forage cultivars. These innovations can expand forage production into arid and semi-arid regions while maintaining yield under climate stress, broadening the commercially productive forage acreage base.
- Organic and Sustainable Forage Certification: Rising consumer demand for organic and sustainably produced animal products is creating premium market opportunities for certified organic forage producers. Organic forage commands significant price premiums over conventional production while benefiting from growing retailer and consumer demand for traceable sustainable inputs.
Market Challenges
- Forage Nutritional Quality Consistency Across Seasons: Maintaining consistent forage nutritional quality across seasons and geographies remains technically challenging. Variability in protein content, digestibility, and energy values affects livestock productivity and creates procurement challenges for large-scale commercial operations.
- Supply Chain Fragmentation in Emerging Markets: Forage supply chains in emerging markets remain highly fragmented, with inadequate cold-chain storage, limited logistics infrastructure, and significant post-harvest losses. This fragmentation constrains market efficiency and restricts commercial-scale forage trading in high-growth regions.
Emerging Market Trends
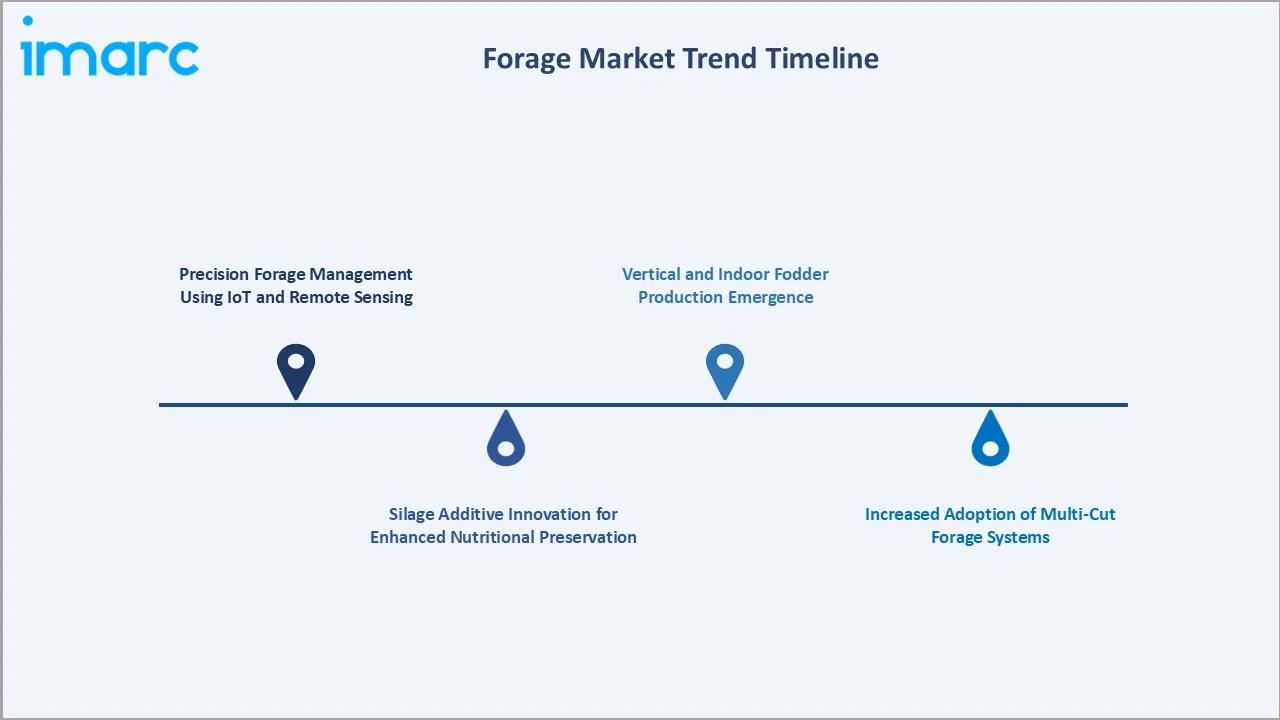
1. Precision Forage Management Using IoT and Remote Sensing
IoT-connected soil sensors, satellite imagery, and drone-based canopy analysis are enabling precision forage management at field level. These technologies optimize irrigation, fertilization, and harvest timing to maximize both yield and nutritional quality across diverse growing environments.
2. Silage Additive Innovation for Enhanced Nutritional Preservation
Advanced biological and chemical silage additives are improving fermentation quality and reducing dry matter losses during the storage phase. Inoculant technologies using specific lactobacillus strains are becoming standard practice in high-performance dairy operations across North America and Europe.
3. Increased Adoption of Multi-Cut Forage Systems
Multi-cut forage management systems enabling 4–6 harvests annually from perennial ryegrass and lucerne swards are expanding in Europe and North America. These systems significantly increase annual dry matter yield per hectare while improving nutritional quality and reducing crop maturation losses.
4. Vertical and Indoor Fodder Production Emergence
Hydroponic fodder production systems are emerging as supplementary forage sources in water-scarce and land-constrained regions. Barley and wheat grass grown in controlled environments offer high-quality green fodder with substantially reduced land and water requirements compared to conventional field production.
Industry Value Chain Analysis
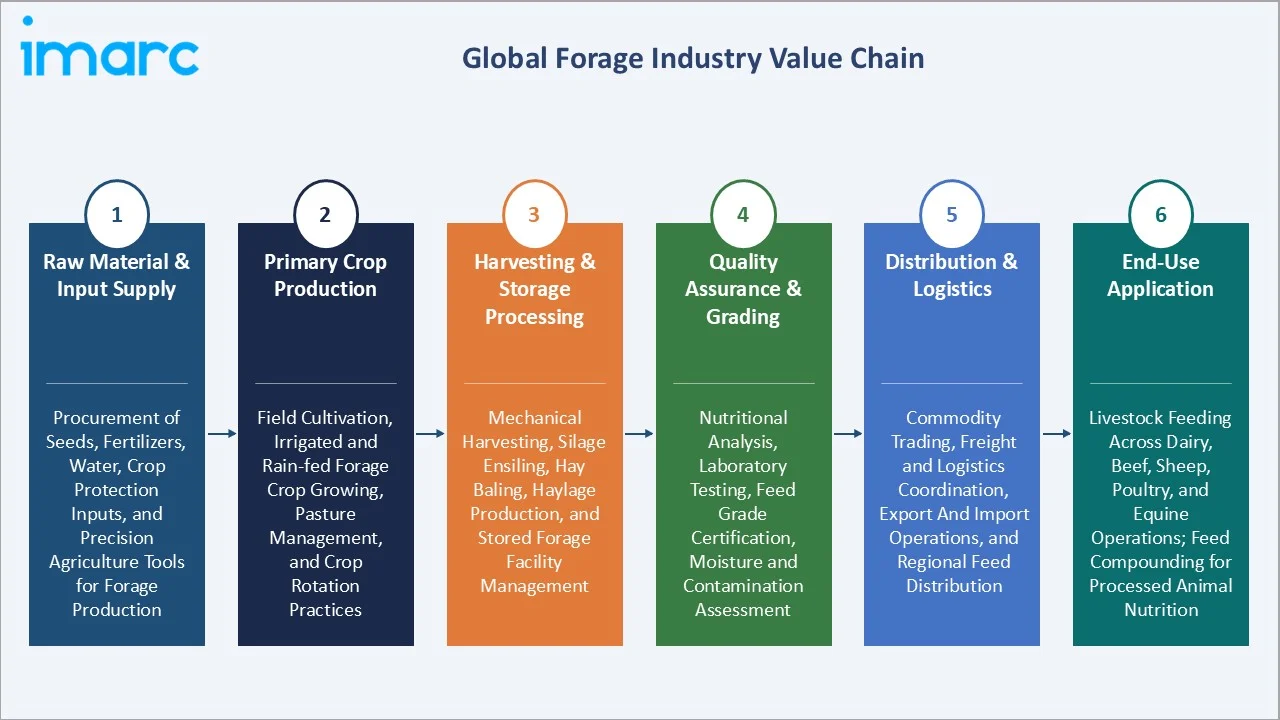
The forage value chain integrates seed and agricultural input supply, primary forage crop production, post-harvest processing and storage, quality assurance and grading, distribution logistics, and final livestock end-use. The chain is characterised by progressive consolidation at the storage and processing stages alongside enduring fragmentation at the production level.
|
Stage |
Key Activities & Participants |
|
Raw Material & Input Supply |
Procurement of seeds, fertilizers, water, crop protection inputs, and precision agriculture tools for forage production |
|
Primary Crop Production |
Field cultivation, irrigated and rain-fed forage crop growing, pasture management, and crop rotation practices |
|
Harvesting & Storage Processing |
Mechanical harvesting, silage ensiling, hay baling, haylage production, and stored forage facility management |
|
Quality Assurance & Grading |
Nutritional analysis, laboratory testing, feed grade certification, moisture and contamination assessment |
|
Distribution & Logistics |
Commodity trading, freight and logistics coordination, export and import operations, and regional feed distribution |
|
End-Use Application |
Livestock feeding across dairy, beef, sheep, poultry, and equine operations; feed compounding for processed animal nutrition |
The raw material and input supply stage is the forage value chain's most innovation-intensive tier, with seed genetics and precision inputs driving yield and quality improvements. The storage and processing tier is experiencing significant technology investment through advanced silage management systems, while climate resilience considerations are reshaping investment across all upstream and midstream stages.
Technology Landscape in the Forage Industry
Forage Preservation Technology (Silage & Hay)
Advanced silage preservation technologies, including biological inoculants, organic acid preservatives, and vacuum-sealed bale wrapping, are significantly improving forage nutritional retention during storage. These technologies reduce dry matter losses from 20–30% in conventional systems to under 5–8% in optimised operations, delivering measurable improvements in livestock feed efficiency and producer returns.
Precision Harvesting and Forage Analytics
GPS-guided forage harvesters, near-infrared (NIR) spectroscopy for real-time nutritional analysis during harvest, and automated bale management systems are transforming commercial forage operations. NIR on-combine analysis enables real-time feed quality mapping across fields, allowing producers to segregate forage by nutritional grade and optimise livestock diet formulation accordingly.
Biotechnology in Forage Crop Development
Significant advances in forage crop genomics have enabled the development of improved alfalfa, ryegrass, and maize silage hybrids with higher digestibility, drought tolerance, and winter hardiness. CRISPR-based gene editing is emerging as a targeted tool for improving forage nutritional profiles, with particular focus on reducing bloat risk in legume-based pastures and improving fibre digestibility in grass-based systems.
Digital Farm Management and Forage Decision Platforms
Integrated digital farm management platforms are increasingly incorporating forage-specific modules that combine field data, weather forecasting, soil analysis, and livestock nutrition modelling into unified decision support systems. In 2025, leading agricultural software providers have deployed AI-driven forage yield prediction tools that integrate satellite-derived biomass estimates with farm-level management records, enabling producers to optimise cutting schedules, inventory levels, and feed purchasing decisions. These platforms are reducing forage procurement costs and improving year-round feed planning accuracy for large commercial livestock operations.
Market Segmentation Analysis
The report covers the following segments:
|
Segment Category |
Leading Segment |
Market Share |
Year |
|
Product Type |
Stored Forage |
61.3% |
2025 |
|
Crop Type |
Cereals |
42.8% |
2025 |
|
Animal Type |
Ruminants |
🔒 |
2025 |
|
Region |
North America |
36.5% |
2025 |

By Product Type
Stored Forage leads at 61.3% in 2025, encompassing silage, hay, haylage, and other preserved forage forms that enable year-round livestock feed supply independent of seasonal production cycles. Stored forage's dominance reflects the structural feed management requirements of intensive dairy and beef operations globally, which depend on reliable year-round nutritional supply for productive performance.
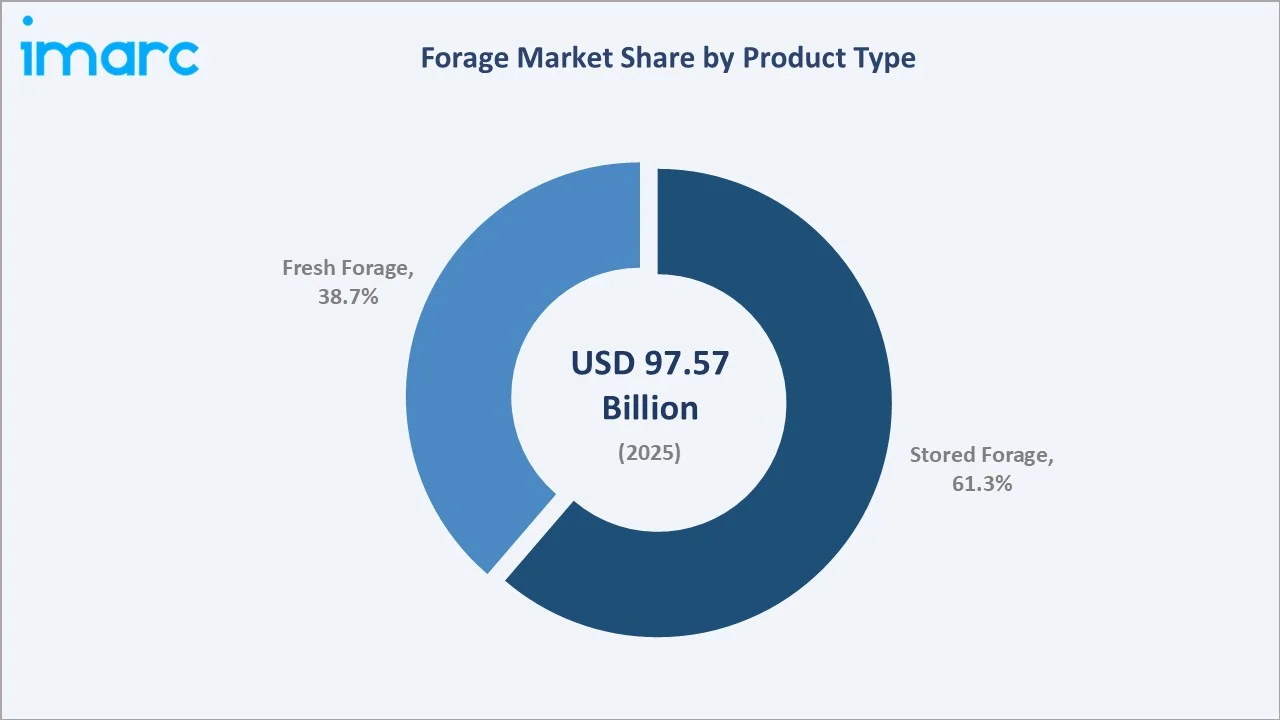
To access detailed market analysis, Request Sample
Fresh Forage at 38.7% captures grazing and cut-and-carry forage systems prevalent in pastoral livestock operations. Fresh forage is preferred in grass-fed and organic production systems for its higher nutritional bioavailability and lower production costs. The growing premium grass-fed beef and dairy segments are supporting fresh forage demand, particularly in New Zealand, Australia, Ireland, and Latin America.
By Crop Type
Cereals lead at 42.8% through their high energy density, superior dry matter yield per hectare, and versatility across dairy, beef, and mixed livestock diets. Maize silage is the dominant cereal forage globally, providing high metabolizable energy critical for milk production in high-output dairy cows. Cereal forage demand is anchored by intensive dairy farming in North America and Europe where energy-dense diets are essential for productive performance.
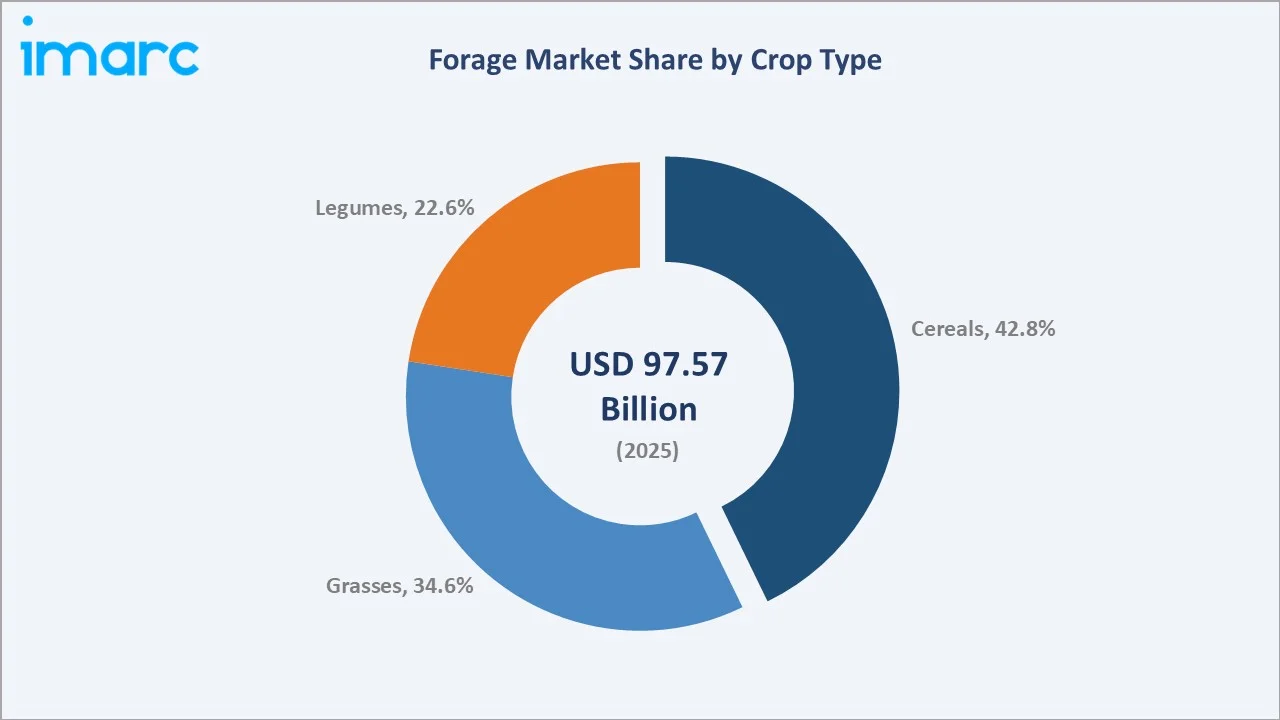
Grasses at 34.6% represent the primary pasture-based forage category, encompassing perennial ryegrass, bermudagrass, fescue, and cultivated grass species central to extensive and mixed farming systems. Legumes at 22.6% provide high-protein forage critical for ruminant productivity, growing fastest at ~4.10% CAGR through increasing demand for protein-rich livestock nutrition in intensive operations.
Regional Market Insights
|
Region |
Share (2025) |
Key Market Characteristics |
|
North America |
36.5% |
Large-scale commercial livestock operations, advanced forage production and storage infrastructure, strong export markets, and high technology adoption in precision agriculture and forage management |
|
Europe |
24.8% |
Intensive dairy farming, strong policy support through agri-environmental programmes, sustainable forage mandates, and advanced silage technology adoption across key producing countries |
|
Asia-Pacific |
21.6% |
Expanding commercial livestock and dairy production, rising demand for high-quality animal nutrition, growing government investment in agricultural modernisation and forage supply chain development |
|
Latin America |
10.3% |
Extensive pasture-based livestock systems, large beef cattle operations, tropical grass and legume forage cultivation, and growing commercial hay and silage production |
|
Middle East & Africa |
6.8% |
Growing livestock intensification programmes, import-dependent forage trade, increasing investment in irrigated forage production and feed security infrastructure |
North America at 36.5% leads through the United States' dominant commercial hay and silage industry, advanced forage storage technology, and large beef and dairy cattle herd base. Europe at 24.8% reflects dense dairy farming concentration and strong policy support for sustainable forage production across member states.
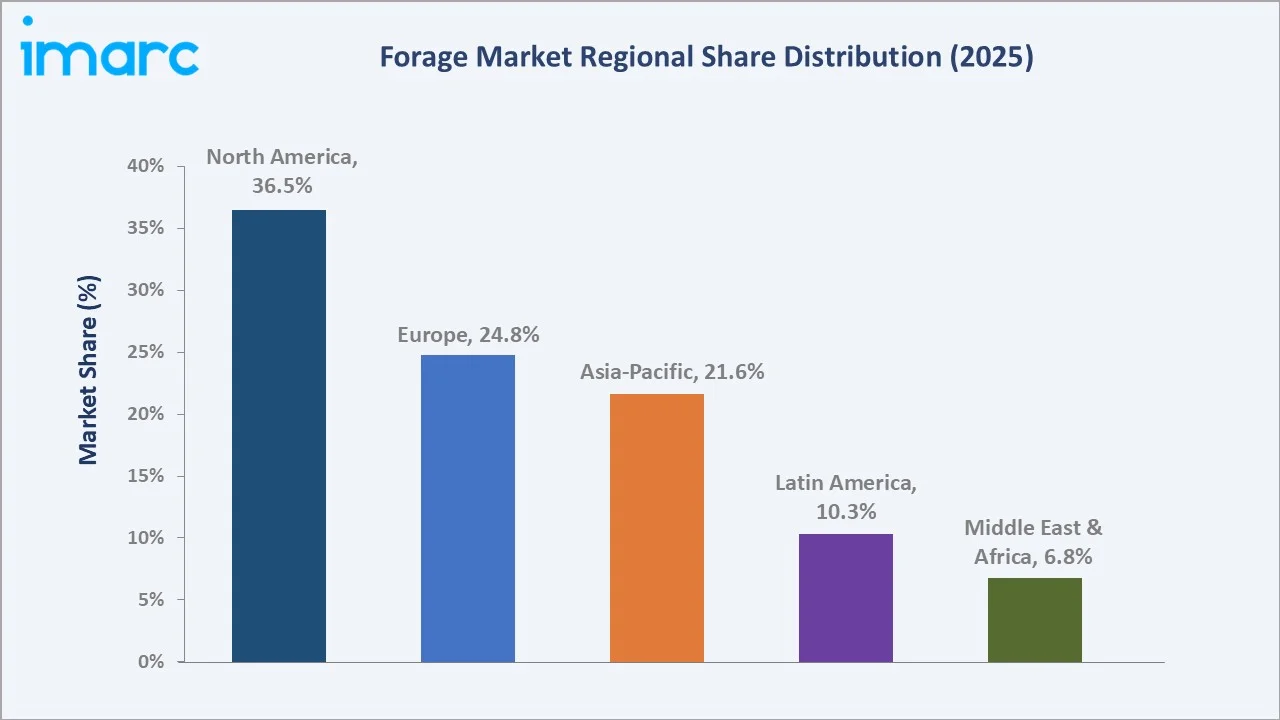
Asia-Pacific at 21.6% is the fastest-growing region as China, India, and Vietnam expand commercial dairy and livestock operations alongside rising feed quality standards. Latin America at 10.3% is driven by Brazil's extensive grass-fed beef production. Middle East & Africa at 6.8% represents an emerging growth market supported by Gulf livestock intensification and food security investment programmes.
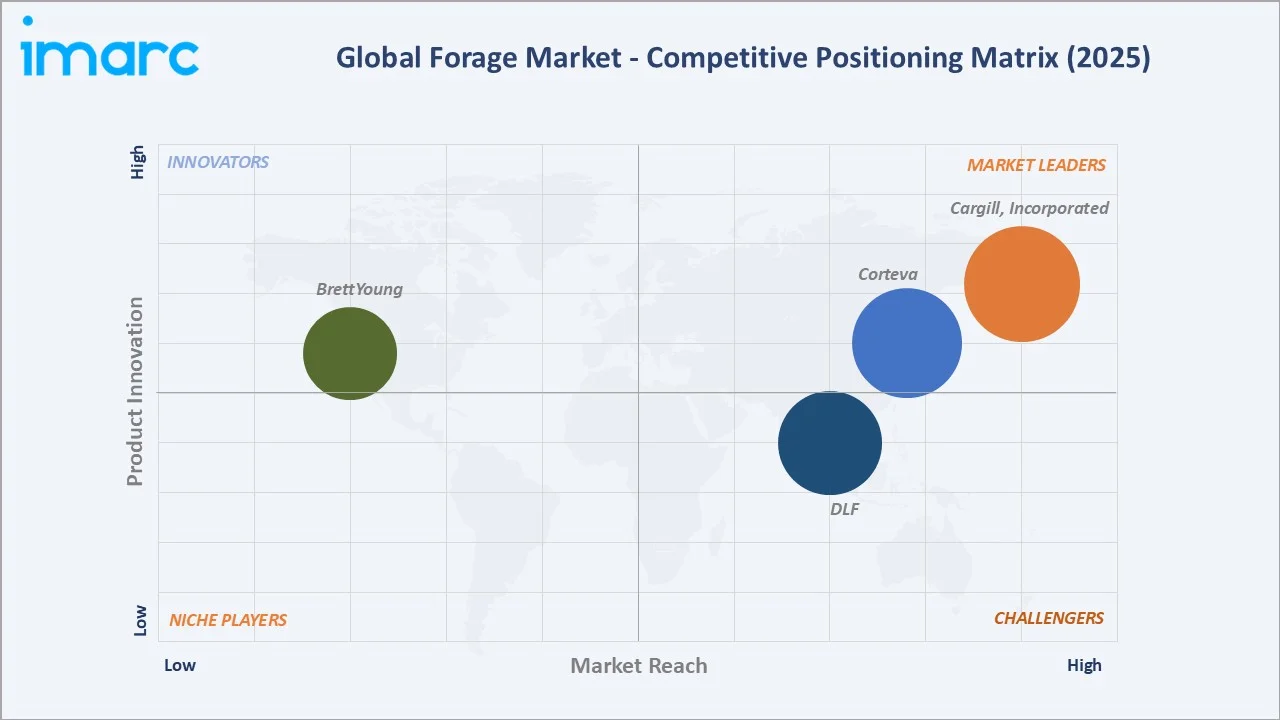
Competitive Landscape
The global forage market competitive landscape is moderately fragmented, with regional seed companies, global agribusiness players, and specialised forage product companies competing across product type and geographic dimensions. Major players are investing in research and development to develop crops with higher nutritional content and venturing into new markets to strengthen their competitive position.
|
Company Name |
Key Products |
Market Position |
Core Strength |
|
Cargill, Incorporated |
Promote Forage-Mate |
Market Leader |
Global scale in animal nutrition and forage supply chain integration across key livestock markets |
|
Corteva |
Bovalta BMR Corn Silage, Brevant seeds |
Market Leader |
Leading forage genetics and silage corn hybrid innovation with global commercial reach |
|
DLF |
CutMax Alfa Protein, CutMax Alfa Protein HOT&DRY, CutMax Alfa Super, CutMax Clover Protein, CutMax Digest, CutMax Fiber Energy |
Strong Challenger |
World's largest grass and forage seed breeding enterprise with broad variety portfolio |
|
BrettYoung |
Alfalfa, Bromegrass, Clover, Legumes, Fescue, Orchard grass, Ryegrass, Timothy, Wheatgrass |
Established |
Strong presence in Canadian and North American forage seed markets |
Key players include Cargill, Incorporated, Corteva, DLF, BrettYoung, and others.
Key Company Profiles
Cargill, Incorporated
Cargill, Incorporated is a United States-based global agribusiness company with extensive presence across the forage market through its animal nutrition division, commodity trading operations, and forage supply chain services.
- Key Products: Promote Forage-Mate, Inoculants, Aerobic Stabilizers
- Strategic Focus: Integrating forage supply chain management with precision livestock nutrition, developing proprietary silage additive technologies, and expanding sustainable forage sourcing programmes across key global markets.
Corteva
Corteva is a leading global seed and crop protection company with a dominant position in the forage genetics market through its Pioneer brand of forage corn hybrids and forage sorghum varieties, operating research stations across North America, Europe, and Latin America.
- Key Products: Bovalta BMR Corn Silage, Brevant seeds
- Strategic Focus: Advancing forage corn genetics for maximum energy density and digestibility, expanding forage variety portfolios for climate resilience, and integrating digital agronomy tools for forage yield optimisation.
DLF
DLF is a Denmark-based company and the world's largest grass and forage seed breeding enterprise, with operations spanning all major forage seed categories across global markets, maintaining an extensive network of breeding stations and commercial operations internationally.
- Key Products: CutMax Alfa Protein, CutMax Alfa Protein HOT&DRY, CutMax Alfa Super, CutMax Clover Protein, CutMax Digest, CutMax Fiber Energy
- Recent Developments: In January 2026, DLF announced a strategic partnership with Proveye to strengthen grassland and seed innovation through satellite-powered monitoring and analytics. By integrating satellite-derived measurements into its grassland research programs, DLF aims to better evaluate forage performance under real farm conditions.
- Strategic Focus: Advancing grass and legume forage breeding for nutritional performance and climate resilience, expanding organic seed certification, and strengthening commercial presence in high-growth Asia-Pacific forage seed markets.
Market Concentration Analysis
The forage market is moderately fragmented overall, with concentration varying significantly by segment. Forage seed genetics is relatively concentrated, with Corteva, DLF, and others collectively holding approximately 35–45% of commercial forage seed value globally. The broader forage production and trade market remains highly fragmented with thousands of regional producers. Market concentration is increasing in the stored forage segment through consolidation of commercial hay and silage operations, while the fresh forage segment retains high fragmentation through the dominance of farm-level grazing management globally.
Investment & Growth Opportunities
Highest Growth Segments
Legume forage crop expansion (~4.10% CAGR), fresh forage in grass-fed and organic production systems (~3.95% CAGR), Asia-Pacific commercial forage development, drought-resistant forage seed genetics, silage additive technology, precision forage harvesting equipment, and vertically integrated commercial forage operations represent the highest-growth investment vectors through 2034.
Emerging Investment Opportunities
Commercial-scale certified organic forage production represents a high-value growth opportunity as organic livestock product premiums increase. Organic forage commands price premiums of 30–50% over conventional production, creating attractive returns for early movers in certified organic alfalfa and grass forage markets, particularly in North America and Western Europe.
Investment Themes
- Forage biotechnology for climate-resilient cultivars: Development of drought-tolerant and heat-resistant forage cultivars through genomic selection and precision breeding represents a high-return investment priority. Climate-resilient varieties command premium pricing while expanding the addressable production acreage in semi-arid regions.
- Stored forage cold-chain infrastructure in Asia-Pacific: Investment in commercial silage and hay storage infrastructure in China, India, and Vietnam captures structurally growing demand from expanding commercial dairy operations in the region, addressing a critical gap in Asia-Pacific livestock production supply chains.
Future Market Outlook (2026-2034)
The global forage market is projected to grow from USD 97.57 Billion in 2025 to USD 136.08 Billion by 2034, delivering a 3.77% CAGR over the forecast period. The market's anchor value of approximately USD 117.38 Billion in 2030 reflects a steadily growing commodity market underpinned by irreversible secular trends in global protein consumption and livestock production intensification.
Stored forage will maintain dominance through 2034 as intensive livestock operations globally require year-round feed security. Legume forage growth will accelerate as protein-rich feed demand increases and sustainability considerations favour nitrogen-fixing crops. Asia-Pacific will progressively increase its market share as China and India's commercial livestock sectors continue their structural development and maturation.
Three structural forces define forage market growth through 2034 with strong confidence: the compounding growth of the global middle-class consumer base driving protein demand; the structural shift from extensive to intensive livestock production requiring commercial forage supply; and the accelerating adoption of precision forage management technologies improving yield efficiency and supply chain reliability.
Research Methodology
Primary Research
Primary research comprised structured interviews with 50+ industry stakeholders (2025), including forage farm operations managers, commercial silage and hay producers, forage seed company agronomists, livestock nutrition specialists, and agricultural input supply chain managers.
Secondary Research
Secondary research encompassed company annual reports; FAO Global Livestock Production data; USDA Agricultural Statistics Service forage production reports; European Commission Agricultural Market Situation reports; AFIA annual statistics; and forage market forecast and technology studies 2024–2025. Over 55 secondary sources were reviewed and cross-referenced.
Forecasting Models
Market revenue forecasts were developed using a livestock-production-based bottom-up model: (i) global livestock population forecast by category; (ii) average forage consumption per livestock unit; (iii) commercial forage procurement rate by geography; (iv) average forage price by product type and crop type; (v) technology premium adjustment for stored versus fresh forage pricing across regions.
Forage Market Report Scope:
| Report Features | Details |
|---|---|
| Base Year of the Analysis | 2025 |
| Historical Period | 2020-2025 |
| Forecast Period | 2026-2034 |
| Units | Billion USD |
| Scope of the Report | Exploration of Historical Trends and Market Outlook, Industry Catalysts and Challenges, Segment-Wise Historical and Future Market Assessment:
|
| Crop Types Covered | Cereals, Legumes, Grasses |
| Product Types Covered |
|
| Animal Types Covered | Ruminants, Swine, Poultry, Others |
| Regions Covered | Asia Pacific, Europe, North America, Latin America, Middle East and Africa |
| Countries Covered | United States, Canada, Germany, France, United Kingdom, Italy, Spain, Russia, China, Japan, India, South Korea, Australia, Indonesia, Brazil, Mexico |
| Companies Covered | Cargill, Incorporated, Corteva, DLF, BrettYoung, etc. |
| Customization Scope | 10% Free Customization |
| Post-Sale Analyst Support | 10-12 Weeks |
| Delivery Format | PDF and Excel through Email (We can also provide the editable version of the report in PPT/Word format on special request) |
Key Benefits for Stakeholders:
- IMARC’s industry report offers a comprehensive quantitative analysis of various market segments, historical and current market trends, market forecasts, and dynamics of the forage market from 2020-2034.
- The research report provides the latest information on the market drivers, challenges, and opportunities in the global forage market.
- The study maps the leading, as well as the fastest-growing, regional markets. It further enables stakeholders to identify the key country-level markets within each region.
- Porter's five forces analysis assists stakeholders in assessing the impact of new entrants, competitive rivalry, supplier power, buyer power, and the threat of substitution. It helps stakeholders to analyze the level of competition within the forage industry and its attractiveness.
- The competitive landscape allows stakeholders to understand their competitive environment and provides insight into the current positions of key players in the market.
Frequently Asked Questions About the Forage Market Report
The global forage market reached USD 97.57 Billion in 2025, driven by stored forage dominance at 61.3%, cereals leading crop type at 42.8%, and North America commanding 36.5% market share through its large-scale beef and dairy cattle operations and advanced commercial forage production infrastructure.
The forage market grows at 3.77% CAGR during 2026-2034, reaching USD 136.08 Billion by 2034. This growth reflects rising global protein consumption, expanding livestock population, adoption of precision forage technologies, and growing demand for high-quality stored forage.
Stored Forage leads at 61.3% in 2025, encompassing silage, hay, and haylage critical for year-round livestock feed supply in intensive dairy and beef operations. Stored forage grows at ~3.65% CAGR through sustained demand from commercial livestock operations globally.
Cereals lead at 42.8% through high dry matter yield, energy density, and maize silage dominance in intensive dairy and beef production systems. Grasses follow at 34.6%, while Legumes at 22.6% grow fastest at ~4.10% CAGR through increasing protein-rich feed demand.
North America leads at 36.5% through the United States' dominant commercial hay and silage industry, world-class forage storage infrastructure, and the largest commercial beef and dairy cattle base by forage procurement value.
Leading companies include Cargill, Incorporated, Corteva, DLF, and BrettYoung, among others.
The forage market is projected to reach approximately USD 117.38 Billion by 2030, with legume forage expansion accelerating, Asia-Pacific commercial forage share growing, and stored forage technology advancing through improved silage additive and precision preservation systems.
Key investment opportunities include drought-resistant forage crop biotechnology, certified organic forage production, commercial silage infrastructure in Asia-Pacific, precision forage harvesting technology, and digital forage management platforms for large-scale livestock enterprises.
Need more help?
- Speak to our experienced analysts for insights on the current market scenarios.
- Include additional segments and countries to customize the report as per your requirement.
- Gain an unparalleled competitive advantage in your domain by understanding how to utilize the report and positively impacting your operations and revenue.
- For further assistance, please connect with our analysts.
 Request Customization
 Speak to an Analyst
 Request Brochure
 Inquire Before Buying
Benefits of Customization
- Personalize this research
- Triangulate with your data
- Get data as per your format and definition
- Gain a deeper dive into a specific application, geography, customer, or competitor
- Any level of personalization
Get in Touch With Us
UNITED STATES
Phone: +1-201-971-6302
INDIA
Phone: +91-120-433-0800
UNITED KINGDOM
Phone: +44-753-714-6104
Email: [email protected]
Client Testimonials


.webp)


