
Fructose Market Size, Share, Trends and Forecast by Product, Application, and Region 2026-2034
Fructose Market Size:
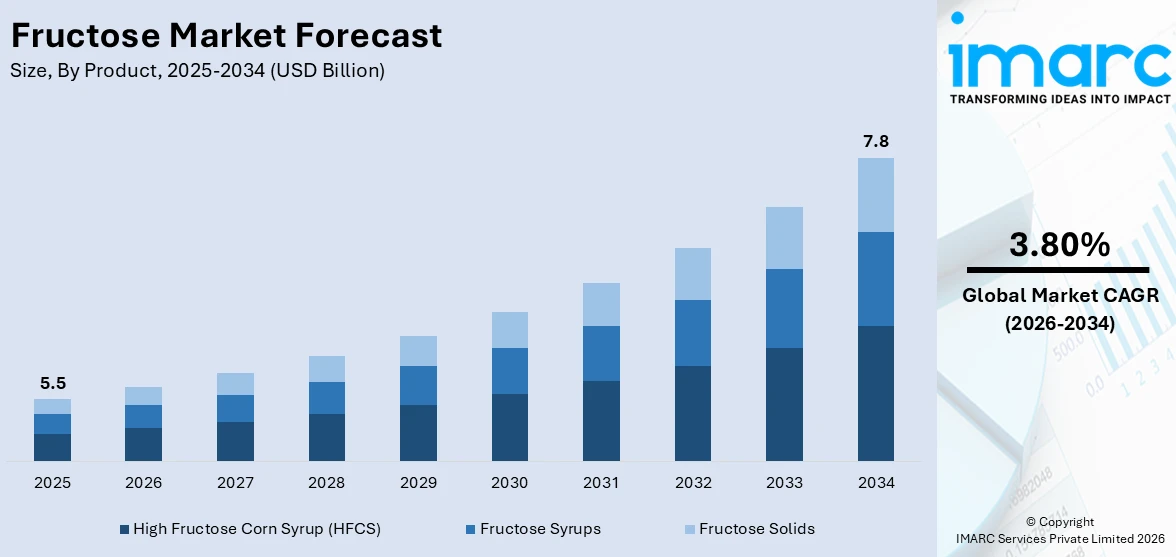
The global fructose market size was valued at USD 5.5 Billion in 2025. Looking forward, IMARC Group estimates the market to reach USD 7.8 Billion by 2034, exhibiting a CAGR of 3.80% during 2026-2034. North America currently dominates the market, holding a significant market share of over 44.9% in 2025. The market is experiencing steady growth driven by rising consumer preferences for healthier alternatives to traditional sugar, such as high-fructose corn syrup (HFCS), increasing food products and beverages that provide specific health benefits, and rising consumption of sports nutrition products.
|
Report Attribute
|
Key Statistics
|
|---|---|
|
Base Year
|
2025
|
|
Forecast Years
|
2026-2034
|
|
Historical Years
|
2020-2025
|
|
Market Size in 2025
|
USD 5.5 Billion |
|
Market Forecast in 2034
|
USD 7.8 Billion |
| Market Growth Rate 2026-2034 | 3.80% |
The global market is primarily driven by the increasing consumer demand for healthier and lower-calorie sweeteners, as fructose is considered a natural alternative to sucrose and high-fructose corn syrup. This can be attributed to the growing awareness regarding obesity and diabetes, which has accelerated the shift toward sugar substitutes in food and beverages. For instance, on March 4, 2024, World Obesity Day sparked global conversations focusing on health, youth, and the world. The event achieved significant engagement, where participants shared over 200 submissions globally, with initiatives such as the "Walk for WOD" and the illumination of monuments in purple, aiming to raise awareness about obesity and its related challenges. Moreover, the augmenting demand for processed and packaged foods, especially in developing economies, is also fostering the market. Also, the rising popularity of plant-based and organic products along with the extensive application of fructose in pharmaceutical and personal care segments is contributing to the market growth.
To get more information on this market Request Sample
The market in the United States is majorly driven by the growing demand for healthier sweeteners as consumers shift away from traditional sugars. Apart from this, the increasing awareness regarding the health risks of high sugar consumption is fueling the preference for low-glycemic alternatives like fructose. Moreover, considerable growth in the overall processed food and beverage production, especially in the soft drink industry, is contributing significantly to the expansion of the market. For instance, A study published on December 10, 2024, by Johns Hopkins Bloomberg School of Public Health reveals that ultra-processed foods now account for more than 54% of calories consumed at home in the U.S. The intake of these foods increased from 51% in 2003 to 54% in 2018, with only slight differences across demographics. Additionally, increasing demand for high-fructose corn syrup in food manufacturing, which is cost-effective, is driving the market's growth further.
Fructose Market Trends:
Consumer Demand for Healthier Sweeteners
The market is witnessing substantial growth due to the increasing consumer demand for healthier alternatives to traditional sugar, such as high-fructose corn syrup (HFCS). Health-conscious consumers are increasingly seeking natural and low-calorie sweeteners, leading to an increase in the demand for fructose. Consumers are becoming more aware of the potential health risks associated with excessive sugar consumption, including obesity and diabetes. As a result, they are actively looking for products with reduced sugar content. Fructose, particularly when derived from natural sources such as fruits, is perceived as a better alternative due to its lower glycemic index and sweeter taste, allowing for the use of smaller quantities in food and beverages. A study published in the Journal of the American Medical Association shows that grain products account for 17.3% of fructose consumption, fruit, and fruit products for 13.4%, and sugars and sweets for 10.3%. This increased awareness and preferences for healthier sweeteners are encouraging food and beverage manufacturers to reformulate their products with fructose, driving its adoption in a wide range of consumer goods.
Increasing Use in Functional Food Products and Beverages
Fructose is being increasingly used in functional food products and beverages. Functional food products are those products that offer some health benefits above and beyond the basic nutrition and fructose has applications in this fast-growing market segment. Consumers are looking for food products and beverages that can offer specific health benefits, including improved digestion, enhanced energy levels, and better immune function. Fructose is being used as an ingredient in these products due to its natural and nutritional characteristics. The low GI of fructose, coupled with the ability to give a sustained release of energy, makes it a good choice for the formulation of functional food products in weight management and diabetes control. Moreover, it can improve the flavor and sweetness of the products without an excessive use of sugar. According to a published study in the journal Diabetes, Metabolic Syndrome and Obesity: Targets and Therapy, a mean total dietary fructose intake of 51.42 ± 35.54 grams per day accounted for 6.58 ± 3.71% of total dietary energy intake. This is evidence that fructose is broadly consumed in everyday diets and has recently become included in health-promoting functional foods.
Expansion in the Pharmaceutical Industry
According to an industry report, the global pharmaceutical market has experienced a significant growth of more than twenty years, where revenues reached USD 1.6 Trillion in 2023. Growing usage of fructose in pharmaceuticals as an excipient and sweetener supports the growth of this market. Due to its properties, fructose is a prized ingredient in pharmaceutical formulations. Fructose is commonly used in liquid oral medications, syrups, and chewable tablets to improve taste and palatability, especially for pediatric and geriatric patients. The sweetness and solubility of fructose make it a preferred choice over traditional sugar-based sweeteners. A paper published in the Journal of Clinical Investigation presents the metabolic impacts of fructose consumption and its association with an increase in visceral adiposity and lipid dysregulation, a condition that is linked to many diseases, such as cardiovascular disease and type 2 diabetes. In addition, fructose has pharmaceutical applications in suspensions; it stabilizes active ingredients in suspensions. It is also used in compounding to mask the bitter taste of some drugs.
Escalating Demand in Sports Nutrition
The increasing demand for fructose in the sports nutrition industry is providing a positive market outlook. According to the American Journal of Clinical Nutrition, the consumption of high-fructose corn syrup (HFCS) has increased by over 1,000% between 1970 and 1990 and now comprises more than 40% of sweeteners used in the U.S. Fructose is now being used by athletes and fitness enthusiasts as a source of rapid and sustained energy, making it a popular ingredient in sports and energy drinks, gels, and bars. Fructose is the only sugar that can be absorbed more slowly than glucose, providing a steady release of energy over a more extended period. This makes it particularly attractive for endurance athletes and those engaged in prolonged physical activities. Sports nutrition products formulated with fructose are designed to enhance performance, reduce fatigue, and promote faster recovery. They are also used to replenish glycogen stores after intense workouts.
Fructose Industry Segmentation:
IMARC Group provides an analysis of the key trends in each segment of the market, along with forecasts at the global, regional, and country levels for 2026-2034. Our report has categorized the market based on product and application.
Analysis by Product:
- High Fructose Corn Syrup (HFCS)
- Fructose Syrups
- Fructose Solids
High Fructose Corn Syrup (HFCS) leads the market with around 62.7% of market share in 2025. HFCS is a widely used sweetening agent in the food and beverage (F&B) industry due to its cost-effectiveness, versatility, and sweetening properties. HFCS is available in various formulations, including HFCS-42 and HFCS-55, which indicate the percentage of fructose content. It is commonly used in soft drinks, baked goods, condiments, and processed food products. The popularity of HFCS is attributed to its ability to improve flavor, extend shelf life, and provide a cost-effective alternative to traditional sugar. HFCs also act as stabilizer, preventing the crystallization in candies and sauces, which results in improved quality of products. In addition, its readiness and scalability from domestic corn renders it a sure, low-cost sweetener without dependency on sugar imports. Growing demand for affordable alternatives to cane sugar in the processed food chain further strengthens the position of the product in the market.
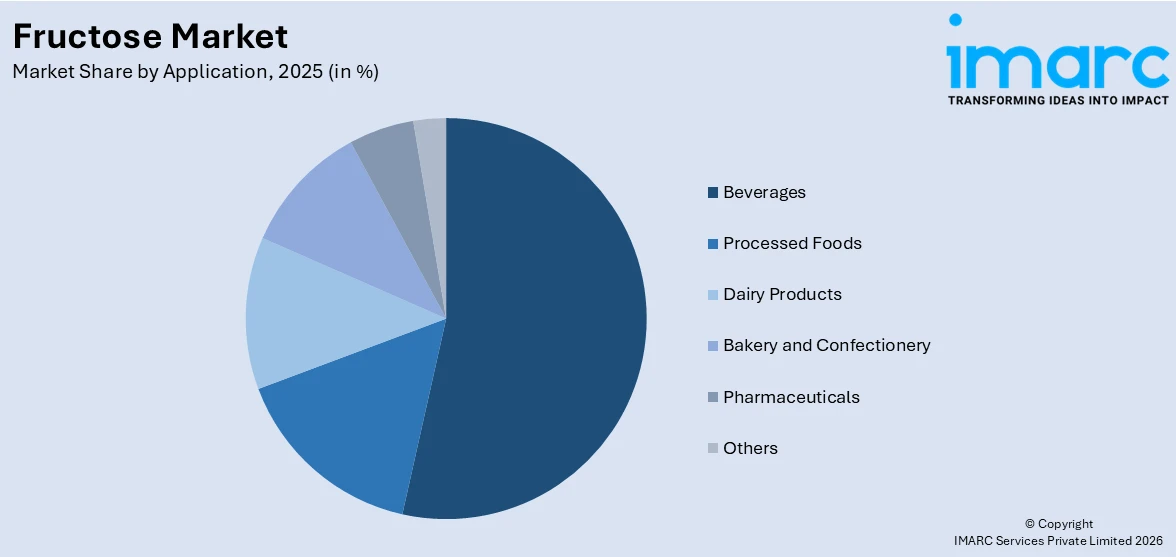
Analysis by Application:
Access the comprehensive market breakdown Request Sample
- Beverages
- Processed Foods
- Dairy Products
- Bakery and Confectionery
- Pharmaceuticals
- Others
Beverages lead the market with around 61.1% of market share in 2025, as they contain substantial quantities of sweeteners that deliver constant and appealing flavor profiles. High-fructose corn syrup, for instance, is preferred for its cost advantage and flexibility in mixing with different beverage formulations, including soft drinks, energy drinks, and fruit juices. Furthermore, it improves the flavor and sweetness in beverages without consuming more sugar quantity, which could better taste without sacrificing affordability. The increasing market of sugary drinks, need for longer shelf life, and large-scale production makes HFCS sustain its position within the beverage market.
Regional Analysis:
To get more information on the regional analysis of this market Request Sample
- North America
- United States
- Canada
- Asia Pacific
- China
- Japan
- India
- South Korea
- Australia
- Indonesia
- Others
- Europe
- Germany
- France
- United Kingdom
- Italy
- Spain
- Russia
- Others
- Latin America
- Brazil
- Mexico
- Others
- Middle East and Africa
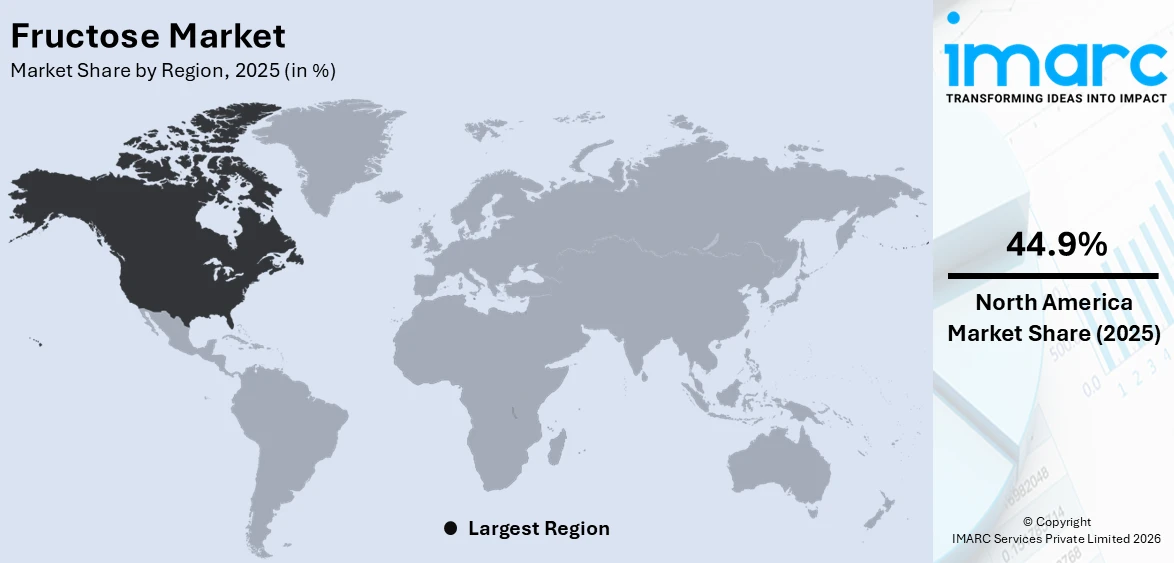
In 2025, North America accounted for the largest market share of over 44.9%. North America dominates the fructose market primarily due to its robust food and beverage industry, where fructose, particularly in the form of High-Fructose Corn Syrup (HFCS), is widely used. The region benefits from an established corn production infrastructure, which enables a steady supply of raw materials for HFCS production, making it more cost-effective than other sweeteners. Additionally, the growing consumer preference for low-cost, versatile sweeteners in processed foods, beverages, and baked goods contributes significantly to market growth. Furthermore, regulatory support for corn-based products and a shift toward healthier sugar alternatives further strengthens North America's leadership in the fructose market.
Key Regional Takeaways:
United States Fructose Market Analysis
In 2025, the United States represented 85.00% of the North America fructose market. U.S. fructose market is registering steady growth as it is strong in demand areas of food and beverage sectors mainly in soft drinks and processed food. For instance, as per the records of the USDA in 2022, the production of corn reached over 13.7 billion bushels, majorly contributing towards the global high-fructose corn syrup supply for which it forms a major source of fructose. The growing demand by consumers for reduced calorie and naturally sourced sweeteners, shifting the trend towards healthier forms of fructose usage, fostering the market. Awareness about fructose's impact on obesity and metabolic disorders and its increasing relevance are also promoting the market in which the larger players such as ADM and Cargill dominate. Pharmaceutical and nutraceutical markets increasingly adopting the usage of fructose are increasing the demand more. The US-based manufacturers are increasing their capacity to meet both domestic and international demand. There is good growth in exports to Latin America and Asia Pacific.
Europe Fructose Market Analysis
Europe is expanding in the fructose market due to the rising need in the food and beverage industry along with a clean label. FoodDrinkEurope, which published a 2023 report, indicated the European food and drink industry as major consumers of products such as fructose, whose consumption constitutes above 15 percent of the entire manufacturing output by the EU. In Germany and France, for instance, the increasing use of natural sweeteners and low-calorie diets leads to the replacement of traditional sucrose with fructose-based alternatives. In addition, many European nations are targeting their policies on controls in the usage of high-fructose corn syrup (HFCS) as well due to the health risks and has negatively influenced its growth, though the newer developments in products from fructose, such as fructooligosaccharides (FOS), thereby improving market growth. The leaders in Europe such as Roquette and Südzucker develop sustainable production practices to meet a rising demand for healthier fructose alternatives.
Asia Pacific Fructose Market Analysis
Asia Pacific fructose market is growing pretty strong, mainly due to the rising demand in the food and beverage industries. According to Source of Asia, the Southeast Asian food and beverage industry is said to grow at an annual rate of 6.99% annually. Major consumers of the high use counties of China and India in soft drinks, processed foods, and sweets. The region is also witnessing a rise in health and wellness, thereby increasing demand for alternative sweeteners such as fruit-derived fructose. Furthermore, investment in the food and beverage sector is rising to cater to the increasing consumption of urban populations. The leading regional producers, such as Thai Beverage and Coca-Cola in China, are expanding their product portfolios, which further fuels market growth.
Latin America Fructose Market Analysis
In Latin America, the demand for processed food and sugar beverages is fueling the market growth for fructose. A study done on added sugars in packaged foods sold in Brazil reported that 71% of 4,539 products contained some form of added sugar. The most common were sugar, maltodextrin, and glucose syrup, indicating high usage of sweeteners in Brazil. Increasing awareness in health circles has, therefore seen the market trend shift toward more natural types of fructose and others from fruits. Advanced sugar substitutes are, in fact being put up for investment in the future in nations such as Mexico and Colombia. Major producers in this area include companies such as Bunge and Ingredion. Its production rate increases day after day with rising exports to nearby nations. Latin America’s growing manufacturing capabilities in the food and beverage industry, coupled with improved infrastructure, are driving market growth in the region.
Middle East and Africa Fructose Market Analysis
The Middle East market for fructose is growing. The increasing consumption of sweetener in the elaborated food and beverages is providing a boost to the Middle East market. According to the World Bank, in 2023, the United Arab Emirates imported USD 169.99 Thousand of chemically pure fructose with quantity 95,476 kg. Increasing popularity of sweetened drinks and processed food in countries like Saudi Arabia and the UAE has further fueled the demand for fructose. The sizeable expatriate population in the region is another factor for diverse food products demand. Almarai, based in the region, and UAE-based Agthia Group have been on a spree of increasing their product portfolio with the acquisition of fructose for their business lines. Investment in food production infrastructure is also likely to bolster the growth in the market.
Competitive Landscape:
Key players in the market are actively engaged in several strategic initiatives to maintain and expand their market presence. They are investing in research and development (R&D) activities to innovate and create new fructose products that cater to the changing consumer preferences for natural, clean-label, and healthier sweeteners. Additionally, these companies are focusing on sustainability by adopting eco-friendly production processes and sourcing practices, aligning with the global sustainability goals. They are also expanding their geographical reach by entering emerging markets, especially in Asia-Pacific and Latin America, where the demand for fructose is rising. Furthermore, strategic partnerships and acquisitions are common strategies to enhance product portfolios and strengthen their competitive position in the market. Notably, on December 11, 2024, Tate & Lyle and BioHarvest announced a partnership to develop plant-based sweeteners using BioHarvest's Botanical Synthesis platform. The collaboration aims to produce affordable, sustainable, and nutritious ingredients, meeting consumer demand for healthier, sugar-like options. This process promises to reduce the land and water usage associated with traditional agriculture, ensuring broader accessibility to beneficial ingredients.
The report provides a comprehensive analysis of the competitive landscape in the fructose market with detailed profiles of all major companies, including:
- Archer-Daniels-Midland Company
- Cargill Incorporated
- DuPont de Nemours Inc.
- Galam Ltd.
- Ingredion Incorporated
- Shijiazhuang Huaxu Pharmaceutical Co. Ltd.
- Tate & Lyle Plc
Latest News and Developments:
- October 2024: According to Tate & Lyle PLC and Manus, the companies have established The Natural Sweetener Alliance for the purpose of increasing access to natural sugar reduction options. According to the companies, the first product developed will be stevia Reb M, sourced domestically.
- January 2024: Ingredion concluded the sale of its South Korean business to an affiliate of the Sajo Group for about USD 294 million. The deal forms part of Ingredion's strategic portfolio reshaping. The South Korean business generated net sales of USD 325 million in 2023.
- September 2022: Ingredion Incorporated, a leading global provider of value-added ingredient solutions, announced the establishment of sustainable state-of-the-art starch manufacturing plant in Shandong, China. With this most recent launch, Ingredion's starch production capabilities and capacity in the nation have doubled.
- August 2022: Cargill Incorporated announced that it will spend USD 50 million to build a corn syrup refinery in Fort Dodge, Iowa, that will expand the company’s ability to meet the ingredient's rising demand in a more sustainable manner. It will use energy-efficient technologies and processing methods and the refinery will be powered by the MidAmerican Energy electrical grid, which is made up of more than 88% renewable sources.
- July 2020: Tate & Lyle Plc, a leading global supplier of food and beverage solutions and ingredients, announced the launch of SWEETENER-VANTAGETM Expert Systems, a collection of new and innovative sweetener solution design tools along with an educational program. In order to assist formulators in creating sugar-reduced foods and beverages with low-calorie sweeteners.
Fructose Market Report Scope:
| Report Features | Details |
|---|---|
| Base Year of the Analysis | 2025 |
| Historical Period | 2020-2025 |
| Forecast Period | 2026-2034 |
| Units | Billion USD |
| Scope of the Report | Exploration of Historical Trends and Market Outlook, Industry Catalysts and Challenges, Segment-Wise Historical and Future Market Assessment:
|
| Products Covered | High Fructose Corn Syrup (HFCS), Fructose Syrups, Fructose Solids |
| Applications Covered | Beverages, Processed Foods, Dairy Products, Bakery and Confectionery, Pharmaceuticals, Others |
| Regions Covered | Europe, North America, Asia Pacific, Latin America, Middle East and Africa |
| Countries Covered | United States, Canada, Germany, France, United Kingdom, Italy, Spain, Russia, China, Japan, India, South Korea, Australia, Indonesia, Brazil, Mexico |
| Companies Covered | Archer-Daniels-Midland Company, Cargill Incorporated, DuPont de Nemours Inc., Galam Ltd., Ingredion Incorporated, Shijiazhuang Huaxu Pharmaceutical Co. Ltd., Tate & Lyle Plc., etc. |
| Customization Scope | 10% Free Customization |
| Post-Sale Analyst Support | 10-12 Weeks |
| Delivery Format | PDF and Excel through Email (We can also provide the editable version of the report in PPT/Word format on special request) |
Key Benefits for Stakeholders:
- IMARC’s industry report offers a comprehensive quantitative analysis of various market segments, historical and current market trends, market forecasts, and dynamics of the fructose market from 2020-2034.
- The research report provides the latest information on the market drivers, challenges, and opportunities in the global fructose market.
- The study maps the leading, as well as the fastest-growing, regional markets. It further enables stakeholders to identify the key country-level markets within each region.
- Porter's five forces analysis assists stakeholders in assessing the impact of new entrants, competitive rivalry, supplier power, buyer power, and the threat of substitution. It helps stakeholders to analyse the level of competition within the fructose industry and its attractiveness.
- The competitive landscape allows stakeholders to understand their competitive environment and provides insight into the current positions of key players in the market.
Frequently Asked Questions About the Fructose Market Report
The fructose market was valued at USD 5.5 Billion in 2025.
The fructose market is expected to reach USD 7.8 Billion by 2034, growing at a CAGR of 3.80% from 2026-2034.
The market is primarily driven by rising demand for healthier sugar alternatives, increased use in functional foods, beverages, and pharmaceuticals, growing awareness of obesity and diabetes, and the popularity of plant-based and organic products, along with expanding applications in sports nutrition and processed foods.
North America dominates the fructose market in 2025, accounting for a share exceeding 44.9%. This dominance is fueled by robust food and beverage industries, cost-effective HFCS production, and strong consumer preference for healthier sweeteners.
Some of the major players in the fructose market include Archer-Daniels-Midland Company, Cargill Incorporated, DuPont de Nemours Inc., Galam Ltd., Ingredion Incorporated, Shijiazhuang Huaxu Pharmaceutical Co. Ltd., and Tate & Lyle Plc., among others.
Need more help?
- Speak to our experienced analysts for insights on the current market scenarios.
- Include additional segments and countries to customize the report as per your requirement.
- Gain an unparalleled competitive advantage in your domain by understanding how to utilize the report and positively impacting your operations and revenue.
- For further assistance, please connect with our analysts.
 Request Customization
 Speak to an Analyst
 Request Brochure
 Inquire Before Buying
Benefits of Customization
- Personalize this research
- Triangulate with your data
- Get data as per your format and definition
- Gain a deeper dive into a specific application, geography, customer, or competitor
- Any level of personalization
Get in Touch With Us
UNITED STATES
Phone: +1-201-971-6302
INDIA
Phone: +91-120-433-0800
UNITED KINGDOM
Phone: +44-753-714-6104
Email: [email protected]
Client Testimonials


.webp)


