
Fuel Cards Market Report by Type (Branded, Universal, Merchant), Technology (Smart Cards, Standard Cards), Application (Fuel Refill, Parking, Vehicle Services, Toll Charges, and Others), End User (Individual, Corporate), and Region 2026-2034
Market Overview:
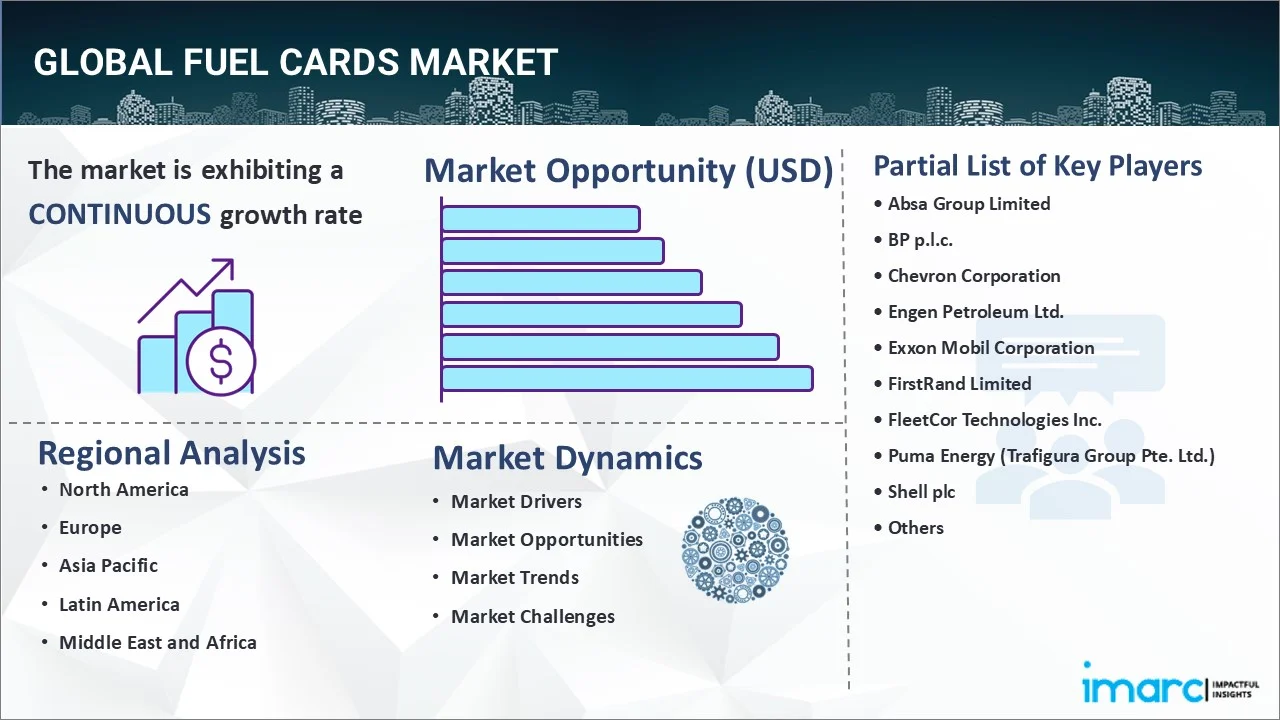
The global fuel cards market size reached USD 997.6 Billion in 2025. Looking forward, IMARC Group expects the market to reach USD 2,386.6 Billion by 2034, exhibiting a growth rate (CAGR) of 9.87% during 2026-2034. The growing focus on efficient fleet management solutions, rising demand for cost-effective fuel purchasing and expense tracking solutions, and stringent regulations to reduce fuel fraud and ensure responsible fuel consumption are some of the major factors propelling the market.
|
Report Attribute
|
Key Statistics
|
|---|---|
|
Base Year
|
2025 |
|
Forecast Years
|
2026-2034
|
|
Historical Years
|
2020-2025
|
| Market Size in 2025 | USD 997.6 Billion |
| Market Forecast in 2034 | USD 2,386.6 Billion |
| Market Growth Rate (2026-2034) | 9.87% |
Fuel cards, also known as fleet cards or fuel credit cards, are specialized payment cards that are designed to streamline fuel-related expenses for businesses with vehicles. They provide a convenient way for companies to manage their fuel costs by allowing employees to purchase gasoline and diesel at authorized fuel stations. They offer detailed transaction reporting, expense tracking, and the ability to set spending limits. They assist in simplifying administrative tasks and contribute to cost control and enhanced financial management. As they enhance operational efficiency and reduce the administrative burden, the demand for fuel cards is increasing worldwide.
To get more information on this market Request Sample
At present, the rising need for fuel procurement and expense management among individuals is contributing to the growth of the market. In line with this, the increasing popularity of digital payment options, along with the rising utilization of smartphones among individuals across the globe, is strengthening the growth of the market. Moreover, the growing demand for fuel cards, as they offer data-driven insights for enhanced decision-making, is positively influencing the market. In addition, the rising adoption of convenient and remote monitoring solutions that provide transaction alerts is providing lucrative growth opportunities to industry investors. Furthermore, the increasing popularity of customization among individuals around the world is supporting the growth of the market. Besides this, the rising acceptance of fuel cards internationally is bolstering the growth of the market.
Fuel Cards Market Trends/Drivers:
Rising focus on efficient fleet management solutions
The increasing emphasis on efficient fleet management is contributing to the growth of the market. In addition, businesses with vehicle fleets are recognizing the need to streamline operations, reduce operational costs, and enhance overall productivity. These cards offer a comprehensive solution by enabling centralized control over fuel expenses. They also allow fleet managers to monitor fuel consumption, track transactions, and analyze data in real-time. In line with this, this allows businesses to identify inefficient driving habits, optimize routes, and make informed decisions to improve fuel efficiency, which is bolstering the growth of the market. Furthermore, there is an increase in the demand for seamless fleet management that benefits in enhancing the operational effectiveness in a business.
Increasing demand for cost-effective fuel purchasing and expense tracking solution
The rising demand for cost-effective fuel purchasing and expense tracking solutions among the masses across the globe is impelling the growth of the market. Various businesses with vehicle fleets are focusing on tracking operational costs. Fuel cards provide a cost-effective solution by offering several discounts on fuel purchases and eliminating the need for cash transactions. Apart from this, these cards enable precise tracking of fuel expenses that allows businesses to monitor their expenditure on a per-vehicle basis. This detailed expense tracking aids in budgeting, identifying anomalies, and preventing fraudulent activities, which is propelling the growth of the market. Furthermore, businesses are increasingly seeking ways to optimize their spending and gain enhanced control over costs.
Stringent regulations to reduce fuel fraud
Governing agencies of various countries are focusing on reducing fuel fraud and ensuring responsible fuel consumption, which is bolstering the growth of the market. In line with this, these cards assist in lowering the chances of fraudulent activities by promoting accountability in fuel-related transactions. They offer features, such as purchase restrictions, transaction validation, and mileage tracking, which enhance transparency and compliance. Apart from this, the rising adoption of these cards among businesses operating in industries, such as transportation and logistics to meet regulatory requirements and avoid penalties is strengthening the growth of the market. These cards benefit in maintaining compliance while also streamlining administrative processes.
Fuel Cards Industry Segmentation:
IMARC Group provides an analysis of the key trends in each segment of the global fuel cards market report, along with forecasts at the global, regional, and country levels for 2026-2034. Our report has categorized the market based on type, technology, application, and end user.
Breakup by Type:
To get detailed segment analysis of this market Request Sample
- Branded
- Universal
- Merchant
Universal represents the largest market segment
The report has provided a detailed breakup and analysis of the market based on the type. This includes branded, universal, and merchant. According to the report, universal represented the largest segment. Universal are versatile payment solutions that offer broad acceptance across various fuel networks and gas stations. These cards are not tied to a specific fuel brand or station that enables users the flexibility to refuel at a wide range of locations. They are particularly attractive to businesses with extensive operations or cross-country fleets, as they eliminate the need for drivers to seek out specific fuel stations. In addition, they provide enhanced convenience by simplifying administrative tasks and allow for efficient fuel procurement during long-distance travel. Additionally, these cards often come with features, such as transaction tracking and expenditure reporting, which aid businesses in managing fuel expenses effectively.
Breakup by Technology:
- Smart Cards
- Standard Cards
The report has provided a detailed breakup and analysis of the market based on the technology. This includes smart cards and standard cards.
Smart cards, also known as chip cards, incorporate advanced technology to enhance security and functionality. These cards have an embedded microchip that stores and processes data securely. Smart fuel cards offer additional layers of security through encryption and authentication mechanisms that reduce the risk of fraudulent activities. They can also support contactless payments and enable quick and convenient transactions at fuel stations. The technology within smart cards allows for integration with mobile apps and online platforms that enables users to monitor transactions and manage expenses in real time.
Standard cards, also referred to as magnetic stripe cards or traditional cards, rely on magnetic stripe technology for data storage. They are typically swiped through card readers for transactions and provide a reliable and straightforward solution for fuel purchases.
Breakup by Application:
- Fuel Refill
- Parking
- Vehicle Services
- Toll Charges
- Others
Fuel refill accounts for the majority of the market share
The report has provided a detailed breakup and analysis of the market based on the application. This includes fuel refill, parking, vehicle services, toll charges, and others. According to the report, fuel refill represented the largest segment. Fuel refill involves providing businesses with a streamlined and efficient method to manage their refueling needs. These cards facilitate cashless transactions at fuel stations and eliminate the need for physical cash or credit cards. Users can conveniently refill their vehicles by simply presenting their fuel cards and ensuring a seamless and swift process. They enhance control over fuel expenses, promote accountability through transaction tracking, and simplify expense reporting. These cards assist in improving operational efficiency for businesses and enable them to allocate resources effectively while optimizing fuel consumption.
Breakup by End User:
- Individual
- Corporate
The report has provided a detailed breakup and analysis of the market based on the end user. This includes individual and corporate.
Individual cards cater to individual users, often those who own personal vehicles. Individuals prefer these cards due to their enhanced convenience and cashless nature. These cards provide ease of use and eliminate the need for carrying cash or credit cards when visiting fuel stations. They also offer potential discounts or rewards programs that can be appealing to individuals. They also streamline payment processes and enhance the overall refueling experience, which makes them a practical choice for those looking for a hassle-free way to manage their personal vehicle fuel expenses.
Corporate involves businesses, particularly those with vehicle fleets, that rely on these cards to manage their fuel-related expenditures. They offer various benefits, such as centralized expense management, transaction tracking, and detailed reporting. Businesses can set purchase restrictions, monitor driver behavior, and gain insights into fuel consumption patterns. They aid in optimizing fleet operations, enhancing accountability, and simplifying administrative tasks related to fuel management.
Breakup by Region:
To get more information on the regional analysis of this market Request Sample
- North America
- United States
- Canada
- Asia Pacific
- China
- Japan
- India
- South Korea
- Australia
- Indonesia
- Others
- Europe
- Germany
- France
- United Kingdom
- Italy
- Spain
- Russia
- Others
- Latin America
- Brazil
- Mexico
- Others
- Middle East and Africa
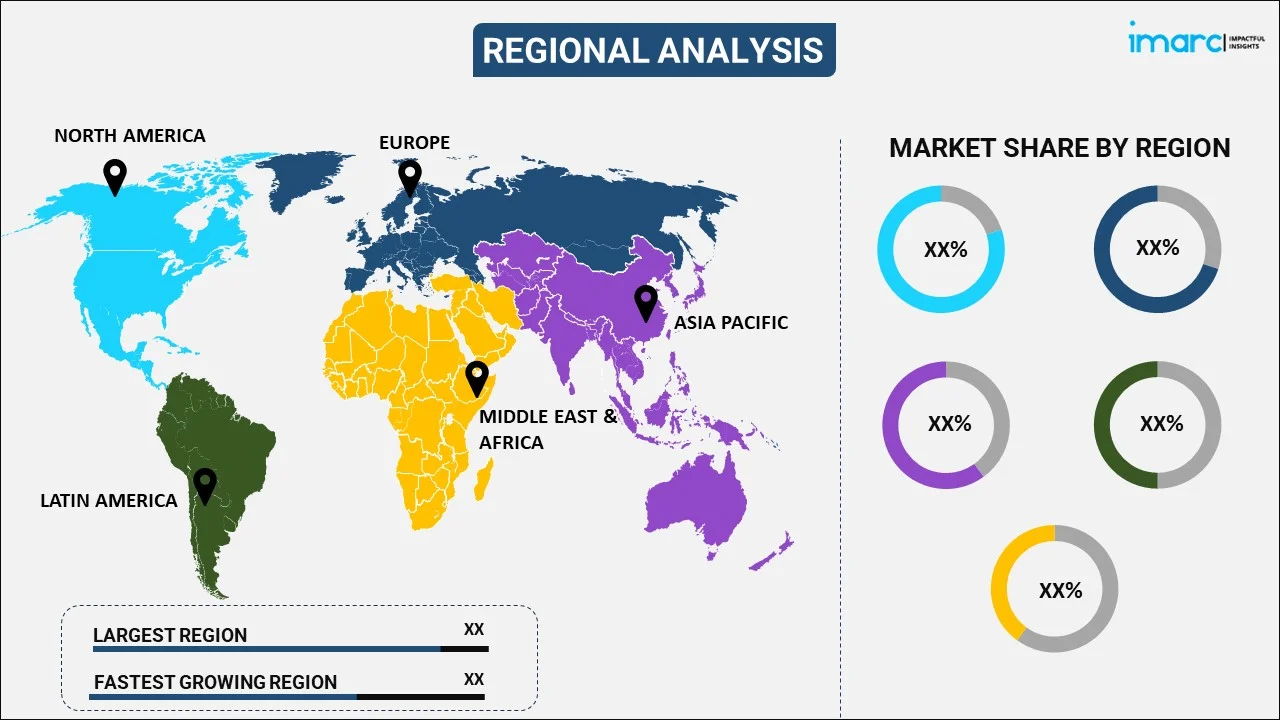
Europe exhibits a clear dominance, accounting for the largest fuel cards market share
The market research report has also provided a comprehensive analysis of all the major regional markets, which include North America (the United States and Canada); Asia Pacific (China, Japan, India, South Korea, Australia, Indonesia, and others); Europe (Germany, France, the United Kingdom, Italy, Spain, Russia, and others); Latin America (Brazil, Mexico, and others); and the Middle East and Africa. According to the report, Europe accounted for the largest market share.
Europe held the biggest market share due to the presence of well-established transportation infrastructure. Apart from this, the rising adoption of fuel cards as tools for monitoring and optimizing fuel consumption is contributing to the growth of the market in the region. In line with this, favorable government initiatives for environmental sustainability are bolstering the growth of the market in the Europe region. Furthermore, the wide availability of fuel stations that are integrated with advanced technologies is impelling the growth of the market.
Competitive Landscape:
Key players are offering digital platforms and mobile applications that enable users to manage their accounts, track transactions, and receive real-time alerts. This integration enhances user experience and provides convenient access to fuel-related data. Moreover, they are focusing on improving security features within fuel cards to mitigate fraud and unauthorized usage. The integration of Europay, MasterCard, and Visa (EMV) chip technology, biometric authentication, and advanced encryption techniques assist in safeguarding transactions and user data. Besides this, companies are providing businesses with the ability to customize card features according to their specific needs. This includes setting spending limits, allocating cards to specific drivers, and tailoring reporting and analytics capabilities.
The report has provided a comprehensive analysis of the competitive landscape in the market. Detailed profiles of all major companies have also been provided. Some of the key players in the market include:
- Absa Group Limited
- BP p.l.c.
- Chevron Corporation
- Engen Petroleum Ltd.
- Exxon Mobil Corporation
- FirstRand Limited
- FleetCor Technologies Inc.
- Puma Energy (Trafigura Group Pte. Ltd.)
- Shell plc
- TotalEnergies SE
- U.S. Bancorp
- WEX Inc.
Recent Developments:
- In November 2021, Shell Oil Company (Shell) acquired MSTS Payments, LLC and its Multi Service Fuel Card business from Multi Service Technology Solutions, Inc. (dba TreviPay) to enhance customer road transport experience.
- In July 2022, BP announced the launch of the new BPme Rewards Signature Visa® credit card in conjunction with First National Bank of Omaha (FNBO) and Visa. It is a modern take on the traditional fuel card that combines the power of BPme Rewards with traditional credit card advantages, such as cash back rewards and flexible redemption options.
- In 2022, -WEX, the global commerce platform that simplifies the business of running a business, acquired the Exxon Mobil Business Card program. The Exxon Mobil BusinessPro program provides convenience, security, and control for small businesses that allow cardholders to earn points on fuel purchases.
Fuel Cards Market Report Scope:
| Report Features | Details |
|---|---|
| Base Year of the Analysis | 2025 |
| Historical Period | 2020-2025 |
| Forecast Period | 2026-2034 |
| Units | Billion USD |
| Scope of the Report | Exploration of Historical Trends and Market Outlook, Industry Catalysts and Challenges, Segment-Wise Historical and Predictive Market Assessment:
|
| Types Covered | Branded, Universal, Merchant |
| Technologies Covered | Smart Cards, Standard Cards |
| Applications Covered | Fuel Refill, Parking, Vehicle Services, Toll Charges, Others |
| End Users Covered | Individual, Corporate |
| Regions Covered | Asia Pacific, Europe, North America, Latin America, Middle East and Africa |
| Countries Covered | United States, Canada, Germany, France, United Kingdom, Italy, Spain, Russia, China, Japan, India, South Korea, Australia, Indonesia, Brazil, Mexico |
| Companies Covered | Absa Group Limited, BP p.l.c., Chevron Corporation, Engen Petroleum Ltd., Exxon Mobil Corporation, FirstRand Limited, FleetCor Technologies Inc., Puma Energy (Trafigura Group Pte. Ltd.), Shell plc, TotalEnergies SE, U.S. Bancorp, WEX Inc. |
| Customization Scope | 10% Free Customization |
| Post-Sale Analyst Support | 10-12 Weeks |
| Delivery Format | PDF and Excel through Email (We can also provide the editable version of the report in PPT/Word format on special request) |
Key Benefits for Stakeholders:
- IMARC’s industry report offers a comprehensive quantitative analysis of various market segments, historical and current market trends, market forecasts, and dynamics of the fuel cards market from 2020-2034.
- The research report study provides the latest information on the market drivers, challenges, and opportunities in the global fuel cards market.
- The study maps the leading, as well as the fastest-growing, regional markets. It further enables stakeholders to identify the key country-level markets within each region.
- Porter's five forces analysis assist stakeholders in assessing the impact of new entrants, competitive rivalry, supplier power, buyer power, and the threat of substitution. It helps stakeholders to analyze the level of competition within the fuel cards industry and its attractiveness.
- Competitive landscape allows stakeholders to understand their competitive environment and provides an insight into the current positions of key players in the market.
Frequently Asked Questions About the Fuel Cards Market Report
The global fuel cards market was valued at USD 997.6 Billion in 2025.
We expect the global fuel cards market to exhibit a CAGR of 9.87% during 2026-2034.
The sudden outbreak of the COVID-19 pandemic has led to the increasing adoption of digital payment methods, such as fuel cards, that provides greater control over cash flow and allow organizations to combat the spread of the coronavirus infection.
The rising demand for fuel cards across numerous organizations as they allow managers to track fuel purchase in real-time and set spending limits, for employees who operate corporate vehicles, is primarily driving the global fuel cards market.
Based on the type, the global fuel cards market has been segmented into branded, universal, and merchant. Currently, universal holds the majority of the total market share.
Based on the application, the global fuel cards market can be divided into fuel refill, parking, vehicle services, toll charges, and others. Among these, fuel refill exhibits a clear dominance in the market.
On a regional level, the market has been classified into North America, Asia-Pacific, Europe, Latin America, and Middle East and Africa, where Europe currently dominates the global market.
Some of the major players in the global fuel cards market include Absa Group Limited, BP p.l.c., Chevron Corporation, Engen Petroleum Ltd., Exxon Mobil Corporation, FirstRand Limited, FleetCor Technologies Inc., Puma Energy (Trafigura Group Pte. Ltd.), Shell plc, TotalEnergies SE, U.S. Bancorp, and WEX Inc.
Need more help?
- Speak to our experienced analysts for insights on the current market scenarios.
- Include additional segments and countries to customize the report as per your requirement.
- Gain an unparalleled competitive advantage in your domain by understanding how to utilize the report and positively impacting your operations and revenue.
- For further assistance, please connect with our analysts.
 Request Customization
 Speak to an Analyst
 Request Brochure
 Inquire Before Buying
Benefits of Customization
- Personalize this research
- Triangulate with your data
- Get data as per your format and definition
- Gain a deeper dive into a specific application, geography, customer, or competitor
- Any level of personalization
Get in Touch With Us
UNITED STATES
Phone: +1-201-971-6302
INDIA
Phone: +91-120-433-0800
UNITED KINGDOM
Phone: +44-753-714-6104
Email: [email protected]
Client Testimonials


.webp)


