
Ghana Mobile Money Market Size, Share, Trends, and Forecast by Technology, Business Model, and Transaction Type, 2026-2034
Ghana Mobile Money Market Size and Share:
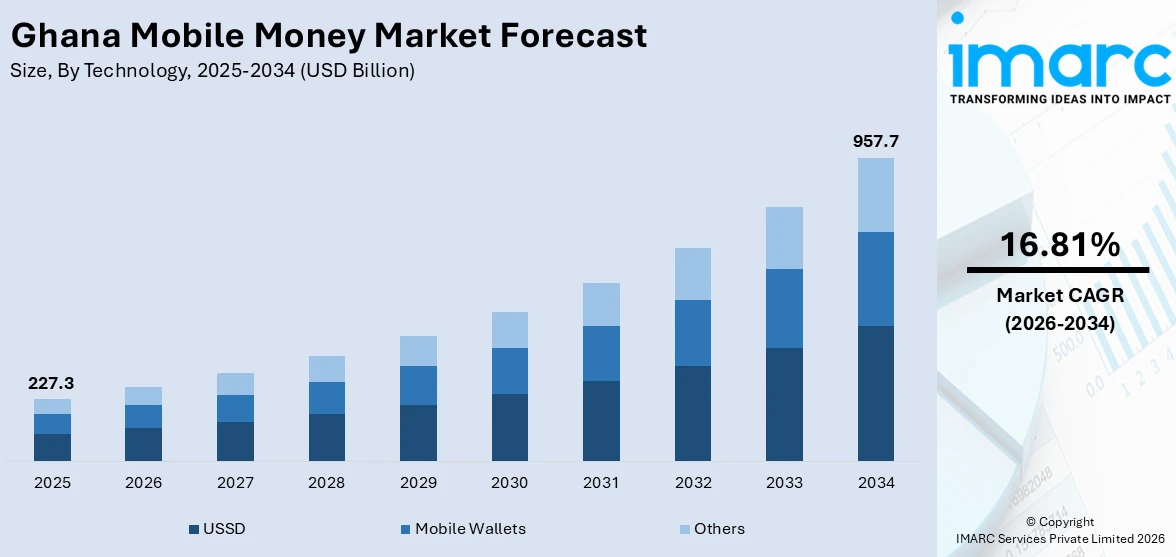
The Ghana mobile money market size was valued at USD 227.3 Billion in 2025. Looking forward, IMARC Group estimates the market to reach USD 957.7 Billion by 2034, exhibiting a CAGR of 16.81% from 2026-2034. The market is fueled by increasing financial inclusion, a high unbanked population, and the widespread use of mobile phones. Supportive regulations, growing remittance inflows, and strong telecom infrastructure further fuel growth. Convenience, affordability, and partnerships between telecoms, fintechs, and agents also contribute to the rapid market expansion.
|
Report Attribute
|
Key Statistics
|
|---|---|
|
Base Year
|
2025
|
|
Forecast Years
|
2026-2034
|
|
Historical Years
|
2020-2025
|
|
Market Size in 2025
|
USD 227.3 Billion |
|
Market Forecast in 2034
|
USD 957.7 Billion |
| Market Growth Rate (2026-2034) | 16.81% |
The increasing financial inclusion is a major factor driving the market growth in Ghana. With a large unbanked population, mobile money provides an accessible alternative to traditional banking, especially in rural areas where banking infrastructure is limited. Mobile money enables easy access to essential financial services like savings, payments, and transfers, promoting economic participation among underserved populations. The increasing usage of mobile phones has created a strong foundation for mobile money adoption. High mobile penetration rates, including in rural areas, ensure that a vast majority of Ghanaians can access mobile money services through basic or feature phones using USSD technology. According to a survey's findings, 54.1% of Ghanaians five years of age and over own a working cell phone. After excluding children and teenagers, the percentage of people with functional mobile phones rose to an average of 82.0%. More people own smartphones (46.1%) and basic phones (47.9%) than feature phones (12.8%).
To get more information on this market Request Sample
The Ghana mobile money market growth is also influenced by strong remittance inflows. Ghana receives significant remittances from abroad, which mobile money platforms help facilitate efficiently. For instance, in October 2024, The Bank of Ghana announced a trial project for Africa's first direct mobile money interoperability platform, linking the Ghanaian Cedi and Nigerian Naira, marking a significant milestone for financial inclusiveness in Africa. This was declared in the IMF/World Bank Fall Meetings aimed at promoting financial connection and inclusivity throughout Africa. This has expanded the scope of mobile money from domestic transactions to cross-border payments. Additionally, government and regulatory support have been pivotal. Policies such as the Bank of Ghana’s e-money guidelines have created a secure environment for mobile money operations, boosting user trust and market growth. The market is also fueled by telecom operators’ dominance, leveraging their extensive networks and agent partnerships to scale services rapidly.
Ghana Mobile Money Market Trends:
Financial Inclusion
Ghana's mobile money market is primarily driven by the need for financial inclusion. A significant portion of the population remains unbanked, particularly in rural areas with limited access to traditional banking infrastructure. Mobile money provides an accessible and convenient alternative, offering services such as savings, transfers, and payments through mobile phones. By enabling financial access for underserved populations, it fosters economic empowerment and participation. Government and regulatory initiatives, like the Bank of Ghana’s e-money guidelines, further support this drive by ensuring a secure and inclusive environment for mobile money services to thrive across diverse demographic segments. According to the Ghana mobile money market statistics, Ghana has attained roughly 97% financial inclusion in terms of access; however, only 32% of the population is financially literate, which reflects that they lack the knowledge needed to make wise financial decisions, according to the Bank of Ghana's (BoG) 2024 Financial Inclusion (FI) report.
Widespread Mobile Penetration
High mobile phone penetration is a critical factor driving Ghana’s mobile money market. With both urban and rural areas experiencing increased access to mobile phones, mobile money platforms reach a broad audience, including those without smartphones. Services delivered through USSD technology ensure accessibility for basic phone users, bypassing the need for internet access. For instance, in August 2024, The Bank of Ghana-licensed specialized deposit-taking company Izwe Savings and Loans Plc announced the launch of Mobisave, a new savings product that can be accessed using their USSD platform. Customers, both new and old, may effortlessly save money using their mobile phones due to this creative service. This widespread adoption of mobile technology enables seamless transactions and contributes to the rapid expansion of mobile money usage, making financial services more convenient and inclusive for a large portion of the population, especially in rural communities.
Telecom and Fintech Innovations
Telecom operators and fintech companies represent one of the major Ghana mobile money market trends. Telecom giants like MTN, Vodafone, and AirtelTigo leverage their vast infrastructure and agent networks to expand mobile money services. Fintechs innovate by introducing new products like microloans, savings, and insurance-linked to mobile wallets, enhancing the ecosystem. For instance, in August 2023, Vodafone Cash and Remitly Inc., a Seattle-based international money transfer provider announced a strategic partnership. The remittance procedure for Vodafone Cash subscribers will be greatly enhanced by this partnership, giving Ghanaian beneficiaries a more practical, safe, and effective way to receive money from overseas straight into their Vodafone Cash wallets. Partnerships between these entities further fuel growth, making mobile money more versatile and appealing to a broader audience. Their investments in secure, scalable, and user-friendly platforms ensure continued market expansion, addressing evolving customer needs and boosting trust in mobile money solutions.
Ghana Mobile Money Industry Segmentation:
IMARC Group provides an analysis of the key trends in each segment of the Ghana mobile money market, along with forecasts at the country and regional levels from 2026-2034. The market has been categorized based on technology, business model, and transaction type.
Analysis by Technology:
- USSD
- Mobile Wallets
- Others
USSD (Unstructured Supplementary Service Data) holds the largest share of Ghana's mobile money market because basic phones can be accessed through easy and financially efficient methods. Basic phones running USSD functionality present mobile money accessibility as smartphones remain inaccessible in rural locations due to limited internet access. Users can manage their payments through USSD even when they do not have an internet connection by executing money transfers among other functions. Unlike traditional banking models, mobile money allows equal access to payment services across unbanked and underbanked customer populations. Additionally, telecom operators have heavily invested in USSD-based mobile money platforms, making them the primary channel for financial transactions across diverse demographic segments.
Analysis by Business Model:
Access the comprehensive market breakdown Request Sample
- Mobile Led Model
- Bank Led Model
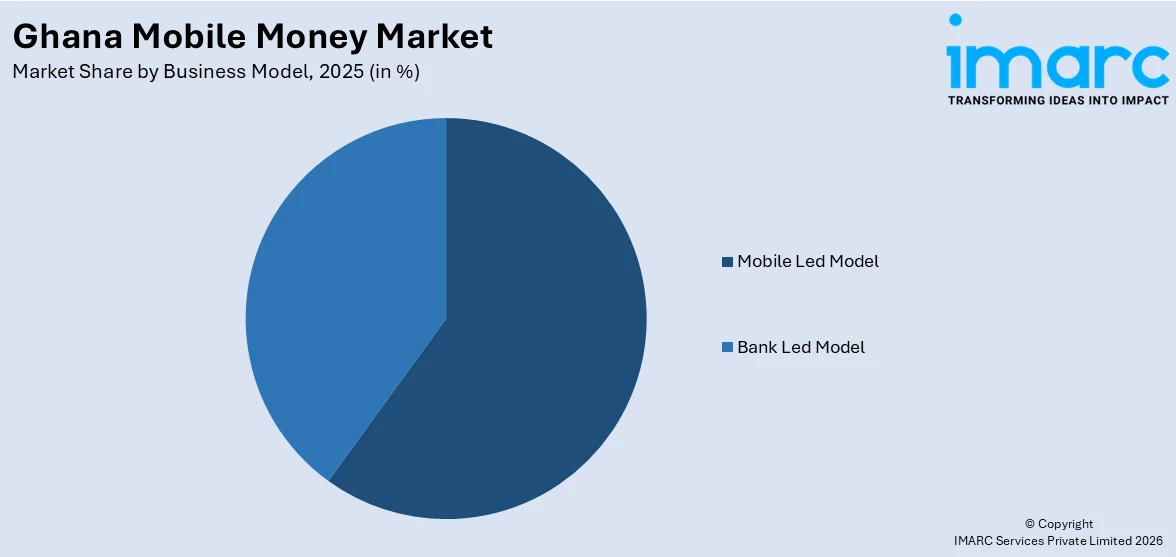
The mobile-led model dominates the Ghana mobile money market share because telecom operators MTN, Vodafone, and AirtelTigo have successfully built extensive networks across the country. Mobile money services are available throughout remote areas as companies utilize their broad network infrastructure combined with large subscriber bases. The model prioritizes convenience, enabling users to perform transactions using mobile phones without requiring traditional bank accounts. Its success is bolstered by partnerships with agents, businesses, and fintech firms, creating a robust ecosystem. The mobile-led approach addresses financial inclusion effectively, catering to Ghana's large unbanked population and driving the market’s growth and dominance.
Analysis by Transaction Type:
- Peer to Peer
- Bill Payments
- Airtime Top-ups
- Others
Peer-to-peer (P2P) transactions hold the largest share in Ghana's mobile money market due to their simplicity, convenience, and relevance to the daily financial needs of individuals. The large segment of unbanked individuals in Ghana relies on P2P money transfers for payments since rural areas lack access to conventional banking facilities. The speed and low-cost nature of mobile payment solutions portrays them as appropriate for personal funds transfer between personal and business operations conducted at small scales. The dominance of P2P emerges from the combination of mobile money agents who operate throughout the country along with mobile phones which enable secure and reliable financial transactions.
Competitive Landscape:
Ghana's mobile money market is highly competitive, driven by increasing financial inclusion and digital adoption. Key players include MTN Mobile Money, Vodafone Cash, and AirtelTigo Money, with MTN commanding a dominant market share. Banks and fintech companies, such as Zeepay and E-Transact, also contribute to the ecosystem, offering innovative digital financial services. The market benefits from a supportive regulatory environment, such as the Bank of Ghana's guidelines on e-money issuance. Despite rapid growth, challenges persist, including fraud, limited infrastructure in rural areas, and competition-driven price wars. The market's future hinges on further innovation and expanded access to unbanked populations.
The report provides a comprehensive analysis of the competitive landscape in the Ghana mobile money market with detailed profiles of all major companies, including:
- MTN
- Vodafone
- Tigo
- Airtel
Latest News and Developments:
- In September 2024, a licensed Enhanced Payment Service Provider, eTranzact Ghana, announced the launch of the XCEL Ghana mobile application. Bill payments, airtime purchases, mobile wallets, and seamless bank transfers are all made possible with the app by integrating with current mobile money and banking systems.
- In February 2024, Mastercard and MTN Group Fintech announced the signing of a multi-market agreement that intends to facilitate a new era of collaboration to connect millions of people and small businesses across the Africa region with digital tools to transact through secure mobile payments, thereby expanding access to the benefits of the cashless digital economy.
- In January 2024, Ericsson and the MTN Group announced partnership to enhance mobile financial services and financially empower African citizens. The collaboration is set to broaden the scope of financial inclusion from first-time users to high-end business applications, utilizing MTN’s Mobile Money (MoMo) service on the Ericsson Wallet Platform.
Ghana Mobile Money Market Report Scope:
| Report Features | Details |
|---|---|
| Base Year of the Analysis | 2025 |
| Historical Period | 2020-2025 |
| Forecast Period | 2026-2034 |
| Units | Billion USD |
| Scope of the Report |
Exploration of Historical Trends and Market Outlook, Industry Catalysts and Challenges, Segment-Wise Historical and Future Market Assessment:
|
| Technology Covered | USSD, Mobile Wallets, Others |
| Business Model Covered | Mobile Led Model, Bank Led Model |
| Transaction Type Covered | Peer to Peer, Bill Payments, Airtime Top-ups, Others |
| Companies Covered | MTN, Vodafone, Tigo, Airtel |
| Customization Scope | 10% Free Customization |
| Post-Sale Analyst Support | 10-12 Weeks |
| Delivery Format | PDF and Excel through Email (We can also provide the editable version of the report in PPT/Word format on special request) |
Key Benefits for Stakeholders:
- IMARC’s report offers a comprehensive quantitative analysis of various market segments, historical and current market trends, market forecasts, and dynamics of the Ghana mobile money market from 2020-2034.
- The research study provides the latest information on the market drivers, challenges, and opportunities in the Ghana mobile money market.
- Porter's Five Forces analysis assists stakeholders in assessing the impact of new entrants, competitive rivalry, supplier power, buyer power, and the threat of substitution. It helps stakeholders to analyze the level of competition within the Ghana mobile money industry and its attractiveness.
- Competitive landscape allows stakeholders to understand their competitive environment and provides an insight into the current positions of key players in the market.
Frequently Asked Questions About the Ghana Mobile Money Market Report Report
The mobile money market in Ghana was valued at USD 227.3 Billion in 2025.
The growth of Ghana's mobile money market is driven by increasing financial inclusion, high mobile phone penetration, strong remittance inflows, and innovative telecom-fintech partnerships. Regulatory support, ease of use, affordability, and accessibility in rural areas further fuel adoption, making mobile money a preferred platform for financial transactions. The factors, collectively, are creating a positive Ghana mobile money market outlook, across the region.
The Ghana mobile money market is projected to exhibit a CAGR of 16.81% during 2026-2034, reaching a value of USD 957.7 Billion by 2034.
USSD holds the largest share due to its accessibility on basic phones, ensuring mobile money services reach a broader population.
The mobile-led model dominates due to telecom operators' extensive networks, reaching underserved areas and providing accessible, convenient financial services.
Peer-to-peer dominates as it offers easy, affordable, and instant money transfers, particularly for remittances and daily transactions.
Some of the major players in the Ghana mobile money market include MTN, Vodafone, Tigo, Airtel.
Need more help?
- Speak to our experienced analysts for insights on the current market scenarios.
- Include additional segments and countries to customize the report as per your requirement.
- Gain an unparalleled competitive advantage in your domain by understanding how to utilize the report and positively impacting your operations and revenue.
- For further assistance, please connect with our analysts.
 Request Customization
 Speak to an Analyst
 Request Brochure
 Inquire Before Buying
Benefits of Customization
- Personalize this research
- Triangulate with your data
- Get data as per your format and definition
- Gain a deeper dive into a specific application, geography, customer, or competitor
- Any level of personalization
Get in Touch With Us
UNITED STATES
Phone: +1-201-971-6302
INDIA
Phone: +91-120-433-0800
UNITED KINGDOM
Phone: +44-753-714-6104
Email: [email protected]
Client Testimonials


.webp)


