
Indonesia Edible Oil Market Size, Share, Trends and Forecast by Type, Packaging Type, Packaging Material, Pack Size, Application, and Distribution Channel, 2026-2034
Market Overview:
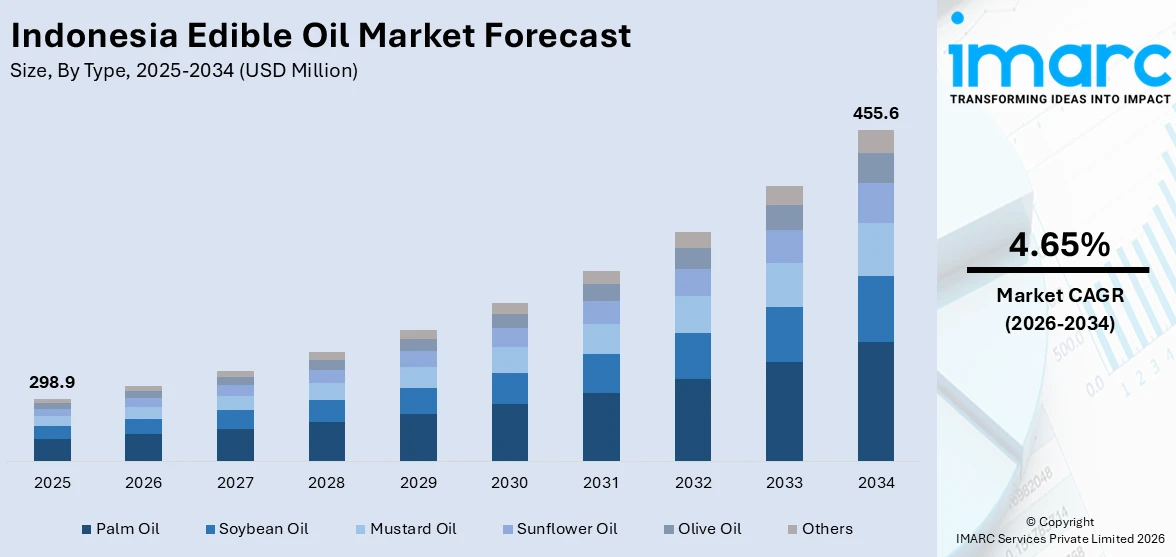
The Indonesia edible oil market size reached USD 298.9 Million in 2025. Looking forward, IMARC Group expects the market to reach USD 455.6 Million by 2034, exhibiting a growth rate (CAGR) of 4.65% during 2026-2034.
|
Report Attribute
|
Key Statistics
|
|---|---|
|
Base Year
|
2025 |
|
Forecast Years
|
2026-2034
|
|
Historical Years
|
2020-2025
|
| Market Size in 2025 | USD 298.9 Million |
| Market Forecast in 2034 | USD 455.6 Million |
| Market Growth Rate (2026-2034) | 4.65% |
Edible oil refers to the fatty liquid extracted from various vegetable- and animal-based sources at lower temperatures. Some of the common varieties include palm oil, soybean oil, mustard oil, sunflower oil, olive oil, etc. These edible oils contain a high amount of essential fat-soluble vitamins, polyunsaturated fatty acids, and minerals, such as zinc, phytosterols, selenium, etc. As a result, they are widely adopted for extensive cooking purposes across hotels, cafes, food processing units, restaurants, households, etc.
To get more information on this market Request Sample
In Indonesia, the expanding food processing industry along with the wide applications of edible oil in baking, dressing, frying, etc., is augmenting the market growth. The changing consumer dietary patterns with their hectic work schedules are propelling the consumption of processed food items that utilize edible oil as food preservatives and flavoring agents, thereby catalyzing the product demand in the country. Moreover, the growing consumer health concerns towards the high prevalence of several lifestyle diseases, such as cardiovascular ailments, diabetes, obesity, gastrointestinal disorders, etc., are primarily driving the demand for healthy edible oils. Additionally, the rising demand for vegetable oil-based margarine as a healthier substitute to butter, particularly among health-conscious and lactose-intolerance consumers, is further propelling the market growth. Apart from this, the increasing consumer inclination towards organic edible oils that are free from synthetic preservatives is also bolstering the product demand in the country. In the coming years, continuous upgradations in cold-pressing and refining technologies for enhanced oil production will continue to drive the market for edible oils in Indonesia.
Key Market Segmentation:
IMARC Group provides an analysis of the key trends in each sub-segment of the Indonesia edible oil market report, along with forecasts for the period 2026-2034. Our report has categorized the market based on type, packaging type, packaging material, pack size, application and distribution channel.
Breakup by Type:
- Palm Oil
- Soybean Oil
- Mustard Oil
- Sunflower Oil
- Olive Oil
- Others
Breakup by Packaging Type:
- Pouches
- Jars
- Cans
- Bottles
Breakup by Packaging Material:
- Metal
- Plastic
- Paper
- Others
Breakup by Pack Size:
- Less than 1 Litres
- 1 Litres
- 1 Litres - 5 Litres
- 5 Litres - 10 Litres
- 10 Litres and Above
Breakup by Application:
Access the comprehensive market breakdown Request Sample
- HoReCa
- Home Users
- Food Processing Industry
Breakup by Distribution Channel:
- Direct/Institutional Sales
- Supermarkets and Hypermarkets
- Convenience Stores
- Online
- Others
Competitive Landscape:
The competitive landscape of the industry has also been examined with some of the key players being Astra Agro Lestari Tbk PT, PT. Asianagri Hilir, PT. Bina Karya Prima, PT Cargill Indonesia (Cargill, Incorporated), PT PP London Sumatra Indonesia Tbk, PT Salim Ivomas Pratama Tbk, PT Smart TBK, PT Socfin Indonesia, PT Tunas Baru Lampung Tbk and Wilmar International Ltd.
Report Coverage:
| Report Features | Details |
|---|---|
| Base Year of the Analysis | 2025 |
| Historical Period | 2020-2025 |
| Forecast Period | 2026-2034 |
| Units | Million USD, Million Tons |
| Segment Coverage | Type, Packaging Type, Packaging Material, Pack Size, Application, Distribution Channel |
| Companies Covered | Astra Agro Lestari Tbk PT, PT. Asianagri Hilir, PT. Bina Karya Prima, PT Cargill Indonesia (Cargill, Incorporated), PT PP London Sumatra Indonesia Tbk, PT Salim Ivomas Pratama Tbk, PT Smart TBK, PT Socfin Indonesia, PT Tunas Baru Lampung Tbk, Wilmar International Ltd. |
| Customization Scope | 10% Free Customization |
| Post-Sale Analyst Support | 10-12 Weeks |
| Delivery Format | PDF and Excel through Email (We can also provide the editable version of the report in PPT/Word format on special request) |
Frequently Asked Questions About the Indonesia Edible Oil Market Report
We expect the Indonesia edible oil market to exhibit a CAGR of 4.65% during 2026-2034.
The rising prevalence of numerous lifestyle diseases, such as stroke, diabetes, obesity, etc., along with the increasing demand for organic edible oils that are free from synthetic preservatives, is primarily driving the Indonesia edible oil market.
The sudden outbreak of the COVID-19 pandemic has led to the changing consumer inclination from conventional brick-and-mortar distribution channels towards online retail platforms for the purchase of edible oils across the nation.
Based on the type, the Indonesia edible oil market has been divided into palm oil, soybean oil, mustard oil, sunflower oil, olive oil, and others. Among these, palm oil currently holds the largest market share.
Based on the packaging type, the Indonesia edible oil market can be segmented into pouches, jars, cans, and bottles. Currently, pouches account for the majority of the total market share.
Based on the packaging material, the Indonesia edible oil market has been bifurcated into metal, plastic, paper, and others, where plastic currently exhibits a clear dominance in the market.
Based on the pack size, the Indonesia edible oil market can be categorized into less than 1 liters, 1 liters, 1 liters - 5 liters, 5 liters - 10 liters, and 10 liters and above. Currently, 1 litres-5 liters account for the majority of the total market share.
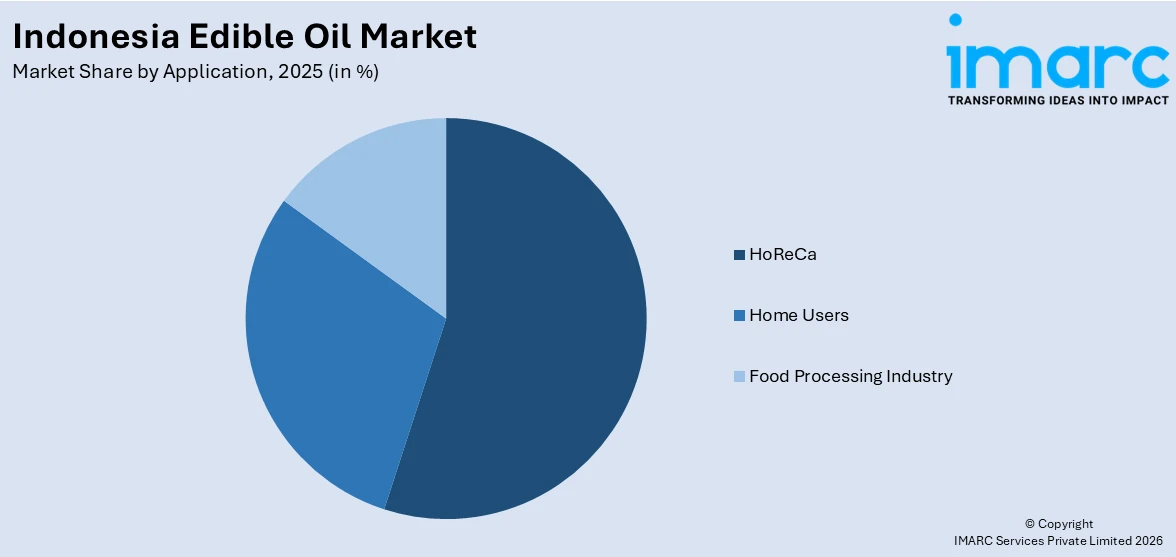
Based on the application, the Indonesia edible oil market has been segregated into HoReCa, home users, and food processing industry. Among these, home users currently exhibit a clear dominance in the market.
Based on the distribution channel, the Indonesia edible oil market can be bifurcated into direct/institutional sales, supermarkets and hypermarkets, convenience stores, online, and others. Currently, supermarkets and hypermarkets hold the largest market share.
Some of the major players in the Indonesia edible oil market include Astra Agro Lestari Tbk PT, PT. Asianagri Hilir, PT. Bina Karya Prima, PT Cargill Indonesia (Cargill, Incorporated), PT PP London Sumatra Indonesia Tbk, PT Salim Ivomas Pratama Tbk, PT Smart TBK, PT Socfin Indonesia, PT Tunas Baru Lampung Tbk, and Wilmar International Ltd.
Need more help?
- Speak to our experienced analysts for insights on the current market scenarios.
- Include additional segments and countries to customize the report as per your requirement.
- Gain an unparalleled competitive advantage in your domain by understanding how to utilize the report and positively impacting your operations and revenue.
- For further assistance, please connect with our analysts.
 Request Customization
 Speak to an Analyst
 Request Brochure
 Inquire Before Buying
Benefits of Customization
- Personalize this research
- Triangulate with your data
- Get data as per your format and definition
- Gain a deeper dive into a specific application, geography, customer, or competitor
- Any level of personalization
Get in Touch With Us
UNITED STATES
Phone: +1-201-971-6302
INDIA
Phone: +91-120-433-0800
UNITED KINGDOM
Phone: +44-753-714-6104
Email: [email protected]
Client Testimonials


.webp)


