
IoT Connectivity Market Size, Share, Trends and Forecast by Component, Application, Enterprise Size, End Use Industry, and Region, 2026-2034
IoT Connectivity Market Size and Share:
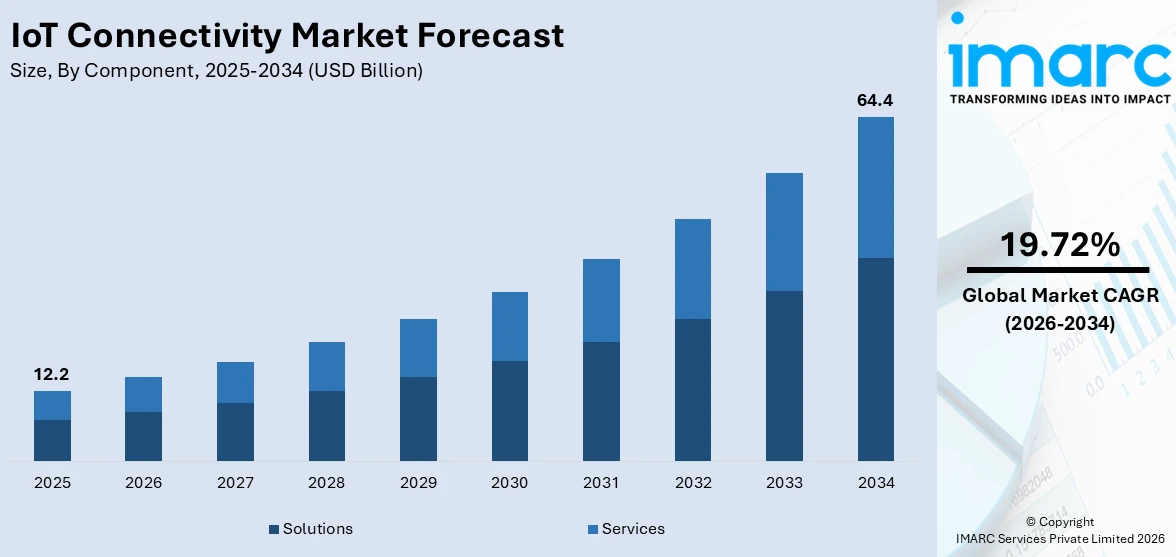
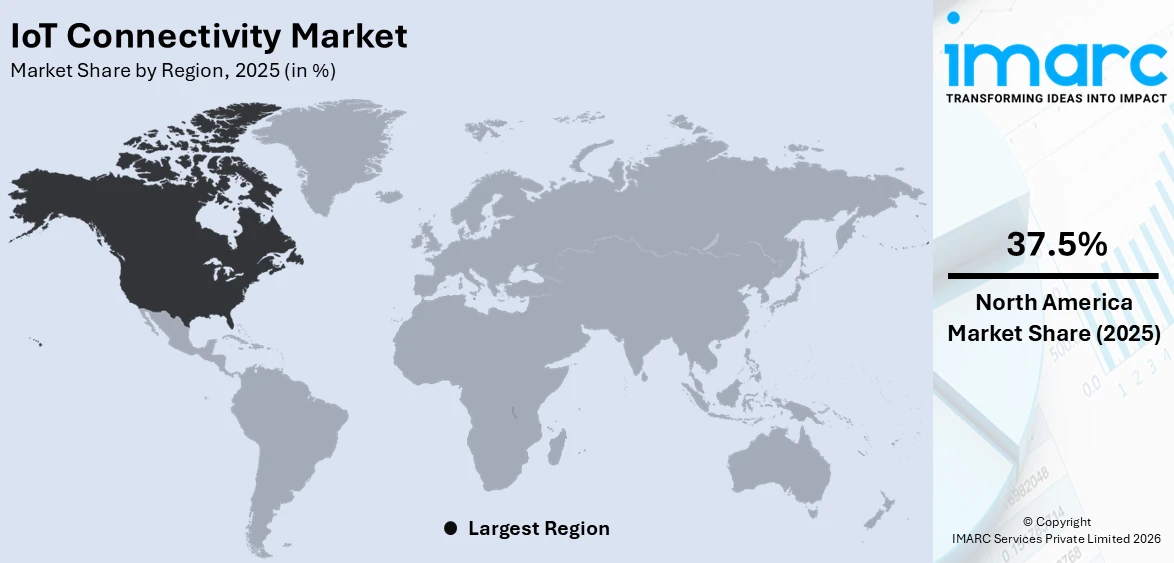
The global IoT connectivity market size was valued at USD 12.2 Billion in 2025. Looking forward, IMARC Group estimates the market to reach USD 64.4 Billion by 2034, exhibiting a CAGR of 19.72% during 2026-2034. North America currently dominates the market, holding a significant market share of over 37.5% in 2025. The market is driven by the widespread adoption of smart devices, advancements in wireless technologies such as 5G, and the need for efficient data exchange across industries. Growing demand for automation, real-time analytics, and predictive maintenance fuels IoT connectivity market share. Additionally, the integration of AI and edge computing with IoT systems creates new opportunities, further accelerating growth across the healthcare, manufacturing, and transportation sectors.
|
Report Attribute
|
Key Statistics
|
|---|---|
|
Base Year
|
2025
|
|
Forecast Years
|
2026-2034
|
|
Historical Years
|
2020-2025
|
|
Market Size in 2025
|
USD 12.2 Billion |
|
Market Forecast in 2034
|
USD 64.4 Billion |
| Market Growth Rate (2026-2034) | 19.72% |
The global IoT connectivity market is driven by the increasing adoption of smart devices, advancements in wireless technologies, and the growing demand for seamless communication across industries. The rise of 5G networks enhances connectivity speeds and reliability, enabling real-time data exchange. Businesses are leveraging IoT to improve operational efficiency, reduce costs, and enhance customer experience. Additionally, government initiatives promoting smart cities and digital transformation further propel IoT connectivity market growth. The deadline for India’s Smart Cities Mission has been extended to March 2025 to allow for the completion of 830 pending projects worth ₹19,926 Crore (approximately USD 2.43 Billion), while 90% of projects have already been completed. Urban infrastructure development continues to be a priority, with ₹46,585 Crore (approximately USD 5.68 Billion) (97% of allocated funds) released and 93% utilized. With construction gaining pace in India, the demand for IoT used in smart city initiatives is rising. The integration of AI and machine learning with IoT systems also creates new opportunities. As industries such as healthcare, manufacturing, and automotive embrace IoT, the need for robust connectivity solutions continues to expand globally.
To get more information on this market Request Sample
United States is one of the most prominent regional markets, largely fueled by the mounting global focus on digital transformation within sectors like retail, agriculture, and transportation. The mounting requirement for remote monitoring and control systems, particularly in the post-pandemic era, has fuelled IoT adoption. Notably, on 31st January 2025, Nulogy launched Smart Factory, a real-time monitoring solution for North American and European manufacturers. This cutting-edge device enables data-driven insights and improves the production efficiency of over 2.6 billion products annually. Investments in smart grid technologies and renewable energy integration are also propelling the IoT connectivity market demand. Moreover, the growth of autonomous vehicles and connected mobility solutions also fuels market growth. Data security innovations and the creation of low-power, wide-area networks (LPWAN) further boost IoT connectivity. Consumer demand for connected, innovative experiences and the drive for sustainability are major drivers of the market's growth.
IoT Connectivity Market Trends:
Industrial Automation Accelerating IoT Adoption
The growing focus on automation in industrial processes is one of the key IoT connectivity market trends. Companies are integrating IoT solutions to enhance operational efficiency, monitor production lines, and detect quality defects in real time. The automation-as-a-service market reached USD 9.4 Billion in 2024 and is forecasted to grow at a CAGR of 21.19%, reaching USD 64.1 Billion by 2033. As industries continue to prioritize automation for cost savings and efficiency, IoT connectivity will play a vital role in ensuring seamless machine-to-machine communication and predictive maintenance. This trend is particularly evident in sectors such as manufacturing, logistics, and energy, where automation is transforming traditional workflows and optimizing productivity.
Rising Adoption of IoT Wearables in Healthcare
IoT-enabled wearables are revolutionizing healthcare by offering real-time health monitoring and remote patient tracking. These devices help healthcare professionals analyze patient data, detect abnormalities, and provide timely medical intervention. Additionally, IoT wearables are widely used to monitor workers' health and safety in hazardous environments, reducing workplace risks. As digital health technologies continue to advance, the demand for IoT-powered wearables is expected to rise, driving market expansion. According to a report by IMARC Group, the global wearable electronics market reached a value of USD 165.4 Billion in 2024. The global smart contract market is expected to grow from USD 133 Billion in 2025 to USD 704.1 Billion by 2033, at a notable CAGR of 16.59% from 2025 to 2033. Moreover, the healthcare industry's increasing focus on preventive care, coupled with advancements in artificial intelligence (AI) and big data analytics, is further strengthening the role of IoT in improving patient outcomes and operational efficiency. Therefore, this is creating a positive IoT connectivity market outlook.
Increasing Smart Cities and Connected Vehicles
Governments worldwide are investing in smart city initiatives to enhance urban infrastructure and sustainability. For example, India allocated INR 7,060 Crores (USD 860 Million) in 2022 to develop 100 smart cities, integrating IoT solutions for energy efficiency, traffic management, and environmental monitoring. Additionally, the growing demand for connected vehicles is driving the adoption of IoT-powered communication systems that enable real-time data exchange between vehicles and infrastructure. Consumers' increasing preference for advanced driving experiences and safety features is enhancing IoT connectivity in the automotive sector. These developments underscore the expanding role of IoT in transforming urban living and mobility solutions.
IoT Connectivity Industry Segmentation:
IMARC Group provides an analysis of the key trends in each segment of the global IoT connectivity market, along with forecast at the global, regional, and country levels from 2026-2034. The market has been categorized based on component, application, enterprise size, and end use industry.
Analysis by Component:
- Solutions
- Services
Solutions stand as the largest component in 2025, holding around 67.8% of the market, driven by their critical role in enabling seamless device communication, data management, and system integration. From hardware and software to platforms, these solutions drive connectivity, analytics, and automation across industries. As the industries are adopting more real-time data processing, remote monitoring, and predictive maintenance, their role has become critical. IoT solutions rely on organizations to make them more efficient, cost-effective, and data-savvy. In addition, these solutions are critical for future advancements in smart cities, industrial IoT, and connected healthcare. The increasing demand for integrated IoT solutions is driven by businesses putting digital transformation at the forefront and is solidifying IoT as the fastest growing segment in the market.
Analysis by Application:
Access the comprehensive market breakdown Request Sample
- Buildings and Home Automation
- Smart Energy and Utility
- Smart Manufacturing
- Smart Retail
- Smart Transportation
- Others
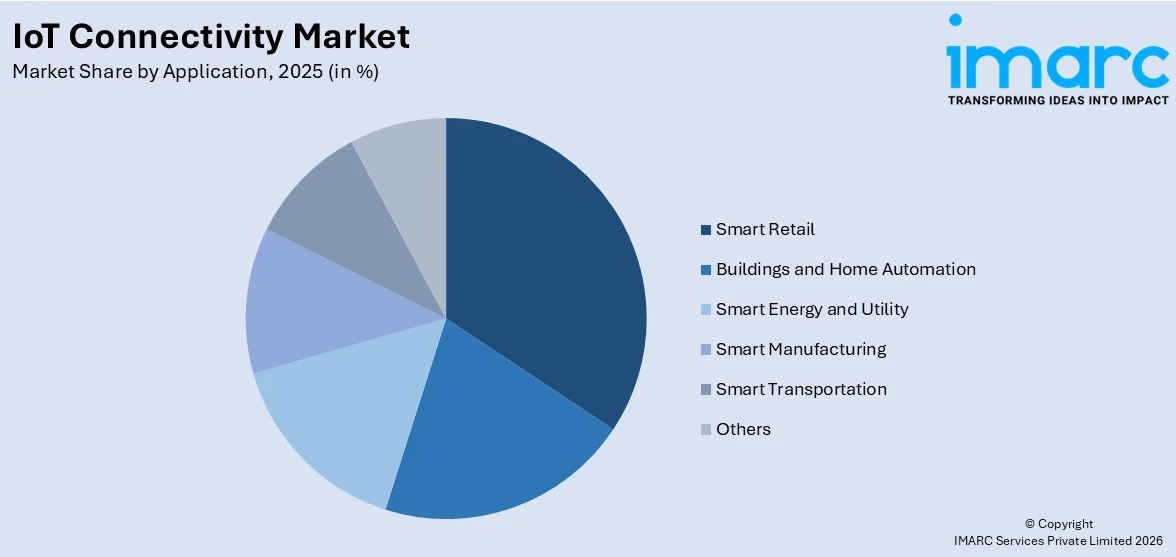
Smart retail leads the market with around 35.3% of market share in 2025, driven by the increasing adoption of technologies that enhance customer experiences and operational efficiency. IoT-enabled technologies such as intelligent shelving, automated checkout systems, and inventory management solutions make retail operations more efficient while reducing expenses. Thus, data analytics powered by IoT allows retailers to implement targeted marketing strategies, helping the retailers gain profound insights about the consumers preferences and behaviors. In addition, the use of IoT in supply chain management enables real-time monitoring and enhances logistics. Moreover, the rising consumer demand for contactless shopping experiences, especially in the post-pandemic world, is also expected to drive the adoption of IoT across the retail industry. Smart retail is the largest application segment in the market as retailers strive for innovative solutions to sustain their competitive edge in the marketplace, with a strong emphasis on innovation.
Analysis by Enterprise Size:
- Small and Medium-sized Enterprises
- Large Enterprises
Large enterprises lead the market with around 59.8% of market share in 2025, primarily due to their extensive resources and ability to invest in advanced IoT solutions. Such organizations have leveraged IoT connectivity to improve operations, enhance supply chain performance, and provide superior customer experiences. Due to their complex structures and diverse operational needs, large enterprises utilize IoT for predictive maintenance, real-time data processing, and automation across multiple sites. These are also the organizations whose digital transformation and innovation significantly drive IoT adoption. Additionally, large enterprises generally also have the scalability to adopt IoT technologies in various departments and enable connection. Thus, they lead the market by using IoT to maintain competitiveness and ensure long-term growth.
Analysis by End Use Industry:
- BFSI
- Healthcare
- Travel and Hospitality
- Defense and Aerospace
- IT and Telecommunication
- Retail and E-Commerce
- Manufacturing
- Others
BSFI leads the market with around 25.8% of market share in 2025, driven by the need for enhanced security, operational efficiency, and customer engagement. Using IoT solutions, ATMs, bank branches, and server rooms can be monitored in real-time, which will help increase security and prevent fraud. By utilizing IoT-enabled data analytics, banks can offer personalized experiences for their customers, increasing satisfaction and loyalty. In addition, IoT solutions simplify processes such as payment processing, asset management, and risk assessment. The focus on digital transformation and automation across the sector significantly drives the adoption of IoT. Aided by the rising focus on innovation among financial institutions to accommodate changing customer needs and regulatory requirements, the Banking, Financial Services, and Insurance (BFSI) sector has emerged as a key source of growth for the market.
Regional Analysis:
To get more information on the regional analysis of this market Request Sample
- North America
- United States
- Canada
- Asia Pacific
- China
- Japan
- India
- South Korea
- Australia
- Indonesia
- Others
- Europe
- Germany
- France
- United Kingdom
- Italy
- Spain
- Russia
- Others
- Latin America
- Brazil
- Mexico
- Others
- Middle East and Africa
In 2025, North America accounted for the largest market share of over 37.5%, driven by advanced technological infrastructure, high adoption rates of IoT solutions, and significant investments in innovation. The region benefits from widespread 5G deployment, robust internet connectivity, and a strong presence of leading IoT providers. Industries such as healthcare, manufacturing, and smart retail extensively leverage IoT for automation, real-time analytics, and operational efficiency. Government initiatives promoting smart cities and digital transformation further fuel market growth. Additionally, the presence of tech-savvy consumers and enterprises prioritizing digitalization accelerates IoT adoption. With its mature ecosystem and focus on cutting-edge technologies, North America continues to lead the market.
Key Regional Takeaways:
United States IoT Connectivity Market Analysis
The US accounted for around 88.60% of the total North America IoT connectivity market in 2025. The U.S. IoT connectivity market is experiencing rapid growth, driven by the increasing adoption of smart devices and the demand for automation across sectors. The continuous advancement of 5G technology serves as a crucial catalyst, offering the high bandwidth and low latency essential for the smooth functioning of IoT systems. The increasing number of connected devices in sectors such as healthcare, automotive, manufacturing, and agriculture is significantly driving the demand for IoT solutions. Furthermore, the U.S. AI market, valued at USD 31,807.6 Million in 2023, is forecasted to be the largest market at USD 97,084.2 Million by 2032, indulging the same CAGR of 12.8% for 2024-2032. This growth of AI acts as a complement for IoT, where better device interconnectivity is achieved, along with higher data analysis proficiency. The development of digital infrastructure, smart cities, and additional Government initiatives for green technology are all factors contributing to market growth. The increasing demand for real-time processing of data with remote monitoring and the need for smart solutions for energy efficiency in households and industries is driving IoT adoption. As investments in 5G networks, connected devices, and smart technologies continue to penetrate the U.S. market, IoT is expected to experience explosive growth, driving innovation in the country and opening up new opportunities for multiple industries.
Asia Pacific IoT Connectivity Market Analysis
Rapid urbanization and extensive integration of smart technologies are driving growth of the APAC market in recent years. The rollout of 5G networks is driving growth in big markets including South Korea and China. South Korea recorded 31.3 million 5G connections, more than 48 percent of the nation's total mobile connections, while China has the highest number of 5G connections with over 700 million, accounting for 41 percent of mobile connections, according to GSMA. Such advances offer improved and more reliable connectivity, driving the adoption of IoT systems across industries such as healthcare, manufacturing, and agriculture. Moreover, the rise of smart cities, connected devices, and digital infrastructure catalyzed by government investments are driving IoT adoption in the region. As more sectors embrace IoT technologies, such as connected vehicles and smart homes, the APAC market is set for substantial growth.
Europe IoT Connectivity Market Analysis
The market in Europe is expanding due to strong digital transformation initiatives and government-backed support for innovation. According to reports, 29% of EU enterprises used Internet of Things devices in 2021, mainly for security purposes, highlighting the growing interest in IoT solutions. The expansion of 5G networks across the region has also played a key role, with their high-speed and low-latency capabilities being essential for IoT applications. The EU’s Green Deal and sustainability objectives are paving the way for the adoption of energy-efficient IoT technologies across multiple sectors like agriculture, automotive, and energy. Another major factor fueling the growth of IoT manufacturing and logistics in Europe is the industrial sector, which constantly seeks maximum efficiency and cost reduction. The increasing adoption of IoT in the automotive sector, especially connected vehicles, and their use in the healthcare sector to improve the treatment of patients and the operation of healthcare facilities is expected to drive this growth. Simultaneously, as concerns over data privacy and cybersecurity continue to grow, the demand for more secure IoT solutions is also fueling the innovation of IoT security technologies. With IoT being widely adopted across various fields, Europe is expected to experience high market share growth over the years in the North American IoT connectivity department, establishing itself as a pivotal forerunner in the global realm of IoT.
Latin America IoT Connectivity Market Analysis
According to GSMA, mobile technologies and services contributed 8% of Latin America's GDP or USD 520 billion in economic value in 2023. Such a substantial contribution to the economy is driving the growth of the market. Increasing deployment of 5G networks and the high demand for smart city projects and IoT applications in agriculture, healthcare, and manufacturing sectors will be driving adoption of IoT across the region. The move to digital transformation and the growing demand for real-time data analysis are two important aspects driving the IoT connectivity growth in Latin America.
Middle East and Africa IoT Connectivity Market Analysis
The growing need for cost-efficient connectivity due to quick infrastructure development and urbanization is another factor assisting the adoption of IoT connectivity across the Middle East and Africa (MEA) region. In 2023, the region had 0.28 billion IoT devices as per industry reports, which shows an enormous rising demand for connected solutions across the sectors. Key factors behind this growth are the deployment of 5G networks, government-run smart city efforts, and heavy investments in digital transformation. Moreover, the increasing adoption of IoT applications in healthcare, energy, logistics, and security is also likely to propel the market in the region, which is expected to grow through the forecast period.
Competitive Landscape:
The competitive scenario of the market is facilitated by intense competition among prominent players, supported by a considerable investment required for innovation and market expansion. Hence, companies are heavily investing in the development of advanced IoT solutions, a number of connectivity platforms, analytical tools, and security systems. Strategic partnerships and collaborations are common in the industry. Organizations across the globe are working hard to improve their products and to enter new markets. Another very important aspect is the use of artificial intelligence and machine learning with IoT to provide better, data-driven solutions. Moreover, the growing focus on enhancing the network foundation from 5G to LPWAN to ensure seamless connectivity is also favoring the market. Furthermore, organizations are also focusing on sector-specific applications to target industries such as healthcare, manufacturing, and retail to drive growth and differentiation.
The report provides a comprehensive analysis of the competitive landscape in the IoT connectivity market with detailed profiles of all major companies, including:
- Aeris Communications India Pvt. Ltd
- AT&T Inc.
- Cisco Systems Inc.
- Huawei Technologies Co. Ltd.
- Orange
- Sierra Wireless
- Sigfox
- Telefonaktiebolaget LM Ericsson
- Telefónica S.A.
- Telit IoT Platforms, LLC
- Verizon Communications Inc
- Vodafone Group Plc
Latest News and Developments:
- February 2025: Vodafone Business IoT has partnered with Mobily to expand IoT connectivity services in Saudi Arabia. This collaboration enables Vodafone’s IoT customers to deploy connected devices across the region using Mobily’s network, ensuring secure and compliant connectivity with local regulations.
- October 2024: EchoStar Mobile collaborated with IoT startup Connected to launch Connected One, a portable device enabling satellite connectivity in remote areas. Under a three-year agreement, EchoStar Mobile supplied EM2050 satellite IoT modules, utilizing LoRa technology in the S-band spectrum. Initially launched in Europe with EchoStar XXI coverage, Connected planned to expand service to the U.S. later in the year.
- August 2024: Sateliot has successfully launched four additional satellites as part of its 5G NB-IoT NTN constellation, enhancing global telecom coverage. The satellites were deployed via SpaceX’s Transporter-11 mission on August 16 aboard a Falcon 9 rocket from Vandenberg Air Force Base, USA. A launch event in Barcelona, attended by industry stakeholders, featured discussions on Sateliot’s future plans. CEO Jaume Sanpera emphasized the company’s role in advancing IoT connectivity and positioning Spain as a global leader.
- June 2024: Dhruva Space and Kinéis are collaborating to introduce Kinéis IoT connectivity in India and launch a Kinéis IoT payload on Dhruva Space’s P-30 satellite. This partnership aims to expand space-based IoT solutions, leveraging Kinéis' 25-satellite constellation and Dhruva Space’s satellite expertise. Dhruva Space will support Kinéis IoT services and develop new applications tailored to the Indian market.
- March 2024: XL Axiata has collaborated with Cisco to launch IoT Connectivity+, a cloud-centric IoT management platform. This innovative solution facilitates extensive IoT deployments through AI-driven anomaly detection, real-time monitoring, and automated cost management.
IoT Connectivity Market Report Scope:
| Report Features | Details |
|---|---|
| Base Year of the Analysis | 2025 |
| Historical Period | 2020-2025 |
| Forecast Period | 2026-2034 |
| Units | Billion USD |
| Scope of the Report |
Exploration of Historical Trends and Market Outlook, Industry Catalysts and Challenges, Segment-Wise Historical and Future Market Assessment:
|
| Components Covered | Solutions, Services |
| Applications Covered | Buildings and Home Automation, Smart Energy, and Utility, Smart Manufacturing, Smart Retail, Smart Transportation, Others |
| Enterprise Sizes Covered | Small and Medium-sized Enterprises, Large Enterprises |
| End Use Industries Covered | BFSI, Healthcare, Travel and Hospitality, Defense and Aerospace, IT and Telecommunication, Retail and E-Commerce, Manufacturing, Others |
| Regions Covered | Asia Pacific, Europe, North America, Latin America, Middle East and Africa |
| Countries Covered | United States, Canada, Germany, France, United Kingdom, Italy, Spain, Russia, China, Japan, India, South Korea, Australia, Indonesia, Brazil, Mexico |
| Companies Covered | Aeris Communications India Pvt. Ltd, AT&T Inc., Cisco Systems Inc., Huawei Technologies Co. Ltd., Orange, Sierra Wireless, Sigfox, Telefonaktiebolaget LM Ericsson, Telefónica S.A., Telit IoT Platforms, LLC, Verizon Communications Inc., Vodafone Group Plc, etc. |
| Customization Scope | 10% Free Customization |
| Post-Sale Analyst Support | 10-12 Weeks |
| Delivery Format | PDF and Excel through Email (We can also provide the editable version of the report in PPT/Word format on special request) |
Key Benefits for Stakeholders:
- IMARC’s report offers a comprehensive quantitative analysis of various market segments, historical and current market trends, market forecasts, and dynamics of the IoT connectivity market from 2020-2034.
- The IoT connectivity market research report provides the latest information on the market drivers, challenges, and opportunities in the global market.
- The study maps the leading, as well as the fastest-growing, regional markets. It further enables stakeholders to identify the key country-level markets within each region.
- Porter's five forces analysis assist stakeholders in assessing the impact of new entrants, competitive rivalry, supplier power, buyer power, and the threat of substitution. It helps stakeholders to analyze the level of competition within the IoT connectivity industry and its attractiveness.
- Competitive landscape allows stakeholders to understand their competitive environment and provides an insight into the current positions of key players in the market.
Frequently Asked Questions About the IoT Connectivity Market Report
The IoT connectivity market was valued at USD 12.2 Billion in 2025.
IMARC estimates the IoT connectivity market to exhibit a CAGR of 19.72% during 2026-2034, reaching a value of USD 64.4 Billion by 2034.
The market is driven by the widespread adoption of smart devices, advancements in wireless technologies including 5G, and the need for efficient data exchange across industries. Other key factors include the rising demand for automation, real-time analytics, and predictive maintenance, as well as the integration of AI and edge computing in IoT systems.
North America currently dominates the IoT connectivity market, accounting for a share exceeding 37.5% in 2025. This dominance is fueled by advanced technological infrastructure, high adoption of IoT solutions, significant 5G deployment, and strong investments in innovation across industries such as healthcare, manufacturing, and smart retail.
Some of the major players in the IoT connectivity market include Aeris Communications India Pvt. Ltd, AT&T Inc., Cisco Systems Inc., Huawei Technologies Co. Ltd., Orange, Sierra Wireless, Sigfox, Telefonaktiebolaget LM Ericsson, Telefónica S.A., Telit IoT Platforms, LLC, Verizon Communications Inc., and Vodafone Group Plc, among others.
Need more help?
- Speak to our experienced analysts for insights on the current market scenarios.
- Include additional segments and countries to customize the report as per your requirement.
- Gain an unparalleled competitive advantage in your domain by understanding how to utilize the report and positively impacting your operations and revenue.
- For further assistance, please connect with our analysts.
 Request Customization
 Speak to an Analyst
 Request Brochure
 Inquire Before Buying
Benefits of Customization
- Personalize this research
- Triangulate with your data
- Get data as per your format and definition
- Gain a deeper dive into a specific application, geography, customer, or competitor
- Any level of personalization
Get in Touch With Us
UNITED STATES
Phone: +1-201-971-6302
INDIA
Phone: +91-120-433-0800
UNITED KINGDOM
Phone: +44-753-714-6104
Email: [email protected]
Client Testimonials


.webp)


