
Lopinavir Prices, Trend, Chart, Demand, Market Analysis, News, Historical and Forecast Data Report 2026 Edition
Lopinavir Price Trend, Index and Forecast
Track the latest insights on lopinavir price trend and forecast with detailed analysis of regional fluctuations and market dynamics across North America, Latin America, Central Europe, Western Europe, Eastern Europe, Middle East, North Africa, West Africa, Central and Southern Africa, Central Asia, Southeast Asia, South Asia, East Asia, and Oceania.
Lopinavir Prices Outlook Q1 2026
- USA: USD 858,424/MT
- China: USD 613,013/MT
- Germany: USD 744,608/MT
- India: USD 648,344/MT
- Canada: USD 1,020,315/MT
Lopinavir Price Chart

Get real-time access to monthly/quarterly/yearly prices Request Sample
During the first quarter of 2026, the lopinavir prices in the USA reached 858,424 USD/MT in March. Prices moved upward as pharmaceutical procurement remained firm and buyers focused on securing stable API availability. Demand from antiretroviral formulation manufacturers supported the market, with consistent purchasing from contract manufacturers and specialty drug producers. Import costs also stayed elevated due to tight availability from qualified overseas suppliers.
During the first quarter of 2026, the lopinavir prices in China reached 613,013 USD/MT in March. The market recorded an upward movement as domestic API producers faced steady demand from formulation units and export linked buyers. Manufacturing costs remained supported by firm intermediate prices, solvent expenses, and regulated production standards. Producers maintained disciplined supply, which helped prevent excess inventory buildup.
During the first quarter of 2026, the lopinavir prices in Germany reached 744,608 USD/MT in March. Prices increased as regulated pharmaceutical demand remained steady and buyers prioritized secure supply from approved vendors. The market was supported by higher procurement costs for imported APIs, strict quality certification requirements, and controlled inventory management among drug manufacturers. Demand from generic formulation producers stayed stable, with buyers maintaining planned purchasing schedules.
During the first quarter of 2026, the lopinavir prices in India reached 648,344 USD/MT in March. Prices strengthened as domestic formulation demand remained active and export oriented pharmaceutical producers continued regular procurement. API manufacturers faced firm input costs, including intermediates, solvents, and compliance related expenses. Stable demand from antiretroviral drug makers supported market sentiment. Export orders from regulated and semi regulated markets also helped maintain price firmness.
During the first quarter of 2026, the lopinavir prices in Canada reached 1,020,315 USD/MT in March. Prices rose as the market remained dependent on imported supply and regulated pharmaceutical procurement. Buyers faced elevated landed costs due to supplier qualification requirements, documentation, and distribution expenses. Demand from specialty pharmaceutical channels stayed steady, supported by planned inventory replenishment and secure sourcing needs.
Lopinavir Prices Outlook Q4 2025
- USA: USD 847,240/MT
- China: USD 600,287/MT
- Germany: USD 727,583/MT
- India: USD 635,071/MT
- Canada: USD 1,005,732/MT
During the fourth quarter of 2025, the lopinavir prices in the USA reached 847,240 USD/MT in December. The upward movement was driven by firm pharmaceutical procurement cycles and steady demand from antiretroviral formulation manufacturers. Elevated production costs, particularly for active pharmaceutical ingredient processing and regulatory compliance, exerted additional pressure on suppliers. Tight inventory management strategies adopted by distributors limited spot market availability, reinforcing price gains.
During the fourth quarter of 2025, the lopinavir prices in China reached 600,287 USD/MT in December. The marginal decline observed during the quarter was primarily attributed to ample domestic production and stable raw material availability. Pharmaceutical manufacturing units operated at balanced utilization rates, preventing supply shortages. Export demand remained moderate, while domestic procurement was steady but not aggressive, resulting in a softer pricing environment.
During the fourth quarter of 2025, the lopinavir prices in Germany reached 727,583 USD/MT in December. Prices edged downward amid stable but cautious procurement by pharmaceutical manufacturers. The European market faced moderated purchasing volumes as healthcare providers optimized inventories toward year-end. Supply availability remained sufficient due to consistent imports and regional distribution networks. Energy and operational costs stabilized compared to previous quarters, reducing cost-driven upward pressure.
During the fourth quarter of 2025, the lopinavir prices in India reached 635,071 USD/MT in December. The modest decline was influenced by steady domestic production and comfortable raw material inventories among active pharmaceutical ingredient manufacturers. Export demand showed moderate momentum but was insufficient to counterbalance stable domestic supply. Competitive pricing strategies among major producers contributed to softer market sentiment. Additionally, improvements in logistics and smoother port operations reduced supply chain disruptions, supporting adequate availability.
During the fourth quarter of 2025, the lopinavir prices in Canada reached 1,005,732 USD/MT in December. The upward trend was supported by firm demand from pharmaceutical distributors and healthcare procurement agencies. Limited domestic production capacity and reliance on imports heightened sensitivity to global supply movements. Strengthened purchasing activity toward year-end contributed to tighter spot availability. Additionally, elevated compliance and quality assurance standards added to cost considerations for importers and formulators.
Lopinavir Prices Outlook Q3 2025
- USA: USD 815,438/MT
- China: USD 605,678/MT
- Germany: USD 735,750/MT
- India: USD 642,005/MT
- Canada: USD 977,483/MT
Lopinavir Prices Outlook Q2 2025
- USA: USD 790,000/MT
- China: USD 620,000/MT
- Germany: USD 750,000/MT
- India: USD 650,000/MT
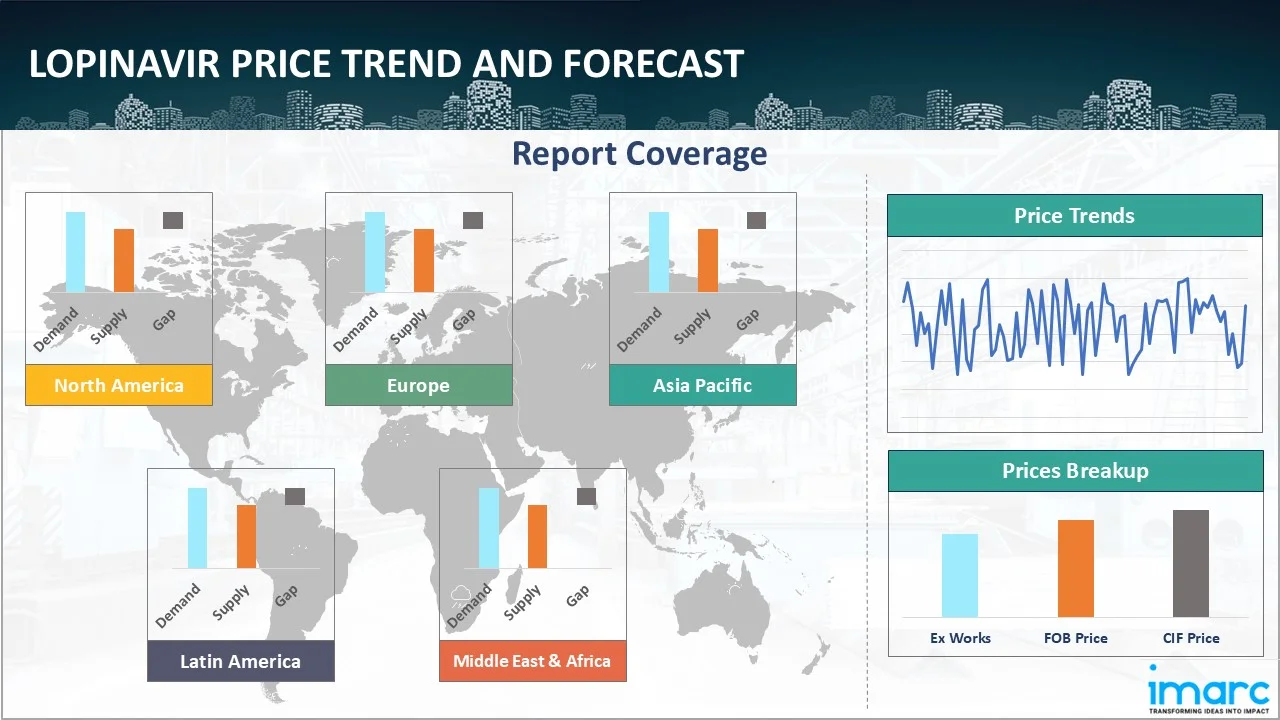
Regional Coverage
The report provides a detailed analysis of the market across different regions, each with unique pricing dynamics influenced by localized market conditions, supply chain intricacies, and geopolitical factors. This includes price trends, price forecast and supply and demand trends for each region, along with spot prices by major ports. The report also provides coverage of FOB and CIF prices, as well as the key factors influencing lopinavir prices.
Europe Lopinavir Price Trend
Q1 2026:
In Europe, the lopinavir price index moved upward as regulated pharmaceutical demand remained firm and buyers focused on supply reliability. Procurement from approved API suppliers supported higher offers, particularly as quality documentation and compliance costs remained significant. Formulation manufacturers maintained steady purchasing schedules to avoid supply interruptions. Import costs stayed firm due to strict vendor qualification requirements and controlled distribution channels. Sellers showed limited willingness to discount because replacement values remained high.
Q4 2025:
During the fourth quarter of 2025, the lopinavir price index in Europe reflected a modest downward trajectory. The region experienced balanced supply conditions supported by stable import flows from Asia and consistent intra-regional distribution. Pharmaceutical manufacturers adopted cautious procurement strategies toward year-end, limiting aggressive buying. Competitive sourcing options influenced supplier pricing decisions, resulting in mild corrections. Energy and compliance-related costs remained stable, preventing upward volatility.
This analysis can be extended to include detailed lopinavir price information for a comprehensive list of countries.
| Region | Countries Covered |
|---|---|
| Europe | Germany, France, United Kingdom, Italy, Spain, Russia, Turkey, Netherlands, Poland, Sweden, Belgium, Austria, Ireland, Switzerland, Norway, Denmark, Romania, Finland, Czech Republic, Portugal, and Greece, among other European countries. |
North America Lopinavir Price Trend
Q1 2026:
In North America, the lopinavir price index increased as buyers prioritized assured supply from qualified vendors. Pharmaceutical distributors and formulation companies maintained regular procurement, supporting firmer offers. Import dependence played a major role in price movement, as landed costs remained elevated due to compliance, documentation, and logistics requirements. Supplier approval processes limited sudden switching between sources, giving approved sellers stronger pricing power. Demand from specialty pharmaceutical channels remained stable.
Q4 2025:
During the fourth quarter of 2025, the lopinavir price index in North America showed a firm upward trend. Demand from pharmaceutical formulators and healthcare procurement programs remained consistent, supporting transaction activity. Limited domestic manufacturing capacity and reliance on imports influenced supply dynamics, tightening spot availability. Distribution and compliance costs contributed to higher landed values. Strategic stock replenishment by market participants ahead of year-end further reinforced price gains. The region maintained structured supply agreements, preventing abrupt disruptions.
Specific lopinavir historical data within the United States and Canada can also be provided.
| Region | Countries Covered |
|---|---|
| North America | United States and Canada |
Middle East and Africa Lopinavir Price Trend
Q1 2026:
The study examines the Middle East and Africa's lopinavir pricing trends and chart, taking into account variables that specifically affect market prices, such as regional industrial expansion, the availability of natural resources, and geopolitical conflicts.
Q4 2025:
As per the lopinavir price chart, the prices in the Middle East and Africa fluctuated due to a complex interplay of factors, primarily driven by supply chain disruptions, seasonal demand shifts, and geopolitical influences.
In addition to region-wise data, information on lopinavir prices for countries can also be provided.
| Region | Countries Covered |
|---|---|
| Middle East & Africa | Saudi Arabia, UAE, Israel, Iran, South Africa, Nigeria, Oman, Kuwait, Qatar, Iraq, Egypt, Algeria, and Morocco, among other Middle Eastern and African countries. |
Asia Pacific Lopinavir Price Trend
Q1 2026:
In Asia Pacific, lopinavir prices increased as API demand from formulation manufacturers improved across major pharmaceutical hubs. China and India remained important supply centers, with producers facing firm intermediate and processing costs. Export demand also supported the market as overseas buyers secured material from qualified suppliers. Regional producers maintained controlled output to avoid inventory pressure, which helped preserve price firmness. Demand from generic antiretroviral manufacturers stayed steady.
Q4 2025:
Across the Asia Pacific region, fourth-quarter lopinavir prices exhibited generally softer trends. Strong manufacturing presence ensured adequate supply availability. Export-oriented production influenced regional trade flows, while domestic pharmaceutical demand remained steady. Competitive pricing among major producing countries contributed to moderated transaction levels. Logistics improvements and streamlined customs procedures supported smooth distribution.
This lopinavir price analysis can be expanded to include a comprehensive list of countries within the region.
| Region | Countries Covered |
|---|---|
| Asia Pacific | China, India, Indonesia, Pakistan, Bangladesh, Japan, Philippines, Vietnam, Thailand, South Korea, Malaysia, Nepal, Taiwan, Sri Lanka, Hongkong, Singapore, Australia, and New Zealand, among other Asian countries. |
Latin America Lopinavir Price Trend
Q1 2026:
The market for lopinavir in Latin America is primarily driven by the region's abundant natural resources, especially in nations like Chile and Brazil. However, lopinavir prices might fluctuate significantly due to different regulatory regimes and political unpredictability.
Q4 2025:
Latin America's lopinavir market is predominantly influenced by its rich natural reserves, particularly in countries like Chile and Brazil. However, political instability and inconsistent regulatory frameworks can lead to significant volatility in lopinavir prices.
This comprehensive review can be extended to include specific countries within the region.
| Region | Countries Covered |
|---|---|
| Latin America | Brazil, Mexico, Argentina, Columbia, Chile, Ecuador, and Peru, among other Latin American countries. |
Lopinavir Price Trend, Market Analysis, and News
IMARC's latest publication, “Lopinavir Prices, Trend, Chart, Demand, Market Analysis, News, Historical and Forecast Data Report 2026 Edition,” presents a detailed examination of the lopinavir market, providing insights into both global and regional trends that are shaping prices. This report delves into the spot price of lopinavir at major ports and analyzes the composition of prices, including FOB and CIF terms. It also presents detailed lopinavir prices trend analysis by region, covering North America, Europe, Asia Pacific, Latin America, and Middle East and Africa. The factors affecting lopinavir pricing, such as the dynamics of supply and demand, geopolitical influences, and sector specific developments, are thoroughly explored. This comprehensive report helps stakeholders stay informed with the latest market news, regulatory updates, and technological progress, facilitating informed strategic decision-making and forecasting.

Lopinavir Industry Analysis
The global lopinavir industry size reached USD 13.23 Billion in 2025. By 2034, IMARC Group expects the market to reach USD 22.21 Billion, at a projected CAGR of 5.75% during 2026-2034. Market expansion is supported by sustained demand for antiretroviral therapies, expanding healthcare access programs, and ongoing pharmaceutical research initiatives.
Latest News and Developments:
- April 2025: In line with ICH–S7B guidance, researchers outlined a validated approach to assess hERG channel blockade and QTc prolongation risk for poorly soluble drugs such as lopinavir and ritonavir. Addressing concentration variability in patch clamp assays, the team introduced prolonged stirring and filtration to remove precipitates, confirmed by light scattering. A validated LC-MS/MS method ensured accurate quantification. Stability testing confirmed analyte integrity under multiple conditions. Reported IC50 values were 5.1 μM for lopinavir and 14.3 μM for ritonavir.
Product Description
Lopinavir is an antiretroviral pharmaceutical compound used mainly as an HIV protease inhibitor. It is commonly formulated with ritonavir, which helps improve lopinavir exposure in the body by slowing its metabolic breakdown. Chemically, lopinavir is an organic API with a complex molecular structure designed to block viral protease activity, limiting the ability of HIV to mature and replicate. It is generally supplied as a pharmaceutical grade active ingredient and requires strict quality control, impurity monitoring, and regulatory documentation. Lopinavir is used in tablets, oral solutions, and fixed dose antiviral formulations. Its industrial use is concentrated in pharmaceutical manufacturing, contract formulation, generic medicine production, and regulated healthcare supply chains.
Report Coverage
| Key Attributes | Details |
|---|---|
| Product Name | Lopinavir |
| Report Features | Exploration of Historical Trends and Market Outlook, Industry Demand, Industry Supply, Gap Analysis, Challenges, Lopinavir Price Analysis, and Segment-Wise Assessment. |
| Currency/Units | US$ (Data can also be provided in local currency) or Metric Tons |
| Region/Countries Covered | The current coverage includes analysis at the global and regional levels only. Based on your requirements, we can also customize the report and provide specific information for the following countries: Asia Pacific: China, India, Indonesia, Pakistan, Bangladesh, Japan, Philippines, Vietnam, Thailand, South Korea, Malaysia, Nepal, Taiwan, Sri Lanka, Hongkong, Singapore, Australia, and New Zealand Europe: Germany, France, United Kingdom, Italy, Spain, Russia, Turkey, Netherlands, Poland, Sweden, Belgium, Austria, Ireland, Switzerland, Norway, Denmark, Romania, Finland, Czech Republic, Portugal and Greece North America: United States and Canada Latin America: Brazil, Mexico, Argentina, Columbia, Chile, Ecuador, and Peru Middle East & Africa: Saudi Arabia, UAE, Israel, Iran, South Africa, Nigeria, Oman, Kuwait, Qatar, Iraq, Egypt, Algeria, and Morocco The list of countries presented is not exhaustive. Information on additional countries can be provided if required by the client. |
| Information Covered for Key Suppliers |
|
| Customization Scope | The report can be customized as per the requirements of the customer |
| Report Price and Purchase Option |
Plan A: Monthly Updates - Annual Subscription
Plan B: Quarterly Updates - Annual Subscription
Plan C: Biannually Updates - Annual Subscription
|
| Post-Sale Analyst Support | 360-degree analyst support after report delivery |
| Delivery Format | PDF and Excel through email (We can also provide the editable version of the report in PPT/Word format on special request) |
Key Benefits for Stakeholders:
- IMARC’s report presents a detailed analysis of lopinavir pricing, covering global and regional trends, spot prices at key ports, and a breakdown of Ex Works, FOB, and CIF prices.
- The study examines factors affecting lopinavir price trend, including raw material costs, supply-demand shifts, geopolitical impacts, and industry developments, offering insights for informed decision-making.
- The competitive landscape review equips stakeholders with crucial insights into the latest market news, regulatory changes, and technological advancements, ensuring a well-rounded, strategic overview for forecasting and planning.
- IMARC offers various subscription options, including monthly, quarterly, and biannual updates, allowing clients to stay informed with the latest market trends, ongoing developments, and comprehensive market insights. The lopinavir price charts ensure our clients remain at the forefront of the industry.
Need more help?
- Speak to our experienced analysts for insights on the current market scenarios.
- Include additional segments and countries to customize the report as per your requirement.
- Gain an unparalleled competitive advantage in your domain by understanding how to utilize the report and positively impacting your operations and revenue.
- For further assistance, please connect with our analysts.
 Request Customization
 Inquire Before Buying
 Speak to an Analyst
 Request Brochure
Benefits of Customization
- Personalize this research
- Triangulate with your data
- Get data as per your format and definition
- Gain a deeper dive into a specific application, geography, customer, or competitor
- Any level of personalization
Get in Touch With Us
UNITED STATES
Phone: +1-201-971-6302
INDIA
Phone: +91-120-433-0800
UNITED KINGDOM
Phone: +44-753-714-6104
Email: [email protected]
Client Testimonials


.webp)


Why Choose Us
IMARC offers trustworthy, data-centric insights into commodity pricing and evolving market trends, enabling businesses to make well-informed decisions in areas such as procurement, strategic planning, and investments. With in-depth knowledge spanning more than 1000 commodities and a vast global presence in over 150 countries, we provide tailored, actionable intelligence designed to meet the specific needs of diverse industries and markets.
1000
+Commodities
150
+Countries Covered
3000
+Clients
20
+Industry
Robust Methodologies & Extensive Resources
IMARC delivers precise commodity pricing insights using proven methodologies and a wealth of data to support strategic decision-making.
Subscription-Based Databases
Our extensive databases provide detailed commodity pricing, import-export trade statistics, and shipment-level tracking for comprehensive market analysis.
Primary Research-Driven Insights
Through direct supplier surveys and expert interviews, we gather real-time market data to enhance pricing accuracy and trend forecasting.
Extensive Secondary Research
We analyze industry reports, trade publications, and market studies to offer tailored intelligence and actionable commodity market insights.
Trusted by 3000+ industry leaders worldwide to drive data-backed decisions. From global manufacturers to government agencies, our clients rely on us for accurate pricing, deep market intelligence, and forward-looking insights.