
Low Voltage Cable Market Size, Share, Trends and Forecast by Installation Type, Material, Overhead Product, Underground Product, End-User, and Region, 2026-2034
Low Voltage Cable Market, 2025 Size and Share:
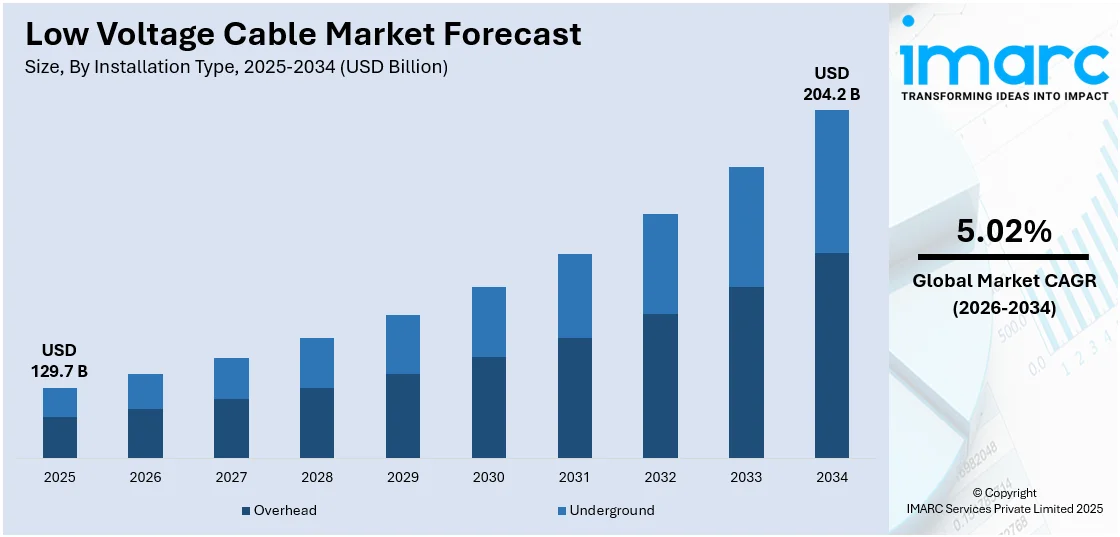
The global low voltage cable market size was valued at USD 129.7 Billion in 2025. Looking forward, IMARC Group estimates the market to reach USD 204.2 Billion by 2034, exhibiting a CAGR of 5.02% from 2026-2034. Asia Pacific currently dominates the market in 2025. The notable growth in the automotive industry, ongoing trend of modernization of aging infrastructure, growing automation and adoption of smart grids, and the increasing emphasis on renewable energy integration are some of the factors propelling the expansion of the low voltage cable market share.
|
Report Attribute
|
Key Statistics
|
|---|---|
|
Base Year
|
2025
|
|
Forecast Years
|
2026-2034
|
|
Historical Years
|
2020-2025
|
|
Market Size in 2025
|
USD 129.7 Billion |
|
Market Forecast in 2034
|
USD 204.2 Billion |
|
Market Growth Rate (2026-2034)
|
5.02% |
The low voltage cable market growth is primarily driven by rising electricity demand across residential, commercial, and industrial sectors, propelled by urbanization and infrastructure expansion. Renewable energy adoption, such as solar and wind power, necessitates efficient low voltage cables for energy distribution. Continual advancements in smart building technologies further fuel growth in the market. On February 29, 2024, Siemens and Enlighted partnered with Zumtobel Group to integrate Enlighted’s IoT sensors into Zumtobel’s lighting systems, advancing energy-efficient solutions for commercial buildings, higher education, and smart hospitals. This collaboration highlights sustainability, occupant well-being, and efficiency, showcased at Light + Building 2024. Additionally, the proliferation of electric vehicles, grid modernization, and rural electrification projects contribute to market expansion, ensuring reliable energy distribution across diverse applications.
To get more information on this market Request Sample
The United States is a key regional market and is majorly propelled by increasing investments in renewable energy projects and the expansion of electric vehicle infrastructure, creating demand for advanced cables to ensure efficient distribution and energy transmission. The modernization of aging grid infrastructure and advancements in smart grid technologies further enhance adoption of innovative cabling solutions. Rising urbanization and ongoing construction projects also fuel demand for energy-efficient cables. Government initiatives, such as the EPA’s renewable energy and energy efficiency programs, significantly support market growth by promoting clean energy adoption. Programs like biogas recovery, combined heat and power, and landfill gas recovery, alongside the RE-Powering America’s Land Initiative, encourage renewable energy development and enhance sustainability. These factors collectively ensure a transition toward a sustainable energy future.
Low Voltage Cable Market Trends:
Considerable Growth in the Automotive Industry
The automotive industry is currently experiencing substantial growth, leading to an increased demand for LV cables for various manufacturing and electrification processes. This is particularly evident in the production of electric vehicles (EVs), where low voltage cables are a critical component. They connect various electrical parts and enable charging functionalities, ensuring that the vehicles operate efficiently and safely. The ongoing global shift towards cleaner and more sustainable transportation options resulted in increased government incentives for EV production and usage. According to International Energy Agency, as of 2023, the global electric vehicle sold about 14 million units with an increase of 35% over the previous year. These incentives are having a profound influence on the market trends for LV cables, as the automotive industry increasingly turns to these components to meet the unique requirements of electric vehicle production. Manufacturers are responding by developing specialized LV cables that can handle the specific demands of automotive applications. In addition, the broader adoption of energy efficiency standards and sustainability goals within the automotive industry created a conducive environment for innovation and low voltage cable market demand.
Rising Trend of Modernization of Aging Infrastructure
An enhanced focus on improving and expanding existing electrical networks is contributing substantially to the growth of the global market. For instance, the Infrastructure Investment and Jobs Act (IIJA), enacted in 2021, allocated approximately USD 65 Billion for energy-related programs, including investments in electric grid resilience and modernization. Low voltage cables are central to the goal of ensuring safe and efficient energy distribution, and their importance cannot be overstated in the context of upgrading older power systems. Outdated infrastructure frequently faces inefficiencies and potential safety hazards, making modernization a pressing need. Upgrading these systems to align with current standards and requirements involves incorporating modern technology, including LV cables, to ensure stability, reliability, and compliance with regulatory requirements. Governments and private entities are investing in infrastructure development projects, recognizing the crucial role that LV cables play in these endeavors. The industry is addressing the diverse and complex demands of infrastructure modernization by encouraging innovation and enforcing strict quality standards.
Rapid Automation and Adoption of Smart Grids
The transition to automated systems and the widespread adoption of smart grids are factors that heavily depend on LV cables, and this dependence is contributing to the expansion of the low voltage cable market share. For instance, according to an industrial report, in the United States, the smart grids are increasingly being adopted. Considerable investments and installations have been seen over the last few years. As of 2022, residential smart meters in the U.S. are over 100 million, compared to less than 40 million in 2012, as per industry report. The role of low voltage cables in the creation of interconnected, intelligent energy networks is pivotal. These cables enable more precise control, monitoring, and distribution of electricity, allowing for the optimization of efficiency and reduction of waste. The deployment of smart grids is considered a significant advancement in energy management, requiring LV cables to ensure seamless functionality. Additionally, the trend towards automation in industrial processes across various sectors necessitates LV cables for reliable operations. The integration of these advanced technologies creates opportunities for the LV cable industry to innovate and expand. With the global drive towards digitization and the adoption of connected technologies, LV cables are emerging as an essential part of modern energy and industrial landscapes.
Low Voltage Cable Industry Segmentation:
IMARC Group provides an analysis of the key trends in each segment of the global low voltage cable market, along with forecast at the global and regional levels from 2026-2034. The market has been categorized based on installation type, material, overhead product, underground product, and end-user.

Analysis by Installation Type:
- Overhead
- Underground
Overhead leads the market share in 2025, influenced by factors such as cost-effectiveness, ease of installation, and adaptability to various terrains. Based on the low voltage cable market outlook, overhead cables are often used in rural electrification, urban settings, and utility applications due to their visibility and ease of maintenance. Infrastructure development and the expansion of power networks further support this segment's growth. The resilience of overhead installation to natural disasters, such as floods, also enhances their reliability in challenging environments. The ongoing expansion of power networks, coupled with rapid infrastructure development and rising energy demand in developing countries, which is further supporting the growth of this segment. Advances in materials and design have also improved the performance and durability of overhead cables, strengthening their market position.
Analysis by Material:
- Copper
- Aluminum
As per the low voltage cable market forecast, aluminum dominates the market share in 2025. It is preferred for its lightweight and cost-efficiency, especially in long-distance transmission. This segment benefits from growth in sectors where weight and cost are major considerations, such as in renewable energy installations. As the world increasingly turns towards sustainable energy sources, the demand for renewable energy installations continues to rise. In such projects, weight and cost considerations become crucial, and aluminum cables are preferred over other materials. Additionally, aluminum's excellent conductivity-to-weight ratio further enhances its suitability for modern energy infrastructure needs.
Analysis by Overhead Product:
- Conductors
- Fittings and Fixtures
- Others
Conductors represent the largest segment in the market, as it is vital for transmitting electrical energy. Driven by demands in various industries, including utilities, manufacturing, and construction, advancements in conductor materials and technologies also support this segment. Continual innovations in conductor technologies allow for higher current-carrying capacity, reduced resistive losses, and enhanced overall efficiency. The shift towards renewable energy and electrification of transportation is also driving the need for advanced conductor systems capable of supporting higher loads and longer distances. Additionally, the development of lightweight and corrosion-resistant conductor materials, such as aluminum alloys and composite cores, further bolsters their adoption in modern energy infrastructure projects. Rising investments in grid modernization and smart grids also ensure sustained demand for conductors.
Analysis by Underground Product:
- PVC Cables
- XLPE Cables
- Cable Terminations
- Cable Joints
- Others
According to the low voltage cable market trends, XLPE cables holds the leading position in the market share, given they offer high-temperature resistance and excellent electrical properties. Their adoption in high-stress environments like utilities and industrial applications supports their market growth. Furthermore, XLPE cables are resistant to moisture and chemical degradation, enhancing their durability in challenging environmental conditions. The growing focus on sustainable energy systems and grid modernization further drives their demand, as they ensure efficient and long-lasting power transmission. Besides this, continual technological advancements in cable manufacturing have also improved the performance and cost-effectiveness of XLPE cables, cementing their dominance in the market.
Analysis by End-User:
Access the comprehensive market breakdown Request Sample
- Infrastructure
- Commercial and Residential
- Transportation
- Others
- Industrial
- Utilities
- Oil and Gas
- Mining
- Chemicals and Petrochemicals
- Others
- Renewables
- Wind
- Solar
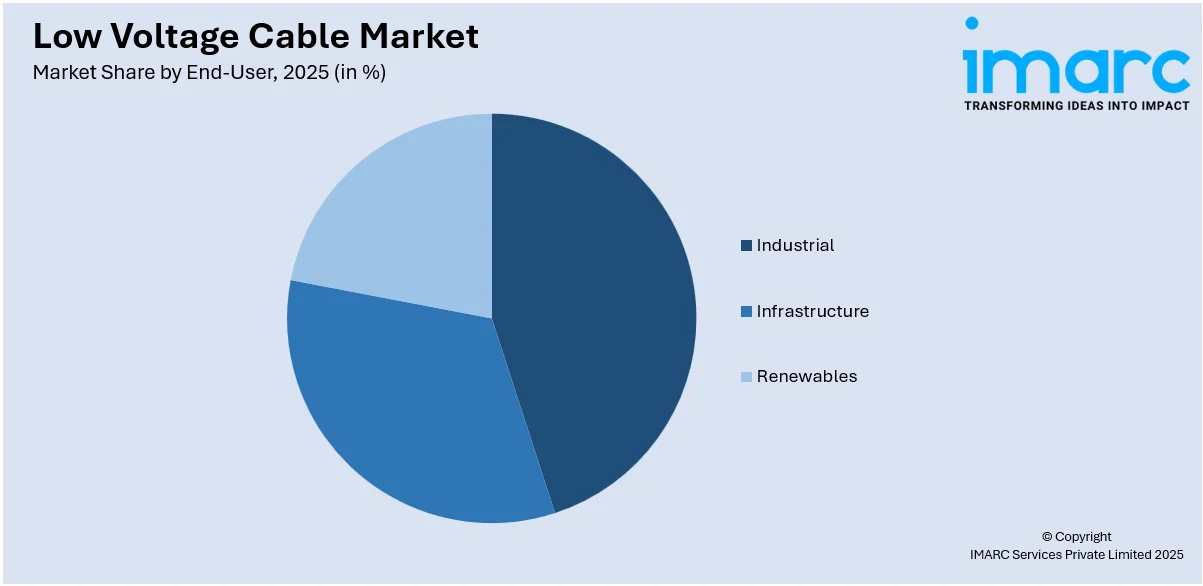
Industrial leads the market share in 2025. In the industrial segment, automation, digitization, and the adoption of energy-efficient practices are the key driving factors. Industries ranging from manufacturing to healthcare are integrating advanced electrical systems that rely on LV cables for their operations. The growing emphasis on minimizing energy waste and improving overall efficiency is leading industries to invest in LV cable systems that meet specific needs and standards. In addition to this, the expansion of renewable energy installations and electric vehicle manufacturing is further strengthening demand in the industrial segment. The focus on compliance with stringent safety regulations also encourages industries to adopt high-quality LV cable systems, enhancing reliability and operational safety.
Regional Analysis:
To get more information on the regional analysis of this market Request Sample
- Asia Pacific
- Europe
- North America
- Middle East and Africa
- Latin America
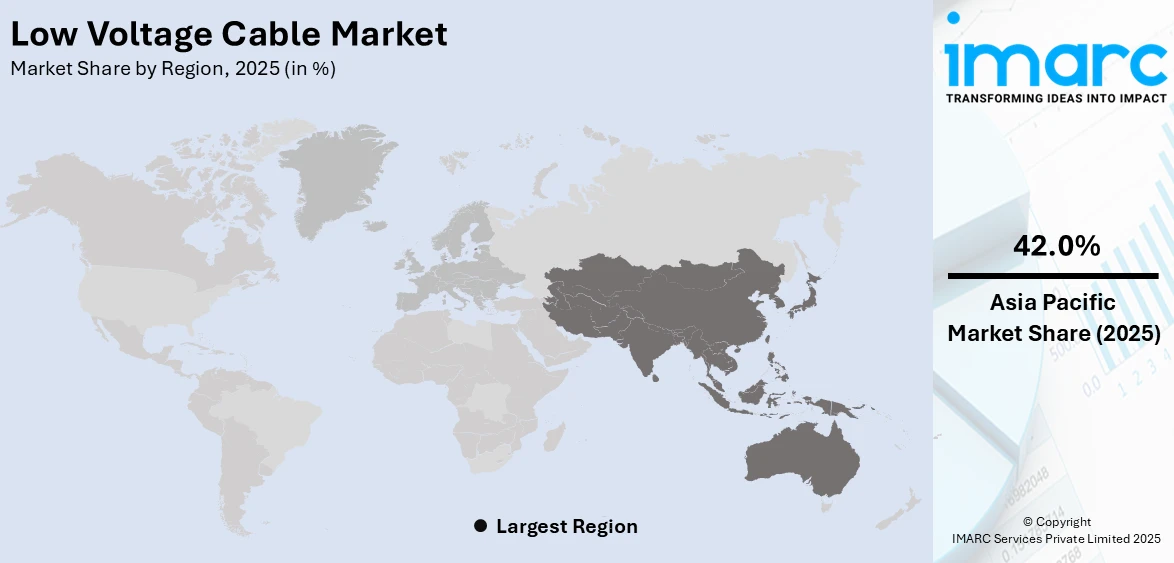
In 2025, Asia Pacific accounted for the largest market share attributed to several factors. Rapid urbanization and industrialization in countries such as China, India, and Japan are leading to increased demand for LV cables in both infrastructure and industrial applications. Investments in renewable energy projects are on the rise in the region, supported by governmental policies aiming to reduce carbon emissions and dependence on non-renewable energy sources. Additionally, the modernization of aging infrastructure in many countries within the region necessitates the adoption of advanced LV cables to ensure safety and efficiency. The region's focus on technological innovation and adoption of smart grid technologies further fuels the demand for LV cables. There is also a growing trend towards the electrification of transportation, particularly in emerging economies, contributing to the growth of the automotive segment of the LV cable market.
Key Regional Takeaways:
United States Low Voltage Cable Market Analysis
Low-voltage cable in the US is growing with full vigour, led by increasing demand from the booming construction and infrastructure sectors. Total value for construction spending was estimated by the U.S. Census Bureau to be approximately USD 2,071.1 Billion for the year 2023; with significant portions of these comprised in electrical installations. Residential, commercial, and industrial buildings increasingly utilize low-voltage cables in building intelligent houses with Internet-of-Things technologies and energy-saving solutions. The federal government's infrastructure investment plan, specifically the American Jobs Plan, added more momentum to modernize and expand the electrical grid in the country, increasing the demand for low voltage cables. Major players such as Southwire and General Cable are on the front lines with their sustainable and energy-efficient offerings. The government is also promoting the use of renewable energy and green technologies, thus creating a higher market growth potential. With construction activity increasing, there is a need for more innovative electrical solutions, thus positioning the U.S. as a key player in the global low voltage cable market.
Europe Low Voltage Cable Market Analysis
The low voltage cable market in Europe is also growing steadily. This can be attributed to a number of factors such as the increasing trend of urbanization, increasing construction activities, and stringent energy efficiency standards. According to Eurostat, the construction output in the EU in 2023 was about EUR 1.3 Trillion (USD 1.4 Trillion), where most of this amount went into electrical installations, majorly low voltage cables. Increasing usage of renewable energy sources and the imposition of strict energy policies, such as the EU Green Deal, is giving way to the demand for sustainable high-performance cables. Such giant companies as Nexans and Prysmian Group focus on technological development; the cable materials are new, innovative, and are made according to the environmental requirements of the region. Urban infrastructure projects and smart city initiatives are also contributing to the demand for low voltage cables, as such projects require modern electrical wiring systems. Low voltage cables are becoming increasingly important in Europe's construction and industrial sectors as the region continues to strive for energy efficiency and carbon emission reduction.
Asia Pacific Low Voltage Cable Market Analysis
Low-voltage cables market in Asia-Pacific, as indicated, in this region, massive investment and urbanization augment the development of infrastructures, causing it to boom with growth rates. Major projects undertaken are the Bataan–Cavite Interlink Bridge in Philippines with an estimate of USD 3.91 Billion, that shows a region taking seriously big projects, and their efforts for major infrastructure. Growth rates add to an increased demand in the electrical infrastructures like low voltage cables. China invested heavily in building residential, commercial, and industrial constructions. The smart city and industrial automation drives are further adding to the demand for the high-quality low voltage cables. It seems that in countries like India and Japan as well, the trend continues to build up in favour of regional low voltage cable growth. It is interestingly being filled by cost-efficient solutions led by major key players such as LS Cable & System and Furukawa Electric in the region.
Latin America Low Voltage Cable Market Analysis
Latin America, especially Brazil, has an upward trend in the low voltage cable market, which is augmented by large-scale infrastructure projects supported by government initiatives as well as international development organizations like the Inter-American Development Bank (IDB). IDB has played a very significant role in financing some of the major projects that aid in the development of infrastructure in Brazil. For instance, the IDB granted a syndicated loan of USD 430 Million for the first phase of a new terminal at Santos Port, which will increase the capacity of the port to accommodate deeper draft container ships and optimize logistics. The IDB also approved USD 300 Million for the Productive Development Program for the Northeast Region, PRODEPRO, addressing infrastructure bottlenecks and financing long-term projects. Other key investments are the Interurban Train North Axis, a public-private partnership connecting São Paulo to Campinas. All this will generate huge demand for low voltage cables in electrical wiring related to transportation, communication, and energy systems. With the support of the IDB and other stakeholders, the country is going to modernize its infrastructure. In the context of low voltage cables, this development will likely be in harmony with Brazil's overall expansion, and this will render it one of the largest growth drivers within the Latin American region.
Middle East and Africa Low Voltage Cable Market Analysis
The low voltage cable market of the Middle East and Africa is expected to grow phenomenally with massive investments across the region in infrastructure, residential, commercial, as well as industrial projects. The Middle East is also witnessing investments in the key sectors wherein Saudi Arabia plans to render investments over USD 175 Billion per annum in the industrial and mega projects between the years 2025 and 2028, as per an industrial report. Projects such as Neom and the Red Sea resorts are likely to change the construction landscape in the region. These advancements will generate increased requirements for construction materials, low voltage cables, to support power infrastructure, buildings, and communication systems. Technologies and smart city initiatives also bring more requirements for modern electrical solutions in sustainable building practices. As urbanization continues and infrastructure modernization efforts gain pace, the low voltage cable market in the Middle East and Africa is bound to grow, contributing heavily to the region's economic growth through 2025 and beyond.
Competitive Landscape:
The top market players are heavily investing in research and development (R&D) activities to create innovative and more efficient LV cable products. They are developing cables with enhanced insulation, better conductivity, and increased reliability, adapting to the ever-changing needs of various industrial, infrastructure, and renewable energy sectors. By tailoring products to the specific needs and regulations of different regions, the major companies are capturing new customer bases and fostering growth. With an increasing global focus on sustainability and environmental responsibility, leading LV cable manufacturers are developing recyclable and environmentally-friendly materials for their products. The major players are also investing in new manufacturing facilities and modernizing existing ones helps top players increase production capacities.
The report provides a comprehensive analysis of the competitive landscape in the low voltage cable market with detailed profiles of all major companies, including:
- Prysmian Group
- Nexans S.A
- General Cable
- ABB Group
- Sumitomo Electric Industries
- NK Communications
- Encore Wire Corporation
- Finolex Cables
- TE Connectivity
- Caledonian Cables
- Polycab Wires
- Leoni AG
- Southwire Company LLC
- Wanda Group
- Hangzhou Cable
Latest News and Developments:
- November 2024: Nexans SA announced that it has agreed to sell its US-based AmerCable unit, specializing in low and medium voltage cables, to Mattr Corp for USD 280 Million. The deal is likely to be closed by the end of 2024 and will bolster Mattr's position in the US wire and cable market, especially in the key sectors of renewable energy infrastructure.
- April 2024: Prysmian announced that it will acquire Encore Wire USD 290.00 per share in cash, which represents a 20% premium over the 30-day average share price. The deal is valued at Euro 3.9 Billion (USD 4.09 Billion), and this deal strengthens the North American presence of Prysmian and increases product offerings while offering potential future opportunities for employees.
- June 2023: Nexans S.A launched a new high-voltage cable range for electrical and hybrid aircraft, and E-VTOL (Electrical Vertical Take-Off and Landing Vehicules) that fit assist in reducing the overall carbon footprint.
- May 2023: ABB completed its acquisition of the Siemens low voltage NEMA motor business. This acquisition aligns with the Motion business area's strategy for profitable growth. The horizontal and vertical induction severe duty and general-purpose motor lines will be rebranded as ABB and re-launched in the market by the second quarter of 2023.
- February 2023: Prysmian Group introduced Prysmian Prysolar, an advanced cable solution designed for solar power generation. It meets global standards EN 50618 and IEC 62930 and offers enhanced long-term water resistance, supporting up to 1800 V DC.
Low Voltage Cable Market Report Scope:
| Report Features | Details |
|---|---|
| Base Year of the Analysis | 2025 |
| Historical Period | 2020-2025 |
| Forecast Period | 2026-2034 |
| Units | Billion USD |
| Scope of the Report | Exploration of Historical Trends and Market Outlook, Industry Catalysts and Challenges, Segment-Wise Historical and Future Market Assessment:
|
| Installation Types Covered | Overhead, Underground |
| Materials Covered | Copper, Aluminum |
| Overhead Products Covered | Conductors, Fittings and Fixtures, Others |
| Underground Products Covered | PVC Cables, XLPE Cables, Cable Terminations, Cable Joints, Others |
| End-Users Covered |
|
| Regions Covered | Asia Pacific, Europe, North America, Latin America, Middle East and Africa |
| Companies Covered | Prysmian Group, Nexans S.A, General Cable, ABB Group, Sumitomo Electric Industries, NK Communications, Encore Wire Corporation, Finolex Cables, TE Connectivity, Caledonian Cables, Polycab Wires, Leoni AG, Southwire Company, LLC, Wanda Group, Hangzhou Cable etc. |
| Customization Scope | 10% Free Customization |
| Post-Sale Analyst Support | 10-12 Weeks |
| Delivery Format | PDF and Excel through Email (We can also provide the editable version of the report in PPT/Word format on special request) |
Key Benefits for Stakeholders:
- IMARC’s report offers a comprehensive quantitative analysis of various market segments, historical and current market trends, market forecasts, and dynamics of the low voltage cable market from 2020-2034.
- The research study provides the latest information on the market drivers, challenges, and opportunities in the global low voltage cable market.
- The study maps the leading, as well as the fastest-growing, regional markets.
- Porter's five forces analysis assist stakeholders in assessing the impact of new entrants, competitive rivalry, supplier power, buyer power, and the threat of substitution. It helps stakeholders to analyze the level of competition within the low voltage cable industry and its attractiveness.
- Competitive landscape allows stakeholders to understand their competitive environment and provides an insight into the current positions of key players in the market.
Frequently Asked Questions About the Low Voltage Cable Market Size Report
Low voltage cables refer to electrical cables designed to transmit power at voltages up to 1,000V. They are commonly used in residential, commercial, and industrial applications, including lighting, power distribution, and control systems. These cables ensure safe, efficient energy transmission and are vital for various low voltage electrical systems.
The low voltage cable market was valued at USD 129.7 Billion in 2025.
IMARC estimates the global low voltage cable market to exhibit a CAGR of 5.02% during 2026-2034.
The growing electricity demand across residential, commercial, and industrial sectors, renewable energy adoption, rising advancements in smart grids, electric vehicle infrastructure expansion, and urbanization are upcoming trends boosting the low voltage market. Increasing imposition of government initiatives for energy efficiency, infrastructure modernization, and sustainable development will further bolster market growth.
In 2025, overhead represented the largest segment by installation type, driven by its cost-effectiveness, ease of installation, and adaptability across diverse terrains.
Aluminum leads the market by material attributed to its lightweight nature, cost-efficiency, and suitability for renewable energy and long-distance transmission projects.
The conductors are the leading segment by overhead product, driven by their critical role in energy transmission, enhanced efficiency, and material innovations for greater performance.
In 2025, XLPE cables represented the largest segment by underground product, propelled by their high-temperature resistance, durability, and superior electrical properties for high-stress environments.
Industrial leads the market by end-user attributed to rising automation, renewable energy installations, and energy-efficient practices across manufacturing and utility sectors.
On a regional level, the market has been classified into North America, Asia Pacific, Europe, Latin America, and Middle East and Africa, wherein Asia Pacific currently dominates the global market.
Some of the major players in the global low voltage cable market include Prysmian Group, Nexans S.A, General Cable, ABB Group, Sumitomo Electric Industries, NK Communications, Encore Wire Corporation, Finolex Cables, TE Connectivity, Caledonian Cables, Polycab Wires, Leoni AG, Southwire Company, LLC, Wanda Group, Hangzhou Cable, etc.
Need more help?
- Speak to our experienced analysts for insights on the current market scenarios.
- Include additional segments and countries to customize the report as per your requirement.
- Gain an unparalleled competitive advantage in your domain by understanding how to utilize the report and positively impacting your operations and revenue.
- For further assistance, please connect with our analysts.
 Request Customization
 Speak to an Analyst
 Request Brochure
 Inquire Before Buying
Benefits of Customization
- Personalize this research
- Triangulate with your data
- Get data as per your format and definition
- Gain a deeper dive into a specific application, geography, customer, or competitor
- Any level of personalization
Get in Touch With Us
UNITED STATES
Phone: +1-201-971-6302
INDIA
Phone: +91-120-433-0800
UNITED KINGDOM
Phone: +44-753-714-6104
Email: [email protected]
Client Testimonials


.webp)


