
Machine Translation Market Report by Technology Type (Statistical Machine Translation (SMT), Rule-Based Machine Translation (RBMT), Neural Machine Translation, and Others), Deployment Type (On-Premises, Cloud-Based), Application (BFSI, Automotive, Electronics, Healthcare, IT and Telecommunications, Military and Defense, and Others), and Region 2026-2034
Market Overview:
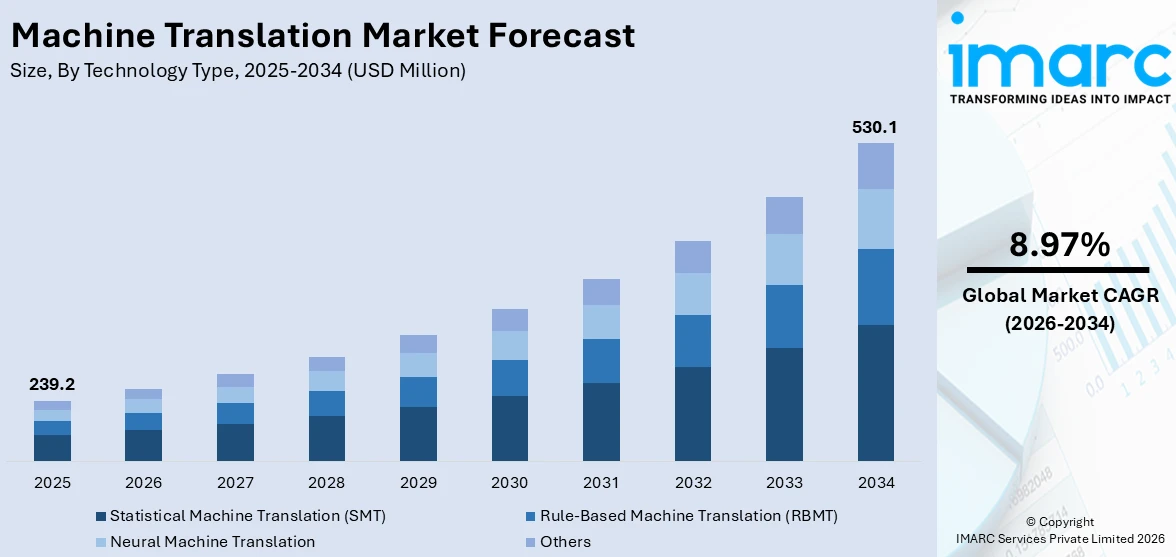
The global machine translation market size reached USD 239.2 Million in 2025. Looking forward, IMARC Group expects the market to reach USD 530.1 Million by 2034, exhibiting a growth rate (CAGR) of 8.97% during 2026-2034.
|
Report Attribute
|
Key Statistics
|
|---|---|
|
Base Year
|
2025
|
|
Forecast Years
|
2026-2034
|
|
Historical Years
|
2020-2025
|
|
Market Size in 2025
|
USD 239.2 Million |
|
Market Forecast in 2034
|
USD 530.1 Million |
| Market Growth Rate 2026-2034 | 8.97% |
Machine translation (MT) refers to a sub-field of computational linguistics that translates source content into target languages. It is a fully automated software, which allows customization and enhances the overall output by limiting the scope of permissible substitutions. It is useful in domains wherein formal or formulaic language is employed. MT can work without human intervention to translate considerable amounts of information that cannot be translated conventionally. At present, the growth of adaptive machine translation, along with the reinvention of computer-aided translational tools, is offering lucrative opportunities to leading players in the industry.
To get more information on this market Request Sample
The rising popularity of cloud-based applications represents one of the key factors strengthening the growth of the market. Cloud technology provides access to different services via cloud servers, thereby eliminating the need to invest in in-house hardware development or installations. Moreover, the increasing requirement of organizations to localize their content in different languages and capture international markets is positively influencing the sales of MT solutions across the globe. Furthermore, key players are focusing on the development of advanced MT solutions to expand their product portfolio. For instance, Lilt Inc., an Artificial Intelligence (AI) powered language service provider, recently launched an adaptive neural machine translation system to utilize a real-time feedback loop and enhance the productivity of a human translator. Besides this, machine translation services are being developed to disseminate healthcare information regarding the ongoing coronavirus disease (COVID-19) pandemic in various regional languages.
Key Market Segmentation:
IMARC Group provides an analysis of the key trends in each sub-segment of the global machine translation market report, along with forecasts at the global, regional and country level from 2026-2034. Our report has categorized the market based on technology type, deployment type and application.
Breakup by Technology Type:
- Statistical Machine Translation (SMT)
- Rule-Based Machine Translation (RBMT)
- Neural Machine Translation
- Others
Breakup by Deployment Type:
- On-Premises
- Cloud-Based
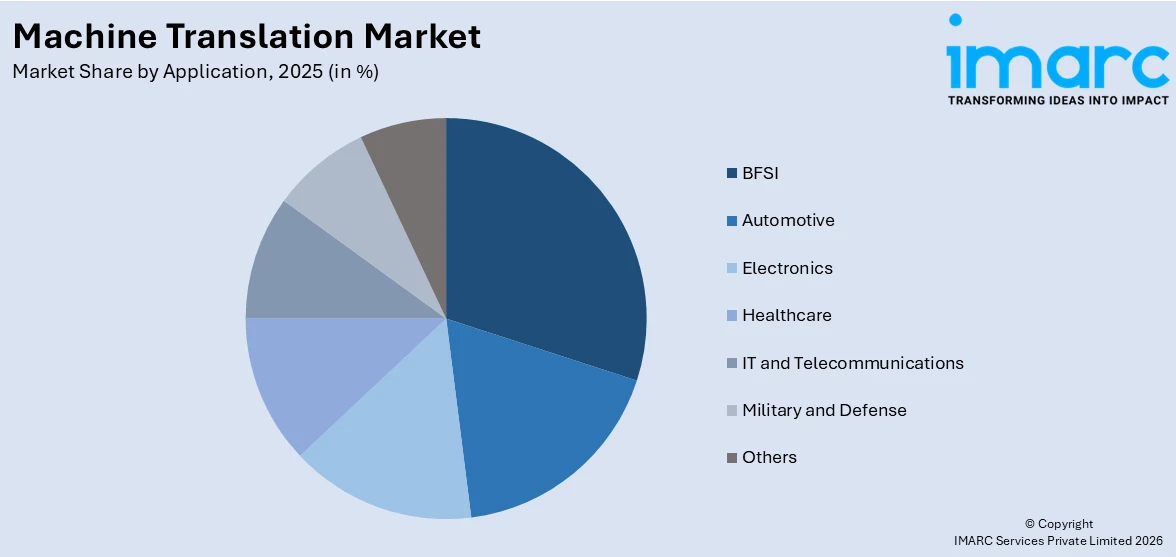
Breakup by Application:
Access the comprehensive market breakdown Request Sample
- BFSI
- Automotive
- Electronics
- Healthcare
- IT and Telecommunications
- Military and Defense
- Others
Breakup by Region:
- North America
- United States
- Canada
- Asia-Pacific
- China
- Japan
- India
- South Korea
- Australia
- Indonesia
- Others
- Europe
- Germany
- France
- United Kingdom
- Italy
- Spain
- Russia
- Others
- Latin America
- Brazil
- Mexico
- Others
- Middle East and Africa
Competitive Landscape:
The competitive landscape of the industry has also been examined along with the profiles of the key players being Applications Technology Inc., Asia Online Pte Ltd., Cloudwords Inc., International Business Machines Corporation, Lionbridge Technologies Inc., Pangeanic, Raytheon Technologies Corporation, SDL Plc (RWS Holdings Plc), Smart Communications Inc. (PLDT Inc.), Systran and Welocalize Inc.
Report Coverage:
| Report Features | Details |
|---|---|
| Base Year of the Analysis | 2025 |
| Historical Period | 2020-2025 |
| Forecast Period | 2026-2034 |
| Units | Million USD |
| Segment Coverage | Technology Type, Deployment Type, Application, Region |
| Region Covered | Asia Pacific, Europe, North America, Latin America, Middle East and Africa |
| Countries Covered | United States, Canada, Germany, France, United Kingdom, Italy, Spain, Russia, China, Japan, India, Australia, Indonesia, South Korea, Brazil, Mexico |
| Companies Covered | Applications Technology Inc., Asia Online Pte Ltd., Cloudwords Inc., International Business Machines Corporation, Lionbridge Technologies Inc., Pangeanic, Raytheon Technologies Corporation, SDL Plc (RWS Holdings Plc), Smart Communications Inc. (PLDT Inc.), Systran and Welocalize Inc. |
| Customization Scope | 10% Free Customization |
| Post-Sale Analyst Support | 10-12 Weeks |
| Delivery Format | PDF and Excel through Email (We can also provide the editable version of the report in PPT/Word format on special request) |
Frequently Asked Questions About the Machine Translation Market Report
The global machine translation market was valued at USD 239.2 Million in 2025.
We expect the global machine translation market to exhibit a CAGR of 8.97% during 2026-2034.
The rising popularity of cloud-based applications, such as machine translation, by numerous organizations to localize their content in different languages and capture international markets is primarily driving the global machine translation market.
The sudden outbreak of the COVID-19 pandemic has led to the increasing adoption of machine translation for providing awareness among individuals regarding the coronavirus infection in multiple regional languages, during the lockdown scenario.
Based on the technology type, the global machine translation market can be categorized into Statistical Machine Translation (SMT), Rule-Based Machine Translation (RBMT), neural machine translation, and others. Currently, Statistical Machine Translation (SMT) accounts for the majority of the global market share.
Based on the deployment type, the global machine translation market has been segregated into on-premises and cloud-based, where cloud-based currently exhibits a clear dominance in the market.
Based on the application, the global machine translation market can be bifurcated into BFSI, automotive, electronics, healthcare, IT and telecommunications, military and defense, and others. Currently, the IT and telecommunication sector holds the largest market share.
On a regional level, the market has been classified into North America, Asia-Pacific, Europe, Latin America, and Middle East and Africa, where North America currently dominates the global market.
Some of the major players in the global machine translation market include Applications Technology Inc., Asia Online Pte Ltd., Cloudwords Inc., International Business Machines Corporation, Lionbridge Technologies Inc., Pangeanic, Raytheon Technologies Corporation, SDL Plc (RWS Holdings Plc), Smart Communications Inc. (PLDT Inc.), Systran, and Welocalize Inc.
Need more help?
- Speak to our experienced analysts for insights on the current market scenarios.
- Include additional segments and countries to customize the report as per your requirement.
- Gain an unparalleled competitive advantage in your domain by understanding how to utilize the report and positively impacting your operations and revenue.
- For further assistance, please connect with our analysts.
 Request Customization
 Speak to an Analyst
 Request Brochure
 Inquire Before Buying
Benefits of Customization
- Personalize this research
- Triangulate with your data
- Get data as per your format and definition
- Gain a deeper dive into a specific application, geography, customer, or competitor
- Any level of personalization
Get in Touch With Us
UNITED STATES
Phone: +1-201-971-6302
INDIA
Phone: +91-120-433-0800
UNITED KINGDOM
Phone: +44-753-714-6104
Email: [email protected]
Client Testimonials


.webp)


