
Metakaolin Prices, Trend, Chart, Demand, Market Analysis, News, Historical and Forecast Data Report 2026 Edition
Metakaolin Price Trend, Index and Forecast
Track the latest insights on metakaolin price trend and forecast with detailed analysis of regional fluctuations and market dynamics across North America, Latin America, Central Europe, Western Europe, Eastern Europe, Middle East, North Africa, West Africa, Central and Southern Africa, Central Asia, Southeast Asia, South Asia, East Asia, and Oceania.
Metakaolin Prices Outlook Q2 2026
- USA: USD 172/MT
- China: USD 57/MT
- Germany: USD 135/MT
- Spain: USD 134/MT
- Canada: USD 162/MT
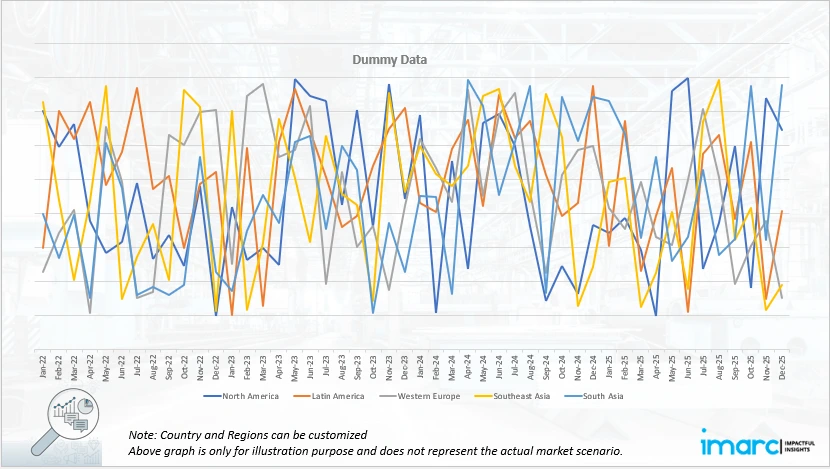
Metakaolin Price Chart
Get real-time access to monthly/quarterly/yearly prices Request Sample
During the second quarter of 2026, the metakaolin prices in the USA reached 172 USD/MT in June. The market recorded an increase due to steady demand from construction and infrastructure activities. Higher utilization of cement replacement materials supported metakaolin consumption as builders focused on improving concrete performance and reducing environmental impact. Supply conditions remained balanced, but producers faced pressure from energy expenses and transportation costs, which influenced pricing decisions.
During the second quarter of 2026, the metakaolin prices in China reached 57 USD/MT in June. Prices increased as domestic demand improved from cement, concrete, and construction material applications. Market participants observed stronger consumption from infrastructure related activities and specialty construction projects, supporting supplier pricing. Production conditions remained competitive due to the presence of established kaolin processing facilities and strong domestic supply networks.
During the second quarter of 2026, the metakaolin prices in Germany reached 135 USD/MT in June. Prices moved upward due to firm demand from advanced construction applications and sustainable building material initiatives. Growing interest in supplementary cementitious materials supported metakaolin adoption as industries focused on improving concrete durability and reducing carbon emissions. Higher operational costs associated with processing, energy consumption, and logistics contributed to upward price adjustments.
During the second quarter of 2026, the metakaolin prices in Spain reached 134 USD/MT in June. The market experienced price growth due to increasing demand from the construction and cement industries. Adoption of metakaolin as a performance enhancing additive supported consumption among concrete manufacturers seeking improved strength and durability characteristics. Production expenses related to energy, processing, and transportation influenced supplier pricing strategies.
During the second quarter of 2026, the metakaolin prices in Canada reached 162 USD/MT in June. Prices increased due to consistent demand from infrastructure projects and concrete manufacturing applications. Market activity was supported by the adoption of sustainable construction materials and growing interest in alternatives that improve concrete performance. Supply conditions remained stable, but transportation expenses and processing costs influenced price movements.
Metakaolin Prices Outlook Q3 2025
- USA: USD 171/MT
- China: USD 54/MT
- Germany: USD 125/MT
- Spain: USD 124/MT
- Canada: USD 156/MT
During the third quarter of 2025, the metakaolin prices in the USA reached 171 USD/MT in September. The slight upward movement was primarily driven by increasing demand from the construction and cement sectors, especially in the production of high-performance concrete and sustainable building materials. Raw material costs remained stable, though energy expenses and transportation surcharges slightly elevated overall pricing. Additionally, ongoing infrastructure projects supported by federal investments sustained steady consumption levels.
During the third quarter of 2025, the metakaolin prices in China reached 54 USD/MT in September. Prices declined mainly due to a slowdown in domestic construction activities and weaker demand for blended cements. Manufacturers faced reduced profit margins amid rising energy and environmental compliance costs. The oversupply of locally produced kaolin-based products further pressured pricing. Export demand also weakened slightly due to competitive pricing in Southeast Asian markets.
During the third quarter of 2025, the metakaolin prices in Germany reached 125 USD/MT in September. The notable price increase reflected robust demand from the green construction sector, driven by growing adoption of supplementary cementitious materials. Higher energy and production costs contributed to the price escalation, particularly as natural gas prices remained elevated across Europe. Logistics costs and port handling charges further added to the overall market value.
During the third quarter of 2025, the metakaolin prices in Spain reached 124 USD/MT in September. Prices registered a decline due to moderate demand and excess market inventories. Seasonal slowdowns in construction activities during the summer months contributed to weaker procurement. Although energy costs remained elevated, their impact on overall pricing was mitigated by steady domestic production and adequate supply availability.
During the third quarter of 2025, the metakaolin prices in Canada reached 156 USD/MT in September. The market observed a slight decline as industrial and construction activities slowed marginally during the summer period. Demand contraction, particularly in infrastructure-related projects, softened procurement volumes. Supply-side conditions remained stable with consistent output from domestic processors.
Metakaolin Prices Outlook Q2 2025
- USA: USD 167/MT
- China: USD 56/MT
- Germany: USD 118/MT
- Spain: USD 128/MT
- Canada: USD 161/MT
During the second quarter of 2025, the metakaolin prices in the USA reached 167 USD/MT in June. Prices edged higher, supported by improving construction demand and stable raw material costs. Increased consumption from the cement and coatings sectors influenced upward pricing momentum. The rise in energy and labor costs slightly contributed to the market strengthening. Import activities remained stable despite moderate logistical challenges at key ports.
During the second quarter of 2025, the metakaolin prices in China reached 56 USD/MT in June. Price growth was recorded due to steady demand recovery in the construction and ceramic sectors. Manufacturers benefited from a consistent supply of kaolin feedstock and favorable energy costs during the earlier part of the quarter. Government-backed construction programs further improved domestic consumption.
During the second quarter of 2025, the metakaolin prices in Germany reached 118 USD/MT in June. The market experienced moderate price gains, primarily due to stable construction sector performance and strong demand for low-carbon building materials. Energy cost pressures were evident, particularly within heavy industrial regions. Import dependence for certain raw materials also contributed to the upward trend. The manufacturing sector maintained steady output levels, supported by robust public infrastructure investments.
During the second quarter of 2025, the metakaolin prices in Spain reached 128 USD/MT in June. Prices rose slightly due to improved market activity in the construction and materials sectors. Stable raw material supply and higher production costs, particularly energy and labor, contributed to incremental price strengthening. Increased demand from eco-friendly construction projects also influenced the market.
During the second quarter of 2025, the metakaolin prices in Canada reached 161 USD/MT in June. The price increase was largely attributed to strong demand from the construction and infrastructure sectors. Stable availability of kaolin feedstock supported continuous production. Rising fuel prices and labor shortages, however, added marginal cost pressures. Imports from the US remained consistent, maintaining a steady supply balance.
Metakaolin Prices Outlook Q1 2025
- USA: USD 165/MT
- China: USD 55/MT
- Germany: USD 115/MT
- Spain: USD 125/MT
- Canada: USD 155/MT
During the first quarter of 2025, the metakaolin prices in the USA reached 165 USD/MT in March. In the United States, metakaolin prices in Q1 2025 were influenced by steady construction sector activity and a gradual shift toward low-carbon cement alternatives. Energy-intensive calcination processes faced cost pressures due to elevated natural gas and electricity prices. Logistical inefficiencies, particularly in cross-country freight movement, added to transportation costs. Additionally, import competition from South American and European suppliers affected local price stability.
During the first quarter of 2025, metakaolin prices in China reached 55 USD/MT in March. Metakaolin prices in China during Q1 2025 were shaped by consistent domestic production and varied regional demand from the construction and ceramic sectors. Raw kaolin availability remained sufficient, but environmental regulations tightened kiln operations in key provinces, affecting supply chains. Export volumes fluctuated due to global construction sector uncertainty, while inland freight charges and labor cost adjustments contributed to overall pricing dynamics.
During the first quarter of 2025, the metakaolin prices in Germany reached 115 USD/MT in March. In Germany, Q1 2025 metakaolin pricing was driven by sustained demand from the green construction and infrastructure rehabilitation sectors. Energy costs remained high amid reliance on imported fuels, affecting the economics of kiln operations. Regulatory policies promoting supplementary cementitious materials increased consumption. However, slower construction growth in neighboring EU markets and challenges in rail freight efficiency impacted producer margins and pricing structures.
During the first quarter of 2025, the metakaolin prices in Spain reached 125 USD/MT in March. Spain’s metakaolin market in Q1 2025 experienced pricing pressure from a combination of rising energy input costs and inconsistent demand from the building materials and tile manufacturing sectors. Feedstock procurement faced regional disparities due to varying quality and accessibility of raw kaolin. Limited export demand within southern Europe and competitive pricing from North African producers also influenced market dynamics.
During the first quarter of 2025, the metakaolin prices in Canada reached 155 USD/MT in March. In Canada, metakaolin prices in Q1 2025 were impacted by seasonal construction slowdowns and logistical hurdles related to winter transport constraints. Energy tariffs in industrial zones raised processing costs for calcination units. Demand from the cement and mortar additives sector remained modest, while imports from the United States and Europe introduced additional pricing variability. Transportation bottlenecks in interprovincial movement further added to cost pressures.
Regional Coverage
The report provides a detailed analysis of the market across different regions, each with unique pricing dynamics influenced by localized market conditions, supply chain intricacies, and geopolitical factors. This includes price trends, price forecast and supply and demand trends for each region, along with spot prices by major ports. The report also provides coverage of FOB and CIF prices, as well as the key factors influencing metakaolin prices.
Europe Metakaolin Price Trend
Q2 2026:
Europe’s metakaolin price index showed an upward movement, supported by increasing demand from sustainable construction activities and concrete enhancement applications. Countries including Germany and Spain experienced price growth as manufacturers and contractors increased the use of supplementary cementitious materials. Higher energy expenses, processing costs, and logistics charges influenced producer pricing strategies across the region. Environmental regulations encouraging lower carbon construction practices supported wider adoption of metakaolin in cement formulations. Supply availability remained stable due to established processing facilities and regional distribution networks. Market participants continued to focus on consistent quality grades, which supported firm pricing conditions throughout the quarter.
Q3 2025:
The metakaolin price index in Europe indicated mixed performance in Q3 2025. While Germany observed price increases supported by robust construction activities, countries such as Spain experienced marginal declines due to subdued seasonal demand. Energy costs across Europe remained a key determinant influencing price fluctuations. Supply chains operated steadily, though rising compliance costs and logistics expenses affected overall cost structures. Strong demand for sustainable building materials under the EU’s decarbonization framework reinforced the market’s long-term resilience.
Q2 2025:
The metakaolin price index in Europe showed steady growth during Q2 2025. Strong demand for supplementary cementitious materials in Germany and the United Kingdom supported upward movement. Energy and transportation costs remained elevated, influencing producer margins. Spain experienced moderate price improvements amid consistent domestic consumption. Broader EU decarbonization efforts encouraged the substitution of clinker with metakaolin in construction materials, strengthening long-term demand.
Q1 2025:
As per the metakaolin price index, the European metakaolin market faced persistent oversupply, driven by excess inventory from late 2024 and weak demand from the cement and construction sectors. Reduced production rates, minimal outages, and limited new orders from builders kept consumption low. Closed trade routes and logistical bottlenecks restricted market flexibility, while shorter lead times added pricing pressure. Rising electricity costs offered limited support, but falling energy prices in March slightly eased production costs. Nonetheless, the market remained oversupplied throughout the quarter, with continued declines in cement production and dispatches reinforcing subdued metakaolin demand and bearish sentiment.
This analysis can be extended to include detailed metakaolin price information for a comprehensive list of countries.
| Region | Countries Covered |
|---|---|
| Europe | Germany, France, United Kingdom, Italy, Spain, Russia, Turkey, Netherlands, Poland, Sweden, Belgium, Austria, Ireland, Switzerland, Norway, Denmark, Romania, Finland, Czech Republic, Portugal, and Greece, among other European countries. |
North America Metakaolin Price Trend
Q2 2026:
North America’s metakaolin price index recorded steady growth, driven by construction sector demand and infrastructure related activities. The USA and Canada markets benefited from increased interest in durable concrete solutions and sustainable building materials. Producers adjusted pricing due to changes in processing expenses, transportation costs, and raw material availability. Demand from commercial construction and infrastructure projects supported consumption levels during the quarter. Stable supply conditions prevented major disruptions, but operating cost pressures contributed to gradual price increases. The market continued to see preference for high performance construction additives, supporting a positive pricing trend across North America.
Q3 2025:
The metakaolin price index in North America recorded moderate variations in Q3 2025. The USA experienced a minor uptick due to infrastructure-driven demand, while Canada saw a marginal decline amid reduced construction activity. Supply remained steady, with manufacturers maintaining consistent production outputs. Freight and energy costs played a central role in shaping pricing trends across the region. Currency stability between the USD and CAD minimized import cost fluctuations.
Q2 2025:
The metakaolin price index in North America displayed steady gains across Q2 2025. The USA recorded incremental price growth driven by large-scale infrastructure projects, while Canada maintained moderate increases under consistent domestic demand. Energy costs and freight surcharges impacted overall pricing structures. Raw material supply remained adequate across both countries. Favorable macroeconomic conditions, coupled with steady industrial expansion, ensured a balanced yet upward-trending metakaolin market in North America during Q2 2025.
Q1 2025:
As per the metakaolin price index, in Q1 2025, the North American metakaolin market declined due to abundant supply and weak construction sector demand. Stable US supply was supported by efficient inventory management and favorable freight conditions, despite reduced Chinese shipments during the Spring Festival. Demand was limited by seasonal slowdowns, adverse weather, and high borrowing costs. Federal infrastructure spending and stockpiling ahead of expected tariffs briefly supported activity. In February and March, supply remained consistent with rising global output and lower logistics costs, but demand was constrained by slow permitting, private-sector caution, and residential construction weakness, keeping price sentiment subdued throughout the quarter.
Specific metakaolin historical data within the United States and Canada can also be provided.
| Region | Countries Covered |
|---|---|
| North America | United States and Canada |
Middle East and Africa Metakaolin Price Trend
Q2 2026:
According to the metakaolin price chart, prices in the Middle East and Africa changed due to a complex interplay of factors, mostly caused by supply chain disruptions, seasonal demand swings, and geopolitical impacts.
Q3 2025:
As per the metakaolin price chart, the prices in the Middle East and Africa fluctuated due to a complex interplay of factors, primarily driven by supply chain disruptions, seasonal demand shifts, and geopolitical influences.
Q2 2025:
The report explores the metakaolin trends and metakaolin price chart in the Middle East and Africa, considering factors like regional industrial growth, the availability of natural resources, and geopolitical tensions that uniquely influence market prices.
Q1 2025:
As per the metakaolin price chart, the prices in the Middle East and Africa fluctuated due to a complex interplay of factors, primarily driven by supply chain disruptions, seasonal demand shifts, and geopolitical influences. A tight supply from refineries, exacerbated by maintenance rounds and unplanned outages, put pressure on prices. Simultaneously, demand from the agrochemical sector during the planting season contributed to price changes.
In addition to region-wise data, information on metakaolin prices for countries can also be provided.
| Region | Countries Covered |
|---|---|
| Middle East & Africa | Saudi Arabia, UAE, Israel, Iran, South Africa, Nigeria, Oman, Kuwait, Qatar, Iraq, Egypt, Algeria, and Morocco, among other Middle Eastern and African countries. |
Asia Pacific Metakaolin Price Trend
Q2 2026:
Asia Pacific recorded a generally positive metakaolin price movement. China remained a major supply center with competitive pricing due to strong production capacity and domestic availability of kaolin resources. Demand from construction, cement, and infrastructure sectors supported market activity across the region. Other Asian markets experienced pricing influence from transportation costs, industrial demand, and raw material availability. Producers focused on maintaining quality standards while managing operational expenses. Growth in sustainable construction practices encouraged the use of metakaolin as a cement replacement material. Market competition remained strong due to the presence of multiple suppliers.
Q3 2025:
The Asia Pacific metakaolin market experienced mild price corrections during Q3 2025. China’s market weakened due to a slowdown in construction activities, while other regional economies such as India and Southeast Asian countries maintained stable demand. Supply chains remained resilient, supported by abundant kaolin resources and steady production rates. Shipping and logistics costs moderated, reducing overall expenses for exporters. Environmental compliance regulations in key markets continued to shape cost structures.
Q2 2025:
The Asia Pacific region experienced slight upward momentum in metakaolin prices during Q2 2025. China, India, and Southeast Asia recorded steady demand from construction and infrastructure projects. Supply chains remained robust with abundant kaolin availability. Energy price variations and currency movements affected export competitiveness in some regions. Environmental compliance and stricter emissions norms continued to raise production costs. Despite these pressures, strong demand fundamentals supported price resilience across the Asia Pacific market in Q2 2025.
Q1 2025:
In Q1 2025, the APAC metakaolin market saw firm pricing trends amid persistent supply constraints and cautious demand recovery. Limited kaolin clay availability, especially following mid-January rains in Northern China, restricted production. Despite weak construction sector demand due to historically low cement output in January, prices rose gradually as inventories tightened in February. March brought continued raw material shortages and modest recovery in cement production and shipments. However, ongoing declines in real estate investment and housing starts kept overall construction activity subdued, preventing substantial price surges despite supply-side pressures and slightly improved market sentiment.
This metakaolin price analysis can be expanded to include a comprehensive list of countries within the region.
| Region | Countries Covered |
|---|---|
| Asia Pacific | China, India, Indonesia, Pakistan, Bangladesh, Japan, Philippines, Vietnam, Thailand, South Korea, Malaysia, Nepal, Taiwan, Sri Lanka, Hongkong, Singapore, Australia, and New Zealand, among other Asian countries. |
Latin America Metakaolin Price Trend
Q2 2026:
Latin America's metakaolin market is primarily influenced by its abundant natural resources, particularly in Chile and Brazil. However, political instability and inconsistencies in regulatory frameworks can cause significant volatility in metakaolin pricing.
Q3 2025:
Latin America's metakaolin market is predominantly influenced by its rich natural reserves, particularly in countries like Chile and Brazil. However, political instability and inconsistent regulatory frameworks can lead to significant volatility in metakaolin prices.
Q2 2025:
Infrastructure challenges and logistical inefficiencies often impact the supply chain, affecting the region's ability to meet international demand consistently. Moreover, the metakaolin price index, economic fluctuations, and currency devaluation are critical factors that need to be considered when analyzing metakaolin pricing trends in this region.
Q1 2025:
The abundance of natural resources in Latin America, particularly in important nations like Chile and Brazil, greatly influences the continent's metakaolin industry. However, political unpredictability and differing regulatory regimes frequently cause swings in metakaolin prices, which lead to market instability.
This comprehensive review can be extended to include specific countries within the region.
| Region | Countries Covered |
|---|---|
| Latin America | Brazil, Mexico, Argentina, Columbia, Chile, Ecuador, and Peru, among other Latin American countries. |
Metakaolin Pricing Report, Market Analysis, and News
IMARC's latest publication, “Metakaolin Prices, Trend, Chart, Demand, Market Analysis, News, Historical and Forecast Data Report 2026 Edition,” presents a detailed examination of the metakaolin market, providing insights into both global and regional trends that are shaping prices. This report delves into the spot price of metakaolin at major ports and analyzes the composition of prices, including FOB and CIF terms. It also presents detailed metakaolin prices trend analysis by region, covering North America, Europe, Asia Pacific, Latin America, and Middle East and Africa. The factors affecting metakaolin pricing, such as the dynamics of supply and demand, geopolitical influences, and sector specific developments, are thoroughly explored. This comprehensive report helps stakeholders stay informed with the latest market news, regulatory updates, and technological progress, facilitating informed strategic decision-making and forecasting.
Metakaolin Industry Analysis
The global metakaolin market size reached USD 949.59 Million in 2025. By 2034, IMARC Group expects the market to reach USD 1,380.11 Million, at a projected CAGR of 4.24% during 2026-2034. The market is primarily driven by the rising demand for eco-friendly supplementary cementitious materials, expansion of infrastructure projects, adoption of low-carbon construction technologies, and steady industrial applications in coatings and refractories.
Latest News and Developments:
- October 2025: Zeotech entered into a non-binding memorandum of understanding (MoU) with Cement Australia to facilitate information exchange and joint testing of its AusPozz high-reactivity metakaolin. The partnership aimed to evaluate AusPozz’s technical performance and market potential while reviewing Cement Australia’s infrastructure and supply chain capabilities to support future commercial development.
Product Description
Metakaolin is a highly reactive aluminosilicate material produced by the controlled thermal treatment of kaolin clay. Its main chemical components include silicon dioxide and aluminum oxide, which provide strong pozzolanic activity when used in cement based systems. Metakaolin improves concrete strength, durability, chemical resistance, and overall performance by reacting with calcium hydroxide during hydration. It is commonly used in construction materials, high performance concrete, repair mortars, precast products, and specialty cement formulations. The product is valued for reducing permeability and improving resistance against environmental damage. Metakaolin is also used in architectural concrete, infrastructure projects, and sustainable building applications where lower carbon construction solutions are preferred. Its fine particle size and reactive properties make it an effective alternative to conventional cement additives.
Report Coverage
| Key Attributes | Details |
|---|---|
| Product Name | Metakaolin |
| Report Features | Exploration of Historical Trends and Market Outlook, Industry Demand, Industry Supply, Gap Analysis, Challenges, Metakaolin Price Analysis, and Segment-Wise Assessment. |
| Currency/Units | US$ (Data can also be provided in local currency) or Metric Tons |
| Region/Countries Covered | The current coverage includes analysis at the global and regional levels only. Based on your requirements, we can also customize the report and provide specific information for the following countries: Asia Pacific: China, India, Indonesia, Pakistan, Bangladesh, Japan, Philippines, Vietnam, Thailand, South Korea, Malaysia, Nepal, Taiwan, Sri Lanka, Hongkong, Singapore, Australia, and New Zealand Europe: Germany, France, United Kingdom, Italy, Spain, Russia, Turkey, Netherlands, Poland, Sweden, Belgium, Austria, Ireland, Switzerland, Norway, Denmark, Romania, Finland, Czech Republic, Portugal and Greece North America: United States and Canada Latin America: Brazil, Mexico, Argentina, Columbia, Chile, Ecuador, and Peru Middle East & Africa: Saudi Arabia, UAE, Israel, Iran, South Africa, Nigeria, Oman, Kuwait, Qatar, Iraq, Egypt, Algeria, and Morocco The list of countries presented is not exhaustive. Information on additional countries can be provided if required by the client. |
| Information Covered for Key Suppliers |
|
| Customization Scope | The report can be customized as per the requirements of the customer |
| Report Price and Purchase Option |
Plan A: Monthly Updates - Annual Subscription
Plan B: Quarterly Updates - Annual Subscription
Plan C: Biannually Updates - Annual Subscription
|
| Post-Sale Analyst Support | 360-degree analyst support after report delivery |
| Delivery Format | PDF and Excel through email (We can also provide the editable version of the report in PPT/Word format on special request) |
Key Benefits for Stakeholders:
- IMARC’s report presents a detailed analysis of metakaolin pricing, covering global and regional trends, spot prices at key ports, and a breakdown of FOB and CIF prices.
- The study examines factors affecting metakaolin price trend, including input costs, supply-demand shifts, and geopolitical impacts, offering insights for informed decision-making.
- The competitive landscape review equips stakeholders with crucial insights into the latest market news, regulatory changes, and technological advancements, ensuring a well-rounded, strategic overview for forecasting and planning.
- IMARC offers various subscription options, including monthly, quarterly, and biannual updates, allowing clients to stay informed with the latest market trends, ongoing developments, and comprehensive market insights. The metakaolin price charts ensure our clients remain at the forefront of the industry.
Need more help?
- Speak to our experienced analysts for insights on the current market scenarios.
- Include additional segments and countries to customize the report as per your requirement.
- Gain an unparalleled competitive advantage in your domain by understanding how to utilize the report and positively impacting your operations and revenue.
- For further assistance, please connect with our analysts.
 Request Customization
 Inquire Before Buying
 Speak to an Analyst
 Request Brochure
Benefits of Customization
- Personalize this research
- Triangulate with your data
- Get data as per your format and definition
- Gain a deeper dive into a specific application, geography, customer, or competitor
- Any level of personalization
Get in Touch With Us
UNITED STATES
Phone: +1-201-971-6302
INDIA
Phone: +91-120-433-0800
UNITED KINGDOM
Phone: +44-753-714-6104
Email: [email protected]
Client Testimonials




.webp)




.webp)













Related Reports

Why Choose Us
IMARC offers trustworthy, data-centric insights into commodity pricing and evolving market trends, enabling businesses to make well-informed decisions in areas such as procurement, strategic planning, and investments. With in-depth knowledge spanning more than 1000 commodities and a vast global presence in over 150 countries, we provide tailored, actionable intelligence designed to meet the specific needs of diverse industries and markets.
1000
+Commodities
150
+Countries Covered
3000
+Clients
20
+Industry

Robust Methodologies & Extensive Resources
IMARC delivers precise commodity pricing insights using proven methodologies and a wealth of data to support strategic decision-making.

Subscription-Based Databases
Our extensive databases provide detailed commodity pricing, import-export trade statistics, and shipment-level tracking for comprehensive market analysis.

Primary Research-Driven Insights
Through direct supplier surveys and expert interviews, we gather real-time market data to enhance pricing accuracy and trend forecasting.

Extensive Secondary Research
We analyze industry reports, trade publications, and market studies to offer tailored intelligence and actionable commodity market insights.
Trusted by 3000+ industry leaders worldwide to drive data-backed decisions. From global manufacturers to government agencies, our clients rely on us for accurate pricing, deep market intelligence, and forward-looking insights.