
Methanol Market Size, Share, Trends and Forecast by Application, and Region, 2025-2033
Methanol Market 2024, Size and Trends:
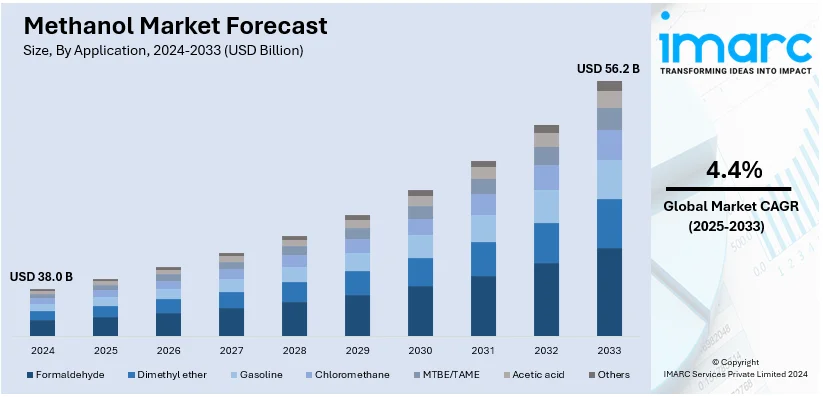
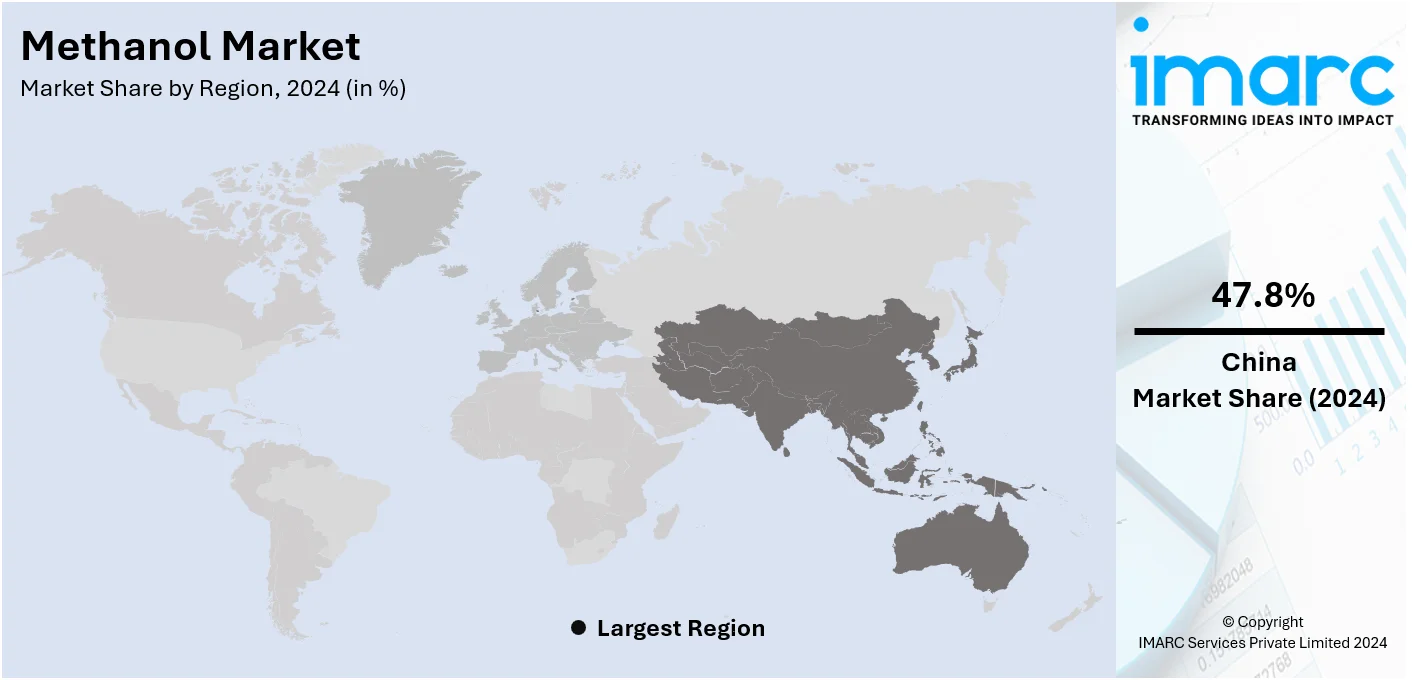
The global methanol market size was valued at USD 38.0 Billion in 2024. Looking forward, IMARC Group estimates the market to reach USD 56.2 Billion by 2033, exhibiting a CAGR of 4.4% during 2025-2033. China currently dominates the market, holding a significant market share in 2024. The rapidly expanding chemical industry, widespread product employment in manufacturing antibiotics and antifungals, significant growth in the automotive industry, and the implementation of various government initiatives are some of the major factors propelling the methanol market share.
|
Report Attribute
|
Key Statistics |
|---|---|
|
Base Year
|
2024 |
|
Forecast Years
|
2025-2033 |
|
Historical Years
|
2019-2024
|
|
Market Size in 2024
|
USD 38.0 Billion |
|
Market Forecast in 2033
|
USD 56.2 Billion |
| Market Growth Rate (2025-2033) |
4.4%
|
The methanol market growth is primarily driven by the rising demand for methanol as a feedstock in the production of formaldehyde, acetic acid, and other key chemicals that are being used across multiple industries. Moreover, the growing applications in fuel blending, which improves efficiency and helps to reduce emissions is further propelling the market. In addition, the rising integration of methanol-to-olefins (MTO) technology is giving impetus to the generation of plastics and other derivative products, further expanding the scope of the market. Furthermore, the growing application of methanol as an alternate marine fuel is mitigating issues related to environmental degradation and is driving the market further. In addition, accelerating investments in renewable methanol production based on captured CO₂ are aligning with global sustainability objectives, thereby bolstering methanol market demand. Apart from this, the shift in the attention of people towards cleaner fuels for internal combustion engines of the automobile industry is fostering methanol-based substitutes. Apart from this, integration of methanol in energy storage systems as a hydrogen carrier is gaining momentum and offering new market opportunities.
The United States stands out as a key regional market, driven by the increasing investments in natural gas-based methanol production, leveraging the country's abundant shale gas reserves. The expansion of petrochemical industries is driving demand for methanol as a critical feedstock. Additionally, government incentives and policies promoting low-carbon energy solutions are accelerating the adoption of methanol in clean energy initiatives. The rise in the construction and infrastructure sectors is contributing to the increased use of methanol-derived products, such as adhesives and resins. Furthermore, innovations in methanol production technologies, aimed at reducing costs and improving efficiency, are supporting the methanol market share. For instance, on January 10, 2024, Mitsui & Co. and Celanese Corporation's joint venture, Fairway Methanol LLC, started manufacturing methanol from captured CO₂ emissions, targeting the recycling of 180,000 metric tons of CO₂ annually. This fits within Mitsui's strategic emphasis on the Global Energy Transition and building a sustainable, circular fuel value chain. By using carbon capture and utilization technology, the project represents some of the innovative solutions for reducing fossil fuel dependency while ensuring environmental sustainability.
Methanol Market Trends:
The Widespread Product Adoption in the Chemical Industry
According to an industrial report, in 2023, methanol production worldwide was estimated to have surpassed 111 million metric tons, a slight increase from the previous year. Methanol is widely used in the chemical industry as a versatile raw material to produce various chemicals and chemical intermediates. It is widely used due to its versatility as a chemical feedstock, and its properties, such as its reactivity, solvency, and ease of handling, make it an essential component in various chemical processes. Moreover, methanol serves as a vital feedstock for producing acetic acid, a chemical used to manufacture acetic anhydride, vinyl acetate monomer (VAM), and various esters. In line with this, acetic acid and its derivatives are used to produce fibers, films, paints, solvents, and other industrial products.
Significant Growth in the Automotive Industry
According to an industrial report, worldwide car sales in 2023 showed a significant recovery after being steady in 2022, increasing by nearly 10% and exceeding 72 million units as supply chain issues lessened. Methanol is widely used as an alternative fuel for internal combustion engines in passenger vehicles as it can be blended with gasoline in certain proportions. It also reduces emissions and improves fuel efficiency, which in turn is acting as a growth-inducing factor. Additionally, methanol is used as a fuel in professional motorsports such as drag racing and oval track racing as it offers high octane ratings and excellent knock resistance, allowing for increased engine performance. Apart from this, the widespread product utilization as an alternative power source for electric vehicles (EVs), where methanol is converted into electricity through electrochemical reactions, is supporting the market growth.
Extensive research and development (R&D) activities
The methanol market is continuously changing due to the extensive R&D activities leading to various innovations. Moreover, the introduction of renewable methanol produced from non-fossil fuel feedstocks, such as biomass, industrial waste gases, or captured carbon dioxide (CO2), is propelling the market growth. For instance, according to an industrial report, global production of renewable methanol from biomass, industrial waste gases, and captured CO2 was less than 0.2 million metric tons in 2023. This is just a minute fraction of total methanol production, which stands at more than 98 million metric tons per annum. However, increasing concern for sustainability and decarbonization has been speeding up developments in the sector. As such, production capacity is likely to increase significantly. Additionally, researchers are continuously working on developing advanced catalysts with improved selectivity, activity, and stability for methanol synthesis, which is positively influencing the market growth. Besides this, ongoing research and development efforts are exploring advanced technologies such as carbon dioxide utilization and biomass conversion to further expand the range of methanol production options and promote sustainability, which is providing a considerable fuel to the market growth.
Methanol Industry Segmentation:
IMARC Group provides an analysis of the key trends in each segment of the global methanol market report, along with forecasts at the global and regional levels from 2025-2033. Our report has categorized the market based on the application.
Analysis by Application:
- Formaldehyde
- Dimethyl ether
- Gasoline
- Chloromethane
- MTBE/TAME
- Acetic acid
- Others
As per the latest methanol market outlook, formaldehyde leads the market in 2024. Methanol is a key raw material in the production of formaldehyde, which is a colorless gas with a pungent odor. It is widely used in manufacturing resins, various household products, plastics, and textiles. Formaldehyde is also used to make various resins, including urea-formaldehyde (UF), phenol-formaldehyde (PF), and melamine-formaldehyde (MF) resins. These resins are widely employed in the manufacture of plywood, particleboard, laminates, adhesives, coatings, and composite materials. Besides this, ethanol is used commercially as a stabilizer in formaldehyde solutions and generates hemiacetal or acetal compounds that prevent the formaldehyde's precipitation.
Regional Analysis:
- China
- Asia Pacific (excluding China)
- Europe
- North America
- Latin America
- Middle East and Africa
In 2024, China accounted for the largest market share, as per the recent methanol market forecast. China is one of the largest consumers and producers of methanol, which is used in diverse applications ranging from fuel and energy sources to chemicals and industrial processes. Methanol serves as a vital feedstock to produce various chemicals and chemical intermediates in China. It is used in the production of formaldehyde, acetic acid, methylamines, methyl methacrylate (MMA), dimethylformamide (DMF), and other chemicals that find applications in industries such as plastics, textiles, adhesives, and coatings. Moreover, China is a significant producer and consumer of dimethyl ether (DME), which is synthesized from methanol and is used as a clean-burning alternative to diesel fuel in transportation.
Key Regional Takeaways:
United States Methanol Market Analysis
Driven primarily by the chemical industry and increasing energy production, besides demanding an alternate type of fuel, the U.S. methanol market keeps experiencing growth. According to the U.S. Energy Information Administration, in the year, 2022, the country reportedly produced around 3.3 million metric tons of methanol. Methanol is being increasingly used in biodiesel production. U.S. biomass-based diesel output has reportedly touched about 4 billion gallons by 2023. As per Clean Fuels Alliance America, the country is also expanding its methanol-to-olefins capacity, which would add to its manufacturing sector. Top players like Methanex and Celanese hold an upper hand in the market. Methanex has even set up the largest methanol plant in the country. Policy support for cleaner fuels and improvements in methanol production technology continue to spur market growth. The United States is also an important exporter, with increased demand for methanol in Asian markets, making it a critical player in the global methanol industry.
Europe Methanol Market Analysis
The growth in Europe's methanol market is driven by growing demand for both the chemical and automotive sectors and greater consumption for green fuel technologies. According to the European Methanol Producers' Association, Europe produced around 8,540,000 tons in 2023, with countries like Germany and the Netherlands driving industrial demand. The European Union's pressure for reduction of carbon emissions is propelling investment in renewable methanol. For instance, various projects of methanol production from waste and biomass have been initiated. For example, a Netherlands-based company Carbon Clean Solutions aims to capture CO2 and convert it into methanol for use by chemical and energy sectors. Several automakers have already commenced testing of vehicles using methanol as fuel that may replace gasoline for the environment. Europe's tough environmental regulations also encourage innovation in methanol production, making it a leader in sustainable chemical manufacturing.
Asia Pacific Methanol Market Analysis
Increasing rapid industry demand, growing economic trend, and increasing energy necessities are driving the Asia Pacific methanol market. According to the International Methanol Institute, China is not only the world's biggest methanol producer, but its capacity exceeds 40 million tons by 2023. Notably, it is also the biggest importer of methanol with an import figure of 18 million tons in 2022. The most important one amongst them is India with the annual growth rate of methanol consumption pegged at 7%. This is because it promotes methanol-based fuels. It forms part of the National Policy on Biofuels, so demand within manufacturing processes for methanol is fairly high, as is often in the production of plastics and other chemicals. Investment is significant in methanol-to-olefins plants. There is also interest for the region in using methanol as a marine fuel, with Japan and South Korea leading the way with ships that run on methanol. The growth of the market is further supported by government-backed initiatives in both China and India, thus making Asia Pacific a crucial hub for both methanol production and consumption.
Latin America Methanol Market Analysis
Latin America's methanol market is growing steadily, mostly due to the demand from industrial chemicals and alternative fuels. According to an industry report, Trinidad and Tobago had a production capacity of more than 6 million metric tonnes of methanol per annum. Methanol Holdings (Trinidad) Limited alone boasts of producing over 4 million metric tonnes annually. Methanex Corporation's Atlas plant in Trinidad during the third quarter of 2023 produced 287,000 tonnes of methanol. Brazil has increased its production capacity in methanol while focusing on methanol usage for biodiesel and energy generation purposes. The middle class of countries like Argentina and Mexico are also showing a growing rate due to more industrialization and further pushing the demand for methanol. In addition, the growing demand of the region's petrochemical industry and clean fuel movement is opening doors to more opportunities for methanol in transportation. Export capabilities of Latin America are improving; countries such as Trinidad and Tobago will benefit from good demand coming from the United States and Asia Pacific. Latin America will continue to play an important role as one of the world's significant suppliers of methanol.
Middle East and Africa Methanol Market Analysis
This industry is growing steadily in the Middle East and Africa due to the vast natural gas reserves in the region and due to its importance in world energy markets. According to the industry reports, Iran and Saudi Arabia were among the top producers of methanol, with the ability to produce more than 10 million tons annually. Because the Middle East is strategically situated along global methanol trade lanes, it facilitates exports directly into Asia and Europe. Methanol is primarily consumed in Africa within South Africa, with continuous growth demands in industrial consumers such as plastics and chemicals. Expansion of methanol production sites by major companies in the Middle East is also supporting the region in terms of market share - SABIC and Qatar Fuel are major players in that region. Increased attention to using methanol as a substitute to the traditional fuel sources drives demand for alternative energy supply sources and fuels diversification. The region remains instrumental in the supply of methanol at the international level.
Competitive Landscape:
According to the emerging methanol market trends, several key players are significantly investing in research and development (R&D) projects to explore innovative methods to improve methanol production processes. Additionally, the development of advanced catalysts, novel reactor designs, and optimization of process conditions to improve methanol yield and energy efficiency and reduce environmental impacts is supporting the market growth. Furthermore, growing strategic partnerships between top companies, industry players, academic institutions, and research organizations to advance methanol-related technologies are further driving the market growth. Besides this, the leading market players and various manufacturers are investing in R&D activities to develop advanced production methods, such as the BASF and ICI processes. Several companies are also expanding their production capacities by establishing new plants to serve the growing markets and gain a competitive advantage.
The report provides a comprehensive analysis of the competitive landscape in the methanol market with detailed profiles of all major companies.
Recent Developments:
- November 2024: On NTPC's 50th Raising Day, the company launched the world's first CO₂-to-methanol conversion plant at its Vindhyachal facility. NTPC Chairman Gurdeep Singh said the company was well on the path in terms of its green technologies such as hydrogen, carbon capture, and indigenous development of methanol synthesis catalysts.
- October 2024: Transition Industries LLC executed a Letter of Intent (LOI) with Mitsubishi Gas Chemical Company, Inc. (MGC) for a long-term Methanol Sales Agreement. Transition Industries will sell MGC 1 million MT per annum of ultra-low carbon methanol from its Pacifico Mexinol project in Sinaloa, Mexico, slated to come onstream in 2028.
- October 2024: Maersk signs long-term bio-methanol offtake deal with LONGi Green Energy. This agreement will bring Maersk closer to reducing the greenhouse gas emission from its dual-fuel methanol vessels. Deliveries are expected to take place starting in 2026.
- June 2024: Mitshubishi Gas Chemical declared that it became Japan's first manufacturer to be capable of producing bio-methanol from digester gas at its Niigata Plant following the utilization-gas partnership agreement with Niigata Prefecture. Its certification is ISCC PLUS- the bio-methanol, which would be for the purpose of contributing toward decarbonization and producing environmentally responsible chemicals.
- February 2023: BASF SE signed an agreement with Linde Engineering to develop a new process for producing methanol from carbon dioxide. The process uses renewable energy sources, such as wind and solar power, to convert carbon dioxide into methanol, which can then be used as a fuel or chemical feedstock.
Methanol Market Report Scope:
| Report Features | Details |
|---|---|
| Base Year of the Analysis | 2024 |
| Historical Period | 2019-2024 |
| Forecast Period | 2025-2033 |
| Units | Billion USD, Million Tons |
| Scope of the Report | Exploration of Historical Trends and Market Outlook, Industry Catalysts and Challenges, Segment-Wise Historical and Future Market Assessment:
|
| Applications Covered | Formaldehyde, Dimethyl ether, Gasoline, Chloromethane, MTBE/TAME, Acetic acid, Others |
| Regions Covered | China, Asia-Pacific (excluding China), Europe, North America, Latin America, Middle East and Africa |
| Customization Scope | 10% Free Customization |
| Post-Sale Analyst Support | 10-12 Weeks |
| Delivery Format | PDF and Excel through Email (We can also provide the editable version of the report in PPT/Word format on special request) |
Key Benefits for Stakeholders:
- IMARC’s report offers a comprehensive quantitative analysis of various market segments, historical and current market trends, market forecasts, and dynamics of the methanol market from 2019-2033.
- The research study provides the latest information on the market drivers, challenges, and opportunities in the global methanol market.
- The study maps the leading, as well as the fastest-growing, regional markets. It further enables stakeholders to identify the key country-level markets within each region.
- Porter's five forces analysis assist stakeholders in assessing the impact of new entrants, competitive rivalry, supplier power, buyer power, and the threat of substitution. It helps stakeholders to analyze the level of competition within the methanol industry and its attractiveness.
- Competitive landscape allows stakeholders to understand their competitive environment and provides an insight into the current positions of key players in the market.
Key Questions Answered in This Report
The methanol market was valued at USD 38.0 Billion in 2024.
IMARC estimates the methanol market to exhibit a CAGR of 4.4% during 2025-2033.
The market is primarily driven by its rising demand as a feedstock for chemicals like formaldehyde and acetic acid, expanding use in fuel blending, adoption in methanol-to-olefins technology, and its application as an alternative marine fuel. Investments in renewable methanol production and its integration in energy storage systems are further propelling market growth.
On a regional level, the market has been classified into North America, Asia Pacific (excluding China), Europe, Latin America, and Middle East and Africa, wherein China currently dominates the market.
Need more help?
- Speak to our experienced analysts for insights on the current market scenarios.
- Include additional segments and countries to customize the report as per your requirement.
- Gain an unparalleled competitive advantage in your domain by understanding how to utilize the report and positively impacting your operations and revenue.
- For further assistance, please connect with our analysts.
 Request Customization
 Speak to an Analyst
 Request Brochure
 Inquire Before Buying
Benefits of Customization
- Personalize this research
- Triangulate with your data
- Get data as per your format and definition
- Gain a deeper dive into a specific application, geography, customer, or competitor
- Any level of personalization
Get in Touch With Us
UNITED STATES
Phone: +1-201-971-6302
INDIA
Phone: +91-120-433-0800
UNITED KINGDOM
Phone: +44-753-714-6104
Email: sales@imarcgroup.com
Client Testimonials


.webp)


