
Molybdenum Prices, Trend, Chart, Demand, Market Analysis, News, Historical and Forecast Data Report 2026 Edition
Molybdenum Price Trend, Index and Forecast
Track the latest insights on molybdenum price trend and forecast with detailed analysis of regional fluctuations and market dynamics across North America, Latin America, Central Europe, Western Europe, Eastern Europe, Middle East, North Africa, West Africa, Central and Southern Africa, Central Asia, Southeast Asia, South Asia, East Asia, and Oceania.
Molybdenum Prices Outlook Q2 2026
- USA: USD 57582/Ton
- China: USD 37343/Ton
- Russia: USD 33030/Ton
- Thailand: USD 35100/Ton
- Canada: USD 40811/Ton
Molybdenum Price Chart
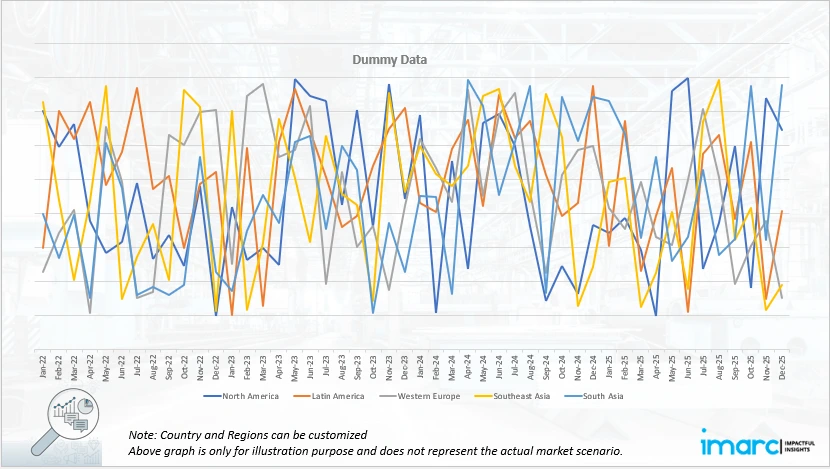
Get real-time access to monthly/quaterly/yearly prices, Request Sample
During the second quarter of 2026, the molybdenum prices in the USA reached 57582 USD/Ton in June. Prices moved upward as firm demand from the steel, aerospace, and energy sectors supported market sentiment. Stable manufacturing activity encouraged consistent procurement, while buyers maintained regular purchasing schedules to secure material availability. Supply remained balanced despite logistical constraints that occasionally influenced distribution efficiency.
During the second quarter of 2026, the molybdenum prices in China reached 37343 USD/Ton in June. Prices recorded a gradual increase as industrial production remained steady and demand from stainless steel and alloy manufacturers supported purchasing activity. Manufacturing operations maintained consistent raw material requirements, while infrastructure related consumption contributed to stable market fundamentals. Producers managed supply efficiently, preventing significant market imbalances and supporting healthy availability.
During the second quarter of 2026, the molybdenum prices in Russia reached 33030 USD/Ton in June. Prices strengthened moderately as domestic industrial demand remained resilient across steel production and engineering applications. Producers maintained stable operating rates, ensuring adequate market availability while avoiding oversupply. Demand from alloy manufacturers supported continuous procurement, and downstream industries maintained regular purchasing activity to meet production schedules.
During the second quarter of 2026, the molybdenum prices in Thailand reached 35100 USD/Ton in June. Prices recorded the strongest quarterly increase among the listed markets, supported by improving industrial demand and expanding manufacturing activity. Steel processing, fabrication, and engineering industries increased procurement to support production requirements, strengthening market fundamentals. Importers maintained active purchasing programs to ensure uninterrupted supply, while balanced inventory management prevented supply shortages.
During the second quarter of 2026, the molybdenum prices in Canada reached 40811 USD/Ton in June. Prices increased slightly as consistent industrial demand from mining, energy, and steel manufacturing supported market conditions. Domestic buyers maintained steady procurement strategies to meet ongoing production requirements while avoiding excessive inventory accumulation. Stable mining operations ensured reliable raw material availability, contributing to balanced supply across the market.
Molybdenum Prices Outlook Q2 2025
- USA: USD 50265/Ton
- China: USD 31360/Ton
- Russia: USD 25660/Ton
- Thailand: USD 25400/Ton
- Canada: USD 36310/Ton
During the second quarter of 2025, the molybdenum prices in the USA reached 50265 USD/Ton in June. In Q2 2025, molybdenum prices in the USA were influenced by consistent demand from the stainless steel and aerospace sectors, which maintained stable procurement volumes. Domestic mining output remained steady, but delays in rail freight and elevated fuel costs affected distribution efficiency. Trade policies involving import restrictions on select refined molybdenum products from Asia led to increased reliance on domestic and South American supply sources, shaping overall market sentiment.
During the second quarter of 2025, molybdenum prices in China reached 31360 USD/Ton in June. Molybdenum prices in China were impacted by strong demand from the steel alloy and energy equipment manufacturing sectors, especially amid increased infrastructure-related activity. Environmental inspections in Henan and Shaanxi provinces temporarily curtailed mining operations, tightening concentrate supply. Export volumes to Southeast Asia remained high, driven by regional contracts. Additionally, price negotiations were affected by fluctuations in power costs and restricted trucking availability in key production zones.
During the second quarter of 2025, the molybdenum prices in Russia reached 25660 USD/Ton in June. In Q2 2025, molybdenum prices in Russia were shaped by constrained mining operations in the eastern region due to labor shortages and equipment downtime. Demand from the oil and gas sector remained firm, particularly for drill pipe applications. Sanctions-related logistical challenges continued to limit access to Western processing technologies, causing inefficiencies in refining capacity. The ruble’s exchange volatility added further uncertainty to procurement and contract pricing.
During the second quarter of 2025, the molybdenum prices in Thailand reached 25400 USD/Ton in June. Thailand experienced molybdenum price movements driven by steady import demand from the stainless steel fabrication and electronics manufacturing sectors. Dependence on Chinese and South Korean molybdenum intermediates exposed the market to supply-side volatility, especially amid delayed maritime shipments. Additionally, localized increases in electricity and operational costs affected secondary refining facilities. The construction sector’s recovery contributed to consistent offtake from alloy producers, influencing quarterly procurement trends.
During the second quarter of 2025, the molybdenum prices in Canada reached 36310 USD/Ton in June. In Canada, molybdenum prices were influenced by active demand from the mining tools and pipeline steel manufacturing sectors. Production levels at major molybdenum mines remained stable, although wildfire-related transportation disruptions in British Columbia caused temporary delivery delays. Export demand from the USA and Europe added pressure to domestic inventories. Additionally, increases in energy and labor costs affected extraction margins, shaping supplier pricing strategies across the quarter.
Molybdenum Prices Outlook Q1 2025
- USA: USD 48,155/MT
- China: USD 26,329/MT
- Russia: USD 28,149/MT
Regional Coverage
The report provides a detailed analysis of the market across different regions, each with unique pricing dynamics influenced by localized market conditions, supply chain intricacies, and geopolitical factors. This includes price trends, price forecast and supply and demand trends for each region, along with spot prices by major ports. The report also provides coverage of FOB and CIF prices, as well as the key factors influencing molybdenum prices.
Europe Molybdenum Price Trend
Q2 2026:
The molybdenum price index in Europe showed a firm upward trend as demand from the steel, automotive, engineering, and renewable energy sectors remained healthy. Manufacturing activity supported regular procurement across downstream industries, while producers maintained disciplined production strategies that prevented market oversupply. Buyers continued purchasing according to operational requirements, contributing to balanced commercial activity throughout the region. Stable mining supply and efficient logistics supported consistent product availability despite localized transportation challenges.
Q2 2025:
As per the molybdenum price index, molybdenum prices in Europe were influenced by sustained demand from the stainless steel and chemical processing sectors, particularly in Germany and Italy. Import dependency on concentrates from South America and Asia exposed the region to cost fluctuations driven by maritime delays and port congestion. Regulatory changes around critical raw materials and heightened energy prices affected smelter operating costs. Additionally, planned maintenance at several European alloy facilities led to temporary shifts in procurement schedules and spot market activity.
Detailed price information for molybdenum can also be provided for an extensive list of European countries.
| Region | Countries Covered |
|---|---|
| Europe | Germany, France, United Kingdom, Italy, Spain, Russia, Turkey, Netherlands, Poland, Sweden, Belgium, Austria, Ireland, Switzerland, Norway, Denmark, Romania, Finland, Czech Republic, Portugal, and Greece, among other European countries. |
North America Molybdenum Price Trend
Q2 2026:
The molybdenum price index in North America strengthened due to resilient industrial activity and steady consumption across steel production, aerospace, energy, and infrastructure related industries. Producers maintained stable operating conditions while ensuring adequate supply availability to meet downstream demand. Buyers continued procurement according to production schedules, supporting orderly market activity without creating excessive inventory pressure. Efficient logistics and reliable mining operations contributed to uninterrupted product movement across the region.
Q2 2025:
As per the molybdenum price index, in North America, molybdenum prices were shaped by robust demand from the aerospace, automotive, and oilfield equipment sectors. Mining operations in the USA and Canada maintained consistent output, but regional logistics were disrupted by rail delays and weather-related constraints. Export demand from Europe added pressure on available inventories. Trade policy adjustments and currency movements also influenced cost structures, especially for buyers relying on imported refined molybdenum products.
Specific molybdenum historical data within the United States and Canada can also be provided.
| Region | Countries Covered |
|---|---|
| North America | United States and Canada |
Middle East and Africa Molybdenum Price Trend
Q2 2026:
According to the molybdenum price chart, prices in the Middle East and Africa fluctuated due to a complex interplay of causes, led by supply chain disruptions, seasonal demand swings, and geopolitical impacts.
Q2 2025:
As per the molybdenum price chart, the prices in the Middle East and Africa fluctuated due to a complex interplay of factors, primarily driven by supply chain disruptions, seasonal demand shifts, and geopolitical influences. A tight supply from refineries, exacerbated by maintenance rounds and unplanned outages, put pressure on prices. Simultaneously, demand from the agrochemical sector during the planting season contributed to price changes.
Region-wise data and information on specific countries within these regions can also be provided.
| Region | Countries Covered |
|---|---|
| Middle East & Africa | Saudi Arabia, UAE, Israel, Iran, South Africa, Nigeria, Oman, Kuwait, Qatar, Iraq, Egypt, Algeria, and Morocco, among other Middle Eastern and African countries. |
Asia Pacific Molybdenum Price Trend
Q2 2026:
The Asia Pacific molybdenum market recorded positive pricing momentum as expanding manufacturing activity and strong alloy production supported demand across major economies. Steel producers maintained consistent procurement programs to support production requirements, while engineering and industrial manufacturing sectors contributed to healthy material consumption. Producers managed supply efficiently, maintaining balanced availability despite varying regional demand patterns. Export activity remained supportive for several suppliers, strengthening overall market confidence and commercial activity.
Q2 2025:
In the Asia Pacific region, molybdenum prices were impacted by supply fluctuations in China due to environmental inspections and intermittent production halts at major mining sites. Downstream demand remained strong from the steel alloy, electronics, and construction sectors in South Korea, India, and Southeast Asia. Import dependency on Chinese molybdenum oxide shaped procurement strategies across the region. Additionally, freight rate volatility and energy input costs played a critical role in shaping overall pricing trends.
This molybdenum price analysis can be expanded to include a comprehensive list of countries within the region.
| Region | Countries Covered |
|---|---|
| Asia Pacific | China, India, Indonesia, Pakistan, Bangladesh, Japan, Philippines, Vietnam, Thailand, South Korea, Malaysia, Nepal, Taiwan, Sri Lanka, Hongkong, Singapore, Australia, and New Zealand, among other Asian countries. |
Latin America Molybdenum Price Trend
Q2 2026:
Latin America's molybdenum market is heavily influenced by its abundant natural resources, particularly in Chile and Brazil. However, political instability and varied regulatory regimes can cause significant volatility in molybdenum prices.
Q2 2025:
Latin America's molybdenum market is predominantly influenced by its rich natural reserves, particularly in countries like Chile and Brazil. However, political instability and inconsistent regulatory frameworks can lead to significant volatility in molybdenum prices. Infrastructure challenges and logistical inefficiencies often impact the supply chain, affecting the region's ability to meet international demand consistently. Moreover, the molybdenum price index, economic fluctuations, and currency devaluation are critical factors that need to be considered when analyzing molybdenum pricing trends in this region.
This comprehensive review can be extended to include specific countries within Latin America.
| Region | Countries Covered |
|---|---|
| Latin America | Brazil, Mexico, Argentina, Columbia, Chile, Ecuador, and Peru, among other Latin American countries. |
Molybdenum Pricing Report, Market Analysis, and News
IMARC's latest publication, “Molybdenum Prices, Trend, Chart, Demand, Market Analysis, News, Historical and Forecast Data Report 2026 Edition,” presents a detailed examination of the molybdenum market, providing insights into both global and regional trends that are shaping prices. This report delves into the spot price of molybdenum at major ports and analyzes the composition of prices, including FOB and CIF terms. It also presents detailed molybdenum prices trend analysis by region, covering North America, Europe, Asia Pacific, Latin America, and Middle East and Africa. The factors affecting molybdenum pricing, such as the dynamics of supply and demand, geopolitical influences, and sector specific developments, are thoroughly explored. This comprehensive report helps stakeholders stay informed with the latest market news, regulatory updates, and technological progress, facilitating informed strategic decision-making and forecasting.
Molybdenum Industry Analysis
The global molybdenum market size reached 577.6 Thousand Tons in 2025. By 2034, IMARC Group expects the market to reach 663.4 Thousand Tons, at a projected CAGR of 1.49% during 2026-2034. The market is primarily driven by the rising demand from stainless steel and specialty alloy manufacturing, expanding infrastructure and industrial development activities, and increasing consumption across energy, aerospace, and engineering applications.
Latest News and Developments:
- June 2026: Canada awarded C$7 million (USD 4.93 million) in grant funding to support the development of a molybdenum mining project in Greenland. The project, led by Greenland Resources, focuses on expanding the supply of molybdenum, a critical metal widely used in the aerospace, energy, and defense industries.
- July 2024: Ahmedabad-based Sanstar plans to raise ₹510 crore through an IPO, with ₹180 crore allocated for expanding its maize-based specialty products facility in Dhule, Maharashtra. This expansion will increase the plant's capacity from 1,100 to 2,100 tons per day. Sanstar manufactures various products, including molybdenum, which are utilized in the food, pharmaceutical, and animal nutrition sectors.
Product Description
Molybdenum is a high strength refractory metal with the chemical symbol Mo. It is known for its high melting point, excellent mechanical strength, corrosion resistance, thermal conductivity, and outstanding performance at elevated temperatures. Molybdenum is primarily extracted from molybdenite ore and is widely used as an alloying element to enhance the strength, hardness, wear resistance, and heat resistance of steel and stainless steel. It is also used in the production of superalloys, catalysts, lubricants, pigments, and chemical processing equipment due to its exceptional durability under demanding operating conditions. Molybdenum plays a vital role in the aerospace, automotive, energy, construction, mining, electronics, and oil and gas industries. Its ability to improve material performance in high temperature and high pressure environments makes it an essential raw material for a wide range of advanced industrial and engineering applications.
Report Coverage
| Key Attributes | Details |
|---|---|
| Product Name | Molybdenum |
| Report Features | Exploration of Historical Trends and Market Outlook, Industry Demand, Industry Supply, Gap Analysis, Challenges, Molybdenum Price Analysis, and Segment-Wise Assessment. |
| Currency/Units | US$ (Data can also be provided in local currency) or Metric Tons |
| Region/Countries Covered | The current coverage includes analysis at the global and regional levels only. Based on your requirements, we can also customize the report and provide specific information for the following countries: Asia Pacific: China, India, Indonesia, Pakistan, Bangladesh, Japan, Philippines, Vietnam, Thailand, South Korea, Malaysia, Nepal, Taiwan, Sri Lanka, Hongkong, Singapore, Australia, and New Zealand Europe: Germany, France, United Kingdom, Italy, Spain, Russia, Turkey, Netherlands, Poland, Sweden, Belgium, Austria, Ireland, Switzerland, Norway, Denmark, Romania, Finland, Czech Republic, Portugal and Greece North America: United States and Canada Latin America: Brazil, Mexico, Argentina, Columbia, Chile, Ecuador, and Peru Middle East & Africa: Saudi Arabia, UAE, Israel, Iran, South Africa, Nigeria, Oman, Kuwait, Qatar, Iraq, Egypt, Algeria, and Morocco The list of countries presented is not exhaustive. Information on additional countries can be provided if required by the client. |
| Information Covered for Key Suppliers |
|
| Customization Scope | The report can be customized as per the requirements of the customer |
| Report Price and Purchase Option |
Plan A: Monthly Updates - Annual Subscription
Plan B: Quarterly Updates - Annual Subscription
Plan C: Biannually Updates - Annual Subscription
|
| Post-Sale Analyst Support | 360-degree analyst support after report delivery |
| Delivery Format | PDF and Excel through email (We can also provide the editable version of the report in PPT/Word format on special request) |
Key Benefits for Stakeholders:
- IMARC’s report presents a detailed analysis of molybdenum pricing, covering global and regional trends, spot prices at key ports, and a breakdown of FOB and CIF prices.
- The study examines factors affecting molybdenum price trend, including input costs, supply-demand shifts, and geopolitical impacts, offering insights for informed decision-making.
- The competitive landscape review equips stakeholders with crucial insights into the latest market news, regulatory changes, and technological advancements, ensuring a well-rounded, strategic overview for forecasting and planning.
- IMARC offers various subscription options, including monthly, quarterly, and biannual updates, allowing clients to stay informed with the latest market trends, ongoing developments, and comprehensive market insights. The molybdenum price charts ensure our clients remain at the forefront of the industry.
Need more help?
- Speak to our experienced analysts for insights on the current market scenarios.
- Include additional segments and countries to customize the report as per your requirement.
- Gain an unparalleled competitive advantage in your domain by understanding how to utilize the report and positively impacting your operations and revenue.
- For further assistance, please connect with our analysts.
 Request Customization
 Inquire Before Buying
 Speak to an Analyst
 Request Brochure
Benefits of Customization
- Personalize this research
- Triangulate with your data
- Get data as per your format and definition
- Gain a deeper dive into a specific application, geography, customer, or competitor
- Any level of personalization
Get in Touch With Us
UNITED STATES
Phone: +1-201-971-6302
INDIA
Phone: +91-120-433-0800
UNITED KINGDOM
Phone: +44-753-714-6104
Email: [email protected]
Client Testimonials




.webp)




.webp)













Related Reports

Why Choose Us
IMARC offers trustworthy, data-centric insights into commodity pricing and evolving market trends, enabling businesses to make well-informed decisions in areas such as procurement, strategic planning, and investments. With in-depth knowledge spanning more than 1000 commodities and a vast global presence in over 150 countries, we provide tailored, actionable intelligence designed to meet the specific needs of diverse industries and markets.
1000
+Commodities
150
+Countries Covered
3000
+Clients
20
+Industry

Robust Methodologies & Extensive Resources
IMARC delivers precise commodity pricing insights using proven methodologies and a wealth of data to support strategic decision-making.

Subscription-Based Databases
Our extensive databases provide detailed commodity pricing, import-export trade statistics, and shipment-level tracking for comprehensive market analysis.

Primary Research-Driven Insights
Through direct supplier surveys and expert interviews, we gather real-time market data to enhance pricing accuracy and trend forecasting.

Extensive Secondary Research
We analyze industry reports, trade publications, and market studies to offer tailored intelligence and actionable commodity market insights.
Trusted by 3000+ industry leaders worldwide to drive data-backed decisions. From global manufacturers to government agencies, our clients rely on us for accurate pricing, deep market intelligence, and forward-looking insights.