
More Electric Aircraft Market Size, Share, Trends and Forecast by Application, Technology, Aircraft Type, and Region, 2026-2034
More Electric Aircraft Market Size and Share:
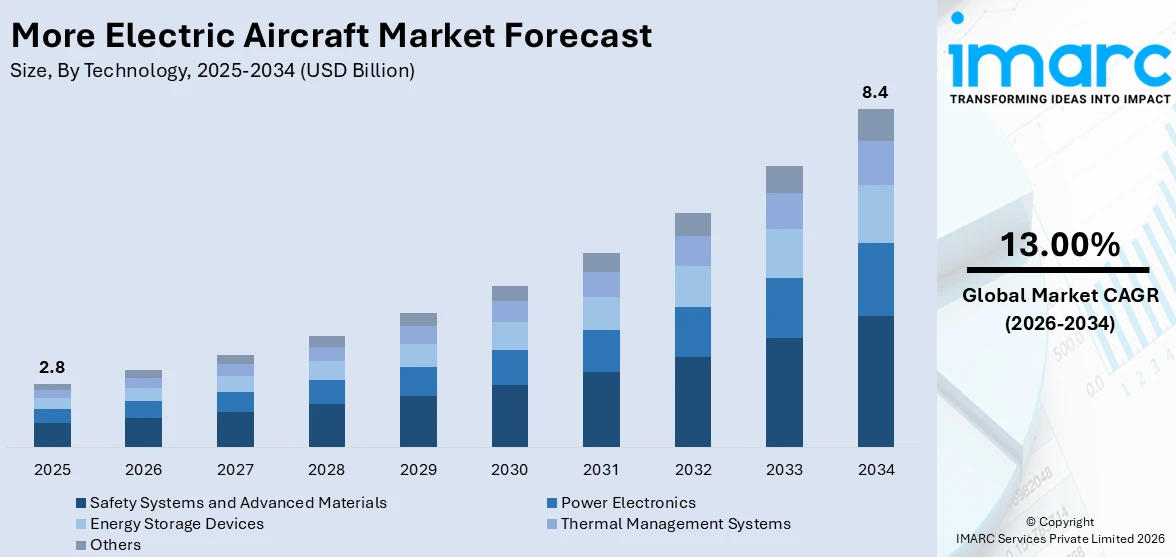
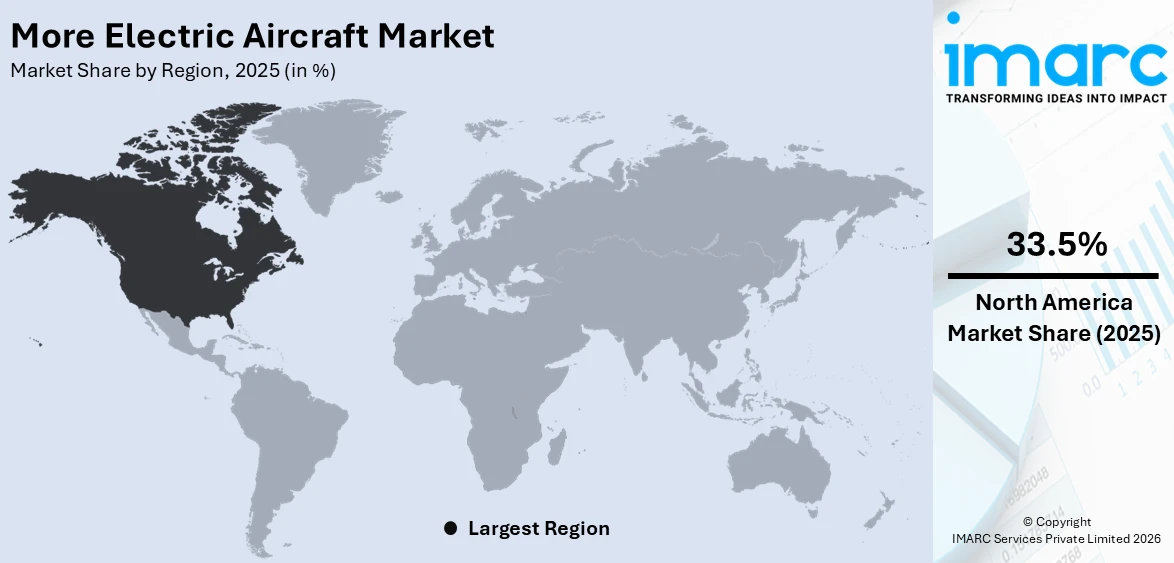
The global more electric aircraft market size was valued at USD 2.8 Billion in 2025. Looking forward, IMARC Group estimates the market to reach USD 8.4 Billion by 2034, exhibiting a CAGR of 13.00% from 2026-2034. North America currently dominates the market, holding a market share of over 33.5% in 2025. These growth drivers stem from increasing consciousness for sustainability by promoting ecofriendly aircraft, high pressure of strict environmental regulations from countries for an increased green aircraft option, and technology development or uptake in electrical aviation.
|
Report Attribute
|
Key Statistics
|
|---|---|
|
Base Year
|
2025
|
|
Forecast Years
|
2026-2034
|
|
Historical Years
|
2020-2025
|
|
Market Size in 2025
|
USD 2.8 Billion |
|
Market Forecast in 2034
|
USD 8.4 Billion |
| Market Growth Rate 2026-2034 | 13.00% |
One major driver in the more electric aircraft (MEA) market is the increasing focus on reducing carbon emissions and enhancing fuel efficiency in the aviation industry. Airlines and manufacturers are adopting electric systems to replace traditional hydraulic and pneumatic systems, leading to lighter aircraft and improved energy efficiency. This shift is in line with stringent environmental regulations and the industry's move towards sustainable aviation. Electric systems also offer enhanced reliability, reduced maintenance costs, and improved operational efficiency, further accelerating their adoption. The increasing demand for affordable and environmentally friendly air travel is fueling investments in MEA technologies, leading to substantial market growth.
To get more information on this market Request Sample
The U.S. holds a prominent position in the more electric aircraft (MEA) market with 87.50% market share, driven by its advanced aerospace industry and significant investments in innovation. Major U.S. manufacturers are at the forefront of developing MEA technologies to enhance fuel efficiency, reduce emissions, and comply with strict environmental regulations. The country's robust defense sector also contributes, with military programs adopting electric systems for improved performance and reliability. Furthermore, the strong presence of key players and research institutions promotes technological advancements. Supportive government policies and initiatives promoting sustainable aviation further bolster the U.S. as a critical contributor to the global MEA market.
More Electric Aircraft Market Trends:
Continuous technological advancements
Rapid technological developments across the globe are majorly driving the more electric aircraft market growth. Along with this, the development of aerospace engineering is associated with the continuous improvement of electrification to make aircraft more efficient and environmentally friendly. Recent developments in electric propulsion systems, battery, and power management systems have set the stage for the emergence of more electric aircraft. In addition, electric propulsion has multiple advantages for sustainability, such as lower emissions, reduced fuel consumption, and less noise. Moreover, these advancements allow the creation of more flexible and versatile aircraft platforms that can meet the diverse needs of consumers in various parts of the world. As a result, this is further increasing the market value of more electric aircraft.
Regulatory Pressures and Environmental Concerns
The market is growing due to regulations and environmental concerns. Aviation businesses are inclining toward sustainability trends for aerospace or airplanes after strict emissions laws were enacted by governments across the globe. With the sector being blamed for contributing heavily towards greenhouse gases, it has become necessary for airlines to adopt electric and hybrid-electric propulsion systems. The more electric aircraft market forecast suggests that commercial fleets will increasingly include “more-electric” airplanes as carriers race against time to cut down on carbon emissions. For instance, the Airbus A380 and A220, Boeing 787, ATR-600, and Embraer E2 aircraft use 3 liters or less of jet fuel per 100 passenger kilometers, matching the fuel consumption of most modern compact cars. Furthermore, there is a growing more electric aircraft demand which is prompting airlines to invest in them thereby driving up sales of MEEs (More Electric Aircraft).
Economic benefits and operational efficiency
In the global aerospace sector, significant market drivers are economic benefits offered and operational efficiency by more electric aircraft. According to a market research report, the electric aircraft market size reached USD 9.9 Billion in 2023. IMARC Group expects the market to reach USD 41.0 Billion by 2032, exhibiting a growth rate (CAGR) of 16.5% during 2024-2032. Thus, this is also favoring the more electric aircraft market revenue. In comparison with traditional engines, maintenance needs and fuel consumption are reduced by electric propulsion systems which promise lower costs over a long time. In addition, electric power also allows for new business models such as urban air mobility services or electric air taxis among airlines. Furthermore, these systems have better on-time performance through operational flexibility as well as reliability that enhances passenger experience. Moreover, the increasing appeal of additional electrical airplanes to airlines is driven by their desire to streamline operations while cutting down on overheads which is leading to market expansion and innovation within the aerospace industry.
More Electric Aircraft Industry Segmentation:
IMARC Group provides an analysis of the key trends in each segment of the global more electric aircraft market, along with forecast at the global, regional, and country levels from 2026-2034. The market has been categorized based on application, technology, and aircraft type.
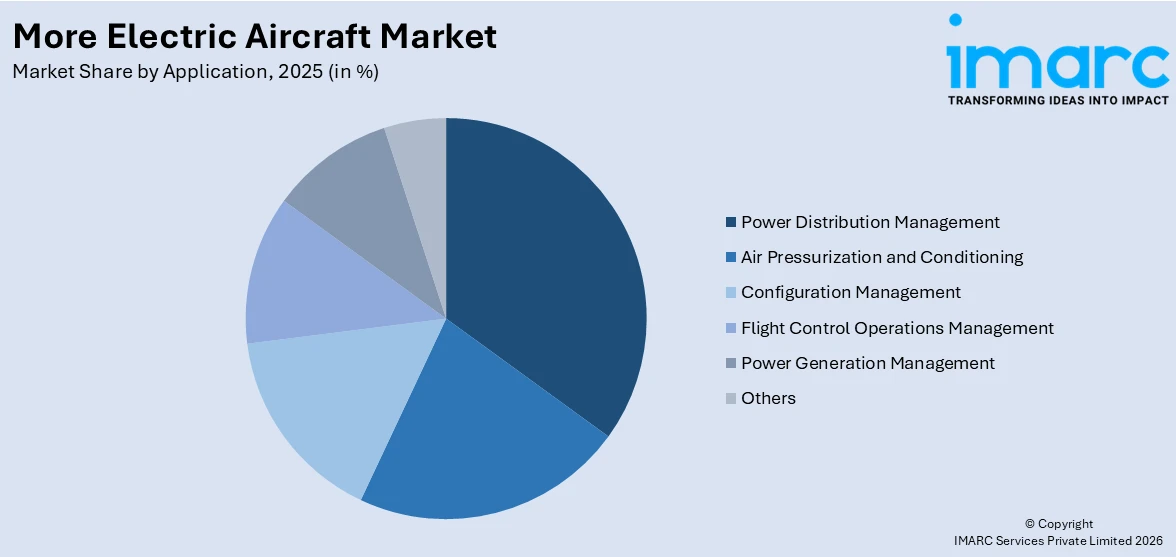
Analysis by Application:
Access the comprehensive market breakdown Request Sample
- Air Pressurization and Conditioning
- Configuration Management
- Flight Control Operations Management
- Power Generation Management
- Power Distribution Management
- Others
Power distribution management stands as the largest component in 2025 due to its critical role in efficient energy utilization. As aircraft increasingly adopt electric systems, the need for advanced power distribution networks has surged to manage electricity flow across various subsystems effectively. These systems ensure optimal power allocation, reduce energy losses, and enhance overall aircraft performance. Innovations in solid-state power controllers, intelligent monitoring, and real-time fault detection further strengthen their adoption. The transition to lightweight, compact, and highly reliable power distribution units aligns with the industry's emphasis on enhancing fuel efficiency and minimizing emissions. The growing integration of electric technologies in both commercial and military aircraft underscores the prominence of power distribution management.
Analysis by Technology:
- Safety Systems and Advanced Materials
- Power Electronics
- Energy Storage Devices
- Thermal Management Systems
- Others
The More Electric Aircraft (MEA) market's technological segmentation highlights critical innovations enhancing performance and sustainability. Safety Systems and Advanced Materials play a pivotal role in ensuring aircraft reliability and reducing weight through composite materials, contributing to fuel efficiency. Power Electronics facilitate efficient energy conversion and distribution, crucial for managing electric systems in MEA.
Energy storage devices, including advanced batteries and supercapacitors, meet the increasing demand for high energy density and quick charging capabilities. Thermal Management Systems ensure optimal operation of electronic components by dissipating heat, thereby improving system longevity and safety. Others encompass supporting technologies, including actuators and sensors, that integrate seamlessly to enable electric functionalities, optimizing overall aircraft performance and operational efficiency.
Analysis by Aircraft Type:
- Fixed Wing (Narrow Body/Wide Body/Very Large Body) Aircraft
- Rotary Wing Aircraft
- Unmanned Aerial Vehicles
- Others
In 2025, Fixed wing (narrow body/wide body/very large body) aircraft due to their extensive adoption in commercial aviation. Narrow-body aircraft, widely used for short and medium-haul routes, drive significant demand owing to their fuel efficiency and frequency of operation. Wide-body and very large body aircraft, primarily used for long-haul flights, further contribute by integrating advanced electric systems to reduce fuel consumption and carbon emissions. The shift toward sustainable aviation has accelerated the adoption of MEA technologies in this segment, enabling enhanced operational efficiency and compliance with stringent environmental regulations. Additionally, advancements in lightweight materials and energy-efficient power systems strengthen their prominence, catering to the growing global air travel demand.
Regional Analysis:
To get more information on the regional analysis of this market Request Sample
- North America
- United States
- Canada
- Asia Pacific
- China
- Japan
- India
- South Korea
- Australia
- Indonesia
- Others
- Europe
- Germany
- France
- United Kingdom
- Italy
- Spain
- Russia
- Others
- Latin America
- Brazil
- Mexico
- Others
- Middle East and Africa
In 2025, North America accounted for the largest market share of over 33.5% driven by the region's advanced aerospace sector, significant defense budgets, and the early adoption of innovative aviation technologies. North America, particularly the United States, is home to major aerospace manufacturers and research institutions actively developing MEA technologies to improve fuel efficiency, reduce emissions, and meet stringent environmental standards. The robust defense sector's adoption of electric systems for enhanced reliability and performance further boosts the market. Additionally, supportive government policies, such as tax incentives and funding for sustainable aviation projects, foster innovation and market growth, solidifying North America's leadership in the global MEA market.
Key Regional Takeaways:
United States More Electric Aircraft Market Analysis
The growing adoption of electric aircraft in the United States is driven by increased investments in the aerospace sector and the strong presence of established aerospace firms. According to reports, there are approximately 1,509 aircraft, engine & parts manufacturing businesses in the US as of 2023. The rising investments in research and development are contributing to advancements in electric aircraft technology, improving their efficiency, and making them a viable alternative to conventional aviation. Furthermore, the backing from large aerospace companies is facilitating the development of cutting-edge technologies, supporting the commercialization and scaling of electric aircraft. These investments also promote regulatory support and public-private partnerships that accelerate the development of green aviation solutions. As the aerospace industry embraces sustainability and energy-efficient alternatives, more electric aircraft are being designed to meet the increasing demand for environmentally friendly solutions in air travel. This collaborative environment accelerates technological advancements, positioning electric aircraft as a significant component in the future of aviation.
Europe More Electric Aircraft Market Analysis
In Europe, the adoption of electric aircraft is gaining momentum due to the heightened focus on reducing greenhouse gas emissions. According to reports, in the second quarter of 2024, EU economy greenhouse gas emissions were estimated at 790 Million Tons of CO2-equivalents. Governments and industries are increasingly committed to achieving sustainability goals, and the aviation sector, as a significant contributor to emissions, is under pressure to transition to more eco-friendly solutions. Electric aircraft offer a promising pathway to reducing carbon footprints in the aviation industry by utilizing clean energy sources. As environmental regulations tighten and public awareness of climate change increases, the demand for sustainable air travel options grows. This drive for carbon neutrality is fueling innovation and investments in electric aircraft technology. Furthermore, many European countries are fostering a favorable policy environment and providing financial incentives for the development of electric aviation, ensuring that green technologies like electric aircraft are more accessible and feasible.
Asia Pacific More Electric Aircraft Market Analysis
The adoption of electric aircraft is increasing in the Asia-Pacific region due to the expanding network of airports that support short-distance travel. In the past decade, the number of airports in India has increased twofold, reaching 157, and it is projected to grow by an additional 50 in the next five years. As more airports are being developed and upgraded in the region, there is a growing need for sustainable solutions that cater to the region's dynamic air travel demands. Short-distance flights, especially those within highly populated cities and across islands, are ideal for electric aircraft, as these planes can meet the needs of regional travel without contributing heavily to pollution. The accessibility of smaller airports also minimizes operational challenges for electric aircraft, making it a more attractive option for airlines. As the network of short-distance routes grows, electric aircraft can play a pivotal role in reducing emissions and enhancing the efficiency of regional air travel.
Latin America More Electric Aircraft Market Analysis
The growing adoption of electric aircraft in Latin America is largely influenced by the increasing air traffic in the region. For instance, passenger traffic in Latin America and the Caribbean grew by 7.6% in January 2024, adding nearly 3 Million passengers compared to January 2023, signaling robust growth in air traffic. As more people travel within and across Latin American nations, the demand for efficient, cost-effective, and eco-friendly air transportation solutions rises. Electric aircraft provide an answer to the growing need for regional flights that are both affordable and sustainable. These aircraft are especially ideal for short-haul flights, a prevalent mode of travel in the region. The expansion of domestic and regional flight routes further encourages the use of electric aircraft, as they can help reduce the environmental impact of increasing air traffic. With governments and private enterprises showing interest in sustainable transportation solutions, the transition to electric aircraft in Latin America is poised to accelerate in the coming years.
Middle East and Africa More Electric Aircraft Market Analysis
Advancements in technology and the growing tourism sector in the Middle East and Africa are helping to drive the adoption of electric aircraft. For example, Dubai recorded an impressive 14.96 million overnight visitors between January and October 2024, showing an 8% growth over the same period in 2023, highlighting the surge in tourism. The region's rapid development in the aviation and tourism industries creates a perfect opportunity for sustainable solutions to address the rising demand for air travel. Electric aircraft, with their lower operational costs and minimal environmental impact, are particularly appealing for short to medium-distance routes commonly used by tourists. As the Middle East and Africa continue to attract a growing number of international visitors, the need for efficient, eco-friendly air transportation becomes more urgent. The region’s commitment to modernizing airports and infrastructure also supports the adoption of electric aircraft, ensuring they can be seamlessly integrated into the region's expanding air travel network.
Competitive Landscape:
The MEA market's competitive environment is marked by strong innovation and strategic partnerships between aerospace manufacturers, technology providers, and research institutions. Companies are focusing on developing advanced electric systems, such as electric actuators, power distribution units, and energy storage solutions, to meet the growing demand for sustainable and efficient aviation technologies. Major players focus on forming partnerships with government bodies and airlines to speed up the adoption of MEA technologies. Furthermore, substantial investments in research and development are fueling progress in electric propulsion systems and lightweight materials. The market also sees regional competition, with North America and Europe leading, while emerging markets in Asia-Pacific are gaining prominence due to increased demand for commercial and military aircraft.
The report provides a comprehensive analysis of the competitive landscape in the more electric aircraft market with detailed profiles of all major companies, including:
- Airbus SE
- Bombardier Inc.
- Honeywell International Inc.
- Lockheed Martin Corporation
- Raytheon Technologies Corporation
- Rolls-Royce Holdings Plc
- Safran S.A.
- Thales Group
- The Boeing Company
- TTTech Computertechnik AG
- United Technologies Corporation
Latest News and Developments:
- In December 2024 EcoPulse, a hybrid-electric propulsion aircraft created by Daher, Safran, and Airbus, successfully concluded its flight test campaign. This milestone offers valuable insights to support aviation's 2050 decarbonization goals. The French aerospace collaboration showcases advancements in hybrid-electric aircraft design, certification, and operation. The project reinforces innovation toward sustainable air transport solutions.
- In December 2024, The INTEGRAL E, an all-electric training aircraft developed by AURA AERO, completed its maiden flight on December 3rd over Toulouse's Francazal area. This marks a milestone for 100% electric general aviation. Safran played a pivotal role, supplying the aircraft's electric motor and its distribution and protection systems. The successful flight underscores progress in sustainable aviation technology.
- In December 2024, Swedish startup Heart Aerospace is gearing up for the inaugural flight of its X1 electric demonstrator, which closely resembles the size of its upcoming 30-seat ES-30 commercial aircraft. Designed for short runways, the ES-30 boasts high-torque electric motors, turbo propellers, and a hybrid system, enabling a range of nearly 250 miles (400 km). The groundbreaking test flight is scheduled for early 2025 in Plattsburgh, N.Y. This innovation marks a significant leap in sustainable aviation technology.
- In February 2024, Airbus SE plans to deliver approximately 800 aircraft in 2024, aiming to capitalize on growing demand. The production increase focuses on the A320 family, a high-demand single-aisle jet series. This move comes as rival Boeing faces setbacks, including a major operational crisis after a severe incident. The strategy underscores Airbus's intent to dominate the competitive aviation market.
- In January 2024, Lockheed Martin and Indra signed a collaboration agreement to strengthen their defense capabilities. This partnership seeks to strengthen global security solutions by merging the expertise of both companies. It also focuses on advancing simulation technologies and sustainment solutions for long-term operational support. The increasing demand for affordable and environmentally friendly air travel is fueling investments in MEA technologies, leading to substantial market growth.
More Electric Aircraft Market Report Scope:
| Report Features | Details |
|---|---|
| Base Year of the Analysis | 2025 |
| Historical Period | 2020-2025 |
| Forecast Period | 2026-2034 |
| Units | Billion USD |
| Scope of the Report | Exploration of Historical Trends and Market Outlook, Industry Catalysts and Challenges, Segment-Wise Historical and Future Market Assessment:
|
| Applications Covered | Air Pressurization and Conditioning, Configuration Management, Flight Control Operations Management, Power Generation Management, Power Distribution Management, Others |
| Technologies Covered | Safety Systems and Advanced Materials, Power Electronics, Energy Storage Devices, Thermal Management Systems, Others |
| Aircraft Types Covered | Fixed Wing (Narrow Body/Wide Body/Very Large Body) Aircraft, Rotary Wing Aircraft, Unmanned Aerial Vehicles, Others |
| Regions Covered | Asia Pacific, Europe, North America, Latin America, Middle East and Africa |
| Countries Covered | United States, Canada, Germany, France, United Kingdom, Italy, Spain, Russia, China, Japan, India, South Korea, Australia, Indonesia, Brazil, Mexico |
| Companies Covered | Airbus SE, Bombardier Inc., Honeywell International Inc., Lockheed Martin, Raytheon Company, Rolls-Royce Holdings Plc., Safran S.A., Thales Group, The Boeing Company, TTTech Computertechnik AG, United Technologies Corporation, etc. |
| Customization Scope | 10% Free Customization |
| Post-Sale Analyst Support | 10-12 Weeks |
| Delivery Format | PDF and Excel through Email (We can also provide the editable version of the report in PPT/Word format on special request) |
Key Benefits for Stakeholders:
- IMARC’s report offers a comprehensive quantitative analysis of various market segments, historical and current market trends, market forecasts, and dynamics of the more electric aircraft market from 2020-2034.
- The research study provides the latest information on the market drivers, challenges, and opportunities in the global more electric aircraft market.
- The study maps the leading, as well as the fastest-growing, regional markets. It further enables stakeholders to identify the key country-level markets within each region.
- Porter's Five Forces analysis assists stakeholders in assessing the impact of new entrants, competitive rivalry, supplier power, buyer power, and the threat of substitution. It helps stakeholders to analyze the level of competition within the more electric aircraft industry and its attractiveness.
- Competitive landscape allows stakeholders to understand their competitive environment and provides an insight into the current positions of key players in the market.
Frequently Asked Questions About the More Electric Aircraft Market Report
A More Electric Aircraft (MEA) replaces traditional hydraulic, pneumatic, and mechanical systems with advanced electrical systems to enhance efficiency, reduce weight, and lower fuel consumption. MEAs improve operational reliability and sustainability, aligning with environmental goals and modern aviation demands for cost-effective, eco-friendly, and technologically advanced aircraft solutions.
The more electric aircraft market was valued at USD 2.8 Billion in 2025.
IMARC estimates the global more electric aircraft market to exhibit a CAGR of 13.00% during 2026-2034.
Key factors driving the More Electric Aircraft (MEA) market include rising demand for fuel-efficient and eco-friendly aviation, advancements in power electronics and energy storage, and stringent environmental regulations. Enhanced safety, reduced operational costs, and increased adoption in commercial and defense sectors further support the market's growth and technological evolution.
In 2025, power distribution management represented the largest segment by application, driven by its critical role in energy efficiency and system reliability.
Fixed wing (narrow body/wide body/very large body) aircraft leads the market by aircraft type owing to their widespread use in commercial aviation and long-haul flights.
On a regional level, the market has been classified into North America, Asia Pacific, Europe, Latin America, and Middle East and Africa, wherein North America currently dominates the global market.
Some of the major players in the global more electric aircraft market include Airbus SE, Bombardier Inc., Honeywell International Inc., Lockheed Martin, Raytheon Company, Rolls-Royce Holdings Plc., Safran S.A., Thales Group, The Boeing Company, TTTech Computertechnik AG, United Technologies Corporation, etc.
Need more help?
- Speak to our experienced analysts for insights on the current market scenarios.
- Include additional segments and countries to customize the report as per your requirement.
- Gain an unparalleled competitive advantage in your domain by understanding how to utilize the report and positively impacting your operations and revenue.
- For further assistance, please connect with our analysts.
 Request Customization
 Speak to an Analyst
 Request Brochure
 Inquire Before Buying
Benefits of Customization
- Personalize this research
- Triangulate with your data
- Get data as per your format and definition
- Gain a deeper dive into a specific application, geography, customer, or competitor
- Any level of personalization
Get in Touch With Us
UNITED STATES
Phone: +1-201-971-6302
INDIA
Phone: +91-120-433-0800
UNITED KINGDOM
Phone: +44-753-714-6104
Email: [email protected]
Client Testimonials


.webp)


