
Nanosensors Market Size, Share, Trends and Forecast by Type, Technology, Application, and Region, 2026-2034
Nanosensors Market Size and Share:
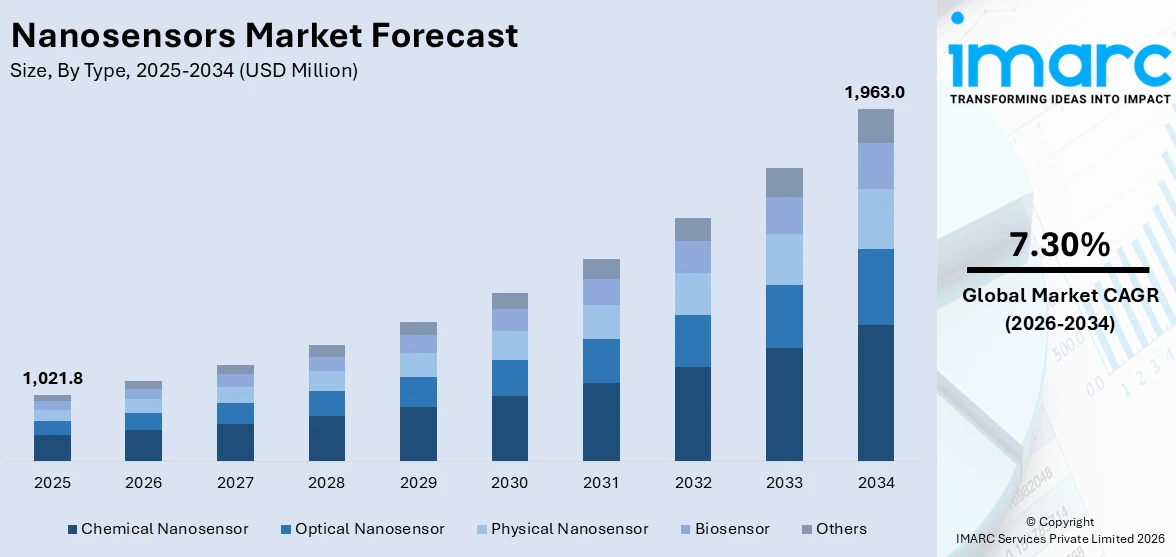
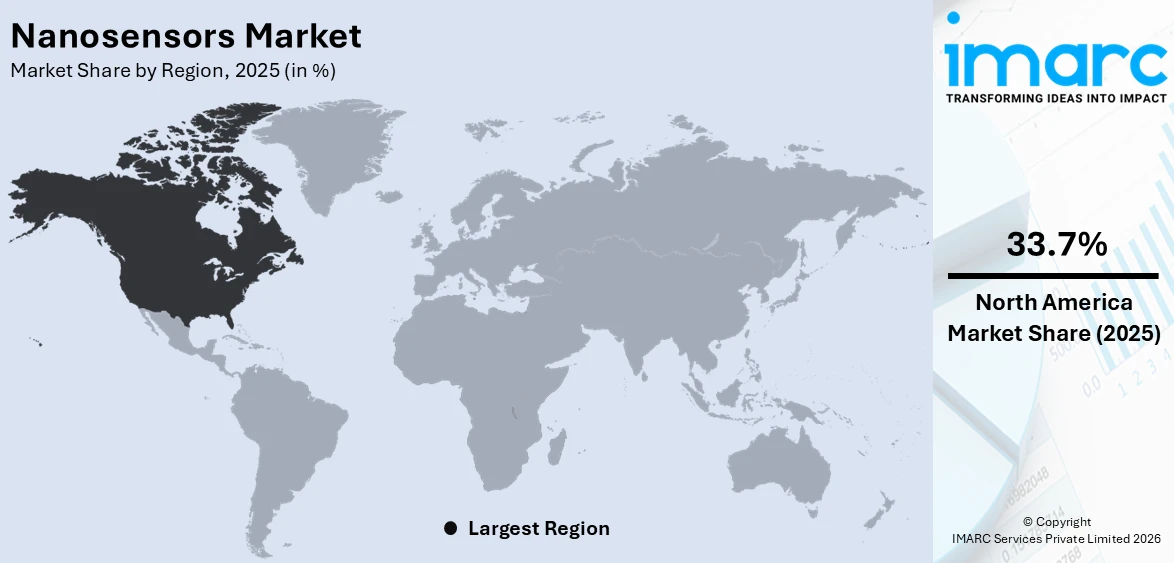
The global nanosensors market size was valued at USD 1,021.8 Million in 2025. Looking forward, IMARC Group estimates the market to reach USD 1,963.0 Million by 2034, exhibiting a CAGR of 7.30% during 2026-2034. North America currently dominates the market, holding a significant market share of over 33.7% in 2025. This leadership is driven by strong investments in R&D, healthcare innovation, and advanced technology adoption across multiple industries.
|
Report Attribute
|
Key Statistics
|
|---|---|
|
Base Year
|
2025
|
|
Forecast Years
|
2026-2034
|
|
Historical Years
|
2020-2025
|
|
Market Size in 2025
|
USD 1,021.8 Million |
|
Market Forecast in 2034
|
USD 1,963.0 Million |
| Market Growth Rate (2026-2034) | 7.30% |
The increasing demand for precision healthcare and medical diagnostics is the principal instrumental driver for the nanosensor market growth. The early detection of disease, the real-time monitoring of health, and the targeted delivery of therapeutics are all enabling nanosensors to improve patient life very substantially. Their high degree of sensitivity with miniaturization to detect biomarkers at the molecular level is aiding the fast-tracking of their emergence in biomedical applications. Also, with advancements in nanotechnology whereby nanosensors can now be integrated with artificial intelligence, there is further enhancement of diagnostic accuracy and efficiency. Other drivers of market growth include a broad increase in the incidence of chronic diseases, greater investment in personalized medicine, and untold efforts invested in research around biosensing technologies, thus, nanosensors position themselves firmly as an important element of next-generation healthcare technologies. For instance, in January 2025, researchers developed all-optical nanosensors with luminescent nanocrystals, offering 100x better force sensitivity and a wider operational range, enabling remote readouts without wires and high-resolution, multiscale functionality.
To get more information on this market Request Sample
The United States is a key player in the nanosensors market, driven by strong research and development initiatives, government funding, and robust industrial collaborations. Leading institutions and companies are pioneering advancements in nanotechnology, enhancing nanosensor applications in healthcare, defense, and environmental monitoring. The U.S. Food and Drug Administration (FDA) is supporting regulatory pathways for medical nanosensors, accelerating commercialization. For instance, in January 2024, Nanowear's SimpleSense-BP, a wearable device combining nanotechnology sensors, AI, and machine learning, received FDA 510(k) clearance as a continuous blood pressure monitor for cardiopulmonary decision support. Additionally, partnerships between academic research centers and technology firms are fostering innovation, representing one of the key nanosensors market trends. Federal agencies, including the National Science Foundation (NSF) and the National Institutes of Health (NIH), are investing in nanotechnology research, ensuring the U.S. remains at the forefront of nanosensor development and deployment.
Nanosensors Market Trends:
Growing Integration of Nanosensors in Healthcare Diagnostics
Application of nanosensors within the discipline of healthcare is growing at a rapid pace as a result of their capability to make disease detection accurate as well as real time. Nanoscale devices have made it possible to probe biomolecules, pathogens, and biomarkers with very high sensitivity, which makes them essential elements in early diagnosis and personalized medicine. Applications include cancer detection, glucose monitoring in diabetes, and early detection of neurodegenerative diseases. In addition, nanosensors would provide convenient non-invasive and point-of-care diagnostics, thus reducing the need for clinical laboratories and improving patient outcomes. Investments in nanomedicine are growing, and many companies are innovating new types of rapid and accurate nanosensor diagnostics. Governments and healthcare institutions promote nanotechnology-based solutions in order to improve monitoring and effectiveness in illnesses. The U.S. National Nanotechnology Initiative (NNI) received USD 2.16 billion in the 2024 federal budget, reflecting sustained investment in nanotechnology, with a cumulative total exceeding USD 43 billion since 2001, as per reports. AI and big data analytics in combination with nanosensors are expected to extend their application in predictive healthcare and track patients from a distance, which will consequently contribute to growth in the global market for nanosensors at huge rates.
Rising Demand for Nanosensors in Environmental Monitoring
The growing emphasis on environmental sustainability and regulatory requirements is driving the use of nanosensors for pollution monitoring and detection of harmful substances. The extremely sensitive sensors are capable of detecting toxic gases, heavy metals, and waterborne pollutants at trace concentrations, greatly improving pollution control. Manufacturing, oil and gas, and agricultural industries are utilizing nanosensors to track air and water quality in real-time, maintaining strict environmental regulations. Governments across the globe are also using nanosensor-based networks for mass-scale environmental monitoring to evaluate the effects of climate change and enhance public health security. The European Union has designated one-third of the investments of the NextGenerationEU Recovery Plan and the seven-year EU budget, namely €1.8 trillion (USD 1.87 trillion), to finance the European Green Deal with measures that would include their pollution-following initiatives. Recent development in nanomaterials like carbon nanotubes and quantum dots has greatly improved the specificity and precision of nanosensors, making them a must in ecological applications. As awareness regarding air and water pollution risks expands, the future demand for nanosensors for environmental safety will increase, classifying them as a major future technology for sustainable initiatives.
Advancements in IoT-Enabled Nanosensors for Industrial Applications
The nanosensors-IoT system has integrated industrial automation systems in such a way that real-time monitoring and predictive maintenance are possible. While nanosensors advance operational efficiency and reduce downtime and equipment failures in industries such as automotive, aerospace, and energy, these ultra-small sensors monitor slight changes in temperature, pressure, and chemical composition for use in industrial safety applications. The industrial report mentions the figure of 29 billion IoT-connected devices across the globe by 2030, with the sizeable responsibility on nanosensors for driving data decision-Making and enhancing operational efficiency in numerous industries. Prestigious wireless communications and cloud computing accentuate their work by providing instantaneous data analytics and automated alerts. While smart manufacturing and Industry 4.0 keep growing, nanosensors will dominate this field in intelligent decision-making and optimizing resource utilization. Thus, in the years to come, with the growing demand for connected and autonomous industrial systems, a major boost in the nanosensors market is expected.
Nanosensors Industry Segmentation:
IMARC Group provides an analysis of the key trends in each segment of the global nanosensors market, along with forecast at the global, regional, and country levels from 2026-2034. The market has been categorized based on type, technology, and application.
Analysis by Type:
- Optical Nanosensor
- Chemical Nanosensor
- Physical Nanosensor
- Biosensor
- Others
Chemical nanosensor leads the market in 2025 due to their significant advancements in precision, sensitivity, and versatility. These nanosensors are capable of detecting specific chemical compounds at the molecular level, enabling real-time monitoring of a wide range of processes in fields like environmental monitoring, healthcare, food safety, and industrial applications. Their high sensitivity allows for early detection of pollutants, contaminants, or biomarkers, improving both preventative measures and treatment outcomes. In healthcare, chemical nanosensors enable early disease detection and personalized medicine by identifying specific biomarkers associated with various diseases. Additionally, their miniaturization and integration with technologies like AI and IoT are driving adoption, further expanding their use in diagnostics, monitoring systems, and automation, making them critical tools for the future.
Analysis by Technology:
- Molecular Self Assembly
- Top-down Assembly
- Bottom-up Assembly
Molecular self-assembly is a process where molecules spontaneously organize into structured patterns without external direction. In the nanosensor market, this technology enables the creation of highly precise, cost-effective nanosensors. It allows for the development of sensors with tailored properties, improving their sensitivity and functionality, which is crucial for applications in healthcare, environmental monitoring, and diagnostics.
Top-down assembly involves etching or patterning larger structures to create nanoscale components. In the nanosensor market, this technique is used to fabricate intricate sensor devices with high precision and scalability. It supports the development of sensors with advanced functionalities, such as improved detection capabilities, for use in medical diagnostics, chemical analysis, and industrial monitoring, while ensuring large-scale production efficiency.
Bottom-up assembly constructs nanosensors by building materials atom by atom or molecule by molecule. This technology plays a crucial role in the nanosensor market by enabling the fabrication of sensors with unique properties, such as ultra-high sensitivity and selectivity. It is particularly valuable in developing sensors for detecting specific biomarkers in healthcare, and contaminants in environmental and food safety applications.
Analysis by Application:
Access the comprehensive market breakdown Request Sample
- Electronics
- Chemical Manufacturing
- Energy
- Aerospace and Defense
- Healthcare
- Others
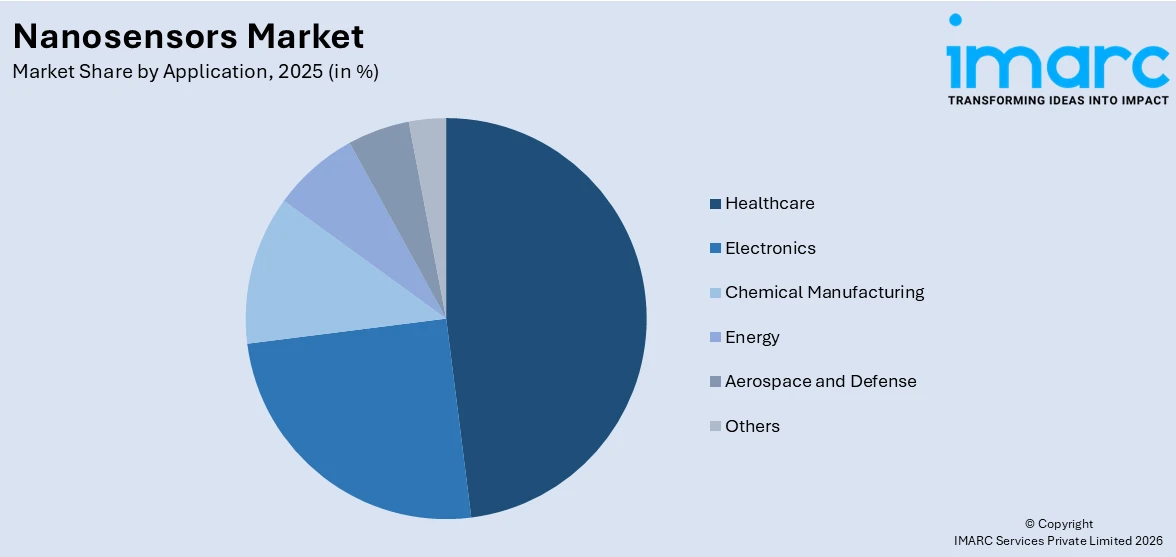
Healthcare leads the market with around 48.3% of market share in 2025. The growing demand for precision medicine, early disease detection, and real-time health monitoring is driving this trend. Nanosensors in healthcare are revolutionizing diagnostics by enabling the detection of specific biomarkers at the molecular level, allowing for quicker and more accurate diagnoses. They are particularly valuable in areas such as cancer detection, diabetes monitoring, and cardiology. Additionally, nanosensors are essential for targeted drug delivery, ensuring medications are administered precisely where needed, minimizing side effects. As the healthcare industry increasingly adopts nanotechnology, the integration of nanosensors with artificial intelligence and wearable devices further accelerates their potential, positioning them as crucial tools for improving patient outcomes and advancing personalized healthcare.
Regional Analysis:
To get more information on the regional analysis of this market Request Sample
- North America
- United States
- Canada
- Europe
- Germany
- France
- United Kingdom
- Italy
- Spain
- Russia
- Others
- Asia Pacific
- China
- Japan
- India
- South Korea
- Australia
- Indonesia
- Others
- Latin America
- Brazil
- Mexico
- Others
- Middle East and Africa
In 2025, North America accounted for the largest nanosensors market share of over 33.7%. This dominance can be attributed to the region's robust healthcare infrastructure, significant investments in research and development, and the increasing demand for advanced technologies in industries like healthcare, automotive, and manufacturing. The growing prevalence of chronic diseases, alongside the rising adoption of precision medicine and personalized healthcare, has fueled the demand for nanosensors in diagnostics and monitoring. Additionally, North America benefits from the presence of leading technology companies and academic institutions, which are driving innovation in nanotechnology. The region's favorable regulatory environment and focus on cutting-edge healthcare solutions further bolster the adoption of nanosensors, ensuring continued growth in the market.
Key Regional Takeaways:
United States Nanosensors Market Analysis
US accounts for 77.5% share of the market in North America. The nanosensors market in the U.S. is rapidly growing due to increasing applications in healthcare, defense, and industrial sectors. According to the National Nanotechnology Initiative, the federal budget for nanotechnology research in the U.S. was around USD 1.99 billion for the year 2023, thus creating further momentum in the growth of nanosensors. Early disease detection and drug delivery applications are the primary drivers in health care. Nanosensors are being adopted in the industrial sector for quality control and automation. The likes of Honeywell and Abbott are ahead in the development of the field, investing heavily in R&D to obtain greater precision and efficiency. Chemical and biological threat detection for defense is yet another key area for growth. Government policies further enhance the dynamics of the market in favor of nanotechnology innovation. The U.S. is also a major exporter of nanosensor technologies, gradually influencing the international market through global partnerships.
Europe Nanosensors Market Analysis
The nanosensors market in Europe is growing at a fast pace due to the huge investments being made in healthcare, environmental monitoring, and industrial automation. In nanotechnology research, the Horizon Europe program has given investments of more than EUR 1 billion (USD 1.04 Billion) in 2023, creating an environment for innovation in respect of nanosensors, according to the European Commission. Germany and France are leading in industrial applications that utilize nanosensors for precision manufacturing and smart materials. Companies like Siemens and Roche are developing technologies to integrate nanosensors into medical devices. Outdoor environmental monitoring is also seeing wider applications for nanosensors in air and water quality evaluation in compliance with EU legislation. Anti-sustainability and safety policies ensure that green nanotechnology is innovating steadily and that Europe is an important player in nanosensors development.
Asia Pacific Nanosensors Market Analysis
The Asia Pacific nanosensors market is growing because of rising investments in sophisticated sensor technologies. As per the Technology Development Board (TDB) of India's Department of Science and Technology, in August 2022, INR 3.29 crore (around USD 400,000) of financial support was sanctioned for Multi Nano Sense Technologies Pvt Ltd, a Maharashtra-based firm. This financing funds the native production of hydrogen analysis and sensing technology, lowering dependency on foreign sensors and enhancing the capability of India in hydrogen sensing. China and Japan are also pushing nanosensor research hard, with state-supported projects pushing innovation in health, environmental detection, and manufacturing applications. Increased partnerships between institutions of learning and private sector participants further drive development, making the region a central hotspot for nanosensor research.
Latin America Nanosensors Market Analysis
The progress of Latin America's nanosensors market is steady, with government investments and research initiatives playing a supporting role. The Brazilian Ministry for Science, Technology, Innovation, and Communication (MCTIC) reports that, within the last 15 years, more than R$600 million (approximately USD 120 million) has been injected into nanotechnology research. The necessary capital has supported the sharp advances in nanosensor applications in areas like healthcare, agriculture, and industrial monitoring systems. Brazil is the principal country in that field with relevant research centers dedicated to nanoscale sensor technologies for medical diagnostics, environmental monitoring, and food safety. In addition to Brazil, countries like Mexico and Argentina are also investing in nanotechnology and encouraging collaborations between academic institutions and private industries. Increasing demand for nanosensors by different end-users such as water quality assessment and air pollution control is further driving market growth. Latin America is set to be a major player in nanosensor innovation and commercialization.
Middle East and Africa Nanosensors Market Analysis
The Middle East and Africa nanosensors market is picking up pace with national investments in cutting-edge technology. Saudi Arabia has pledged USD 266 million to nanotechnology in partnership with India's MIL as part of its Vision 2030 strategy to promote innovation and industrial development, as per an industrial report. The investment is aimed at incorporating nanosensors into healthcare, energy, and environmental monitoring applications. The UAE and Israel are also developing nanosensor research, with government-sponsored projects driving the development of intelligent sensing solutions for defense, agriculture, and water management. Africa is slowly embracing nanotechnology, with South Africa at the forefront of research activities through institutions such as Mintek and the Council for Scientific and Industrial Research (CSIR). Growing collaborations between regional governments and international nanotech companies are driving regional adoption. With a concerted thrust towards self-reliance and technological prowess, the Middle East and Africa are set to emerge as important contenders in the world nanosensors market.
Competitive Landscape:
The nanosensors market is highly competitive, with key players focusing on technological advancements, strategic partnerships, and product innovation to strengthen their market position. Major companies, including Honeywell International Inc., Texas Instruments Incorporated, and IBM Corporation, are investing in research and development to enhance sensor sensitivity, miniaturization, and integration with IoT and AI. Startups and academic institutions are driving innovation, particularly in biomedical and environmental applications. Mergers, acquisitions, and collaborations are shaping the competitive landscape, as firms seek to expand product portfolios and global reach. For instance, in January 2025, ABB and Agilent Technologies partnered to enhance laboratory automation, combining technologies to improve processes in sectors like pharma and food, building on ABB’s previous collaboration with METTLER TOLEDO. Regulatory compliance, intellectual property, and manufacturing scalability remain critical factors influencing market competitiveness and growth.
The report provides a comprehensive analysis of the competitive landscape in the nanosensors market with detailed profiles of all major companies, including:
- Agilent Technologies Inc
- Altair Nanotechnologies Inc
- Analog Devices Inc
- Biosensors International Group Ltd
- Honeywell International Inc.
- Kleindiek Nanotechnik GmbH
- Lockheed Martin Corporation
- OMRON Corporation
- Oxonica Limited
- Texas Instruments Incorporated
Latest News and Developments:
- December 2024: In Japan, Okayama University researchers have manufactured nanodiamond-based sensors with superior brightness and spin features, much like bulk diamonds. This discovery creates a potential field of applications in bioimaging and beyond.
- September 2024: The Centre for Nano and Soft Matter Sciences (CeNS), Bengaluru, has developed a high-end gas sensor for low concentration nitrogen oxide detection at room temperature. This technology sets to overcome challenges in low-concentration pollutant detection and will contribute towards air quality assessment in urban and industrial environments.
- April 2024: The Indian Institute of Technology Jodhpur recently launched a nano-sensor capable of determining the presence of cytokines, which are pivotal proteins in disease progression, with speed. This innovation looks to come in handy in lowering mortality when a diagnosis is delayed.
Nanosensors Market Report Scope:
| Report Features | Details |
|---|---|
| Base Year of the Analysis | 2025 |
| Historical Period | 2020-2025 |
| Forecast Period | 2026-2034 |
| Units | Million USD |
| Scope of the Report |
Exploration of Historical Trends and Market Outlook, Industry Catalysts and Challenges, Segment-Wise Historical and Future Market Assessment:
|
| Types Covered | Optical Nanosensor, Chemical, Nanosensor, Physical Nanosensor, Biosensor, Others |
| Technologies Covered | Molecular Self Assembly, Top-down Assembly, Bottom-up Assembly |
| Applications Covered | Electronics, Chemical Manufacturing, Energy, Aerospace and Defense, Healthcare, Others |
| Regions Covered | Asia Pacific, Europe, North America, Latin America, Middle East and Africa |
| Countries Covered | United States, Canada, Germany, France, United Kingdom, Italy, Spain, Russia, China, Japan, India, South Korea, Australia, Indonesia, Brazil, Mexico |
| Companies Covered | Agilent Technologies Inc., Altair Nanotechnologies Inc., Analog Devices Inc., Biosensors International Group Ltd., Honeywell International Inc., Kleindiek Nanotechnik GmbH, Lockheed Martin Corporation, OMRON Corporation, Oxonica Limited, Texas Instruments Incorporated, etc. |
| Customization Scope | 10% Free Customization |
| Post-Sale Analyst Support | 10-12 Weeks |
| Delivery Format | PDF and Excel through Email (We can also provide the editable version of the report in PPT/Word format on special request) |
Key Benefits for Stakeholders:
- IMARC’s report offers a comprehensive quantitative analysis of various market segments, historical and current market trends, market forecasts, and dynamics of the nanosensors market from 2020-2034.
- The research study provides the latest information on the market drivers, challenges, and opportunities in the global nanosensors market.
- The study maps the leading, as well as the fastest-growing, regional markets. It further enables stakeholders to identify the key country-level markets within each region.
- Porter's Five Forces analysis assists stakeholders in assessing the impact of new entrants, competitive rivalry, supplier power, buyer power, and the threat of substitution. It helps stakeholders to analyze the level of competition within the nanosensors industry and its attractiveness.
- Competitive landscape allows stakeholders to understand their competitive environment and provides an insight into the current positions of key players in the market.
Frequently Asked Questions About the Nanosensors Market Report
The nanosensors market was valued at USD 1,021.8 Million in 2025.
IMARC estimates the nanosensors market to reach USD 1,963.0 Million by 2034, exhibiting a CAGR of 7.30% during 2026-2034.
Key factors driving the nanosensors market include the increasing demand for precision healthcare, early disease detection, and real-time monitoring. Advancements in nanotechnology, miniaturization, and integration with AI enhance sensor capabilities. Additionally, rising applications in environmental monitoring, food safety, and industrial automation further fuel market growth and adoption.
North America currently dominates the market with 33.7% share. This dominance is driven by substantial investments in research and development, a strong healthcare infrastructure, and increased adoption of advanced technologies across industries like healthcare, automotive, and manufacturing, ensuring continued market growth in the region.
Some of the major players in the nanosensors market include Agilent Technologies Inc., Altair Nanotechnologies Inc., Analog Devices Inc., Biosensors International Group Ltd., Honeywell International Inc., Kleindiek Nanotechnik GmbH, Lockheed Martin Corporation, OMRON Corporation, Oxonica Limited and Texas Instruments Incorporated, etc.
Need more help?
- Speak to our experienced analysts for insights on the current market scenarios.
- Include additional segments and countries to customize the report as per your requirement.
- Gain an unparalleled competitive advantage in your domain by understanding how to utilize the report and positively impacting your operations and revenue.
- For further assistance, please connect with our analysts.
 Request Customization
 Speak to an Analyst
 Request Brochure
 Inquire Before Buying
Benefits of Customization
- Personalize this research
- Triangulate with your data
- Get data as per your format and definition
- Gain a deeper dive into a specific application, geography, customer, or competitor
- Any level of personalization
Get in Touch With Us
UNITED STATES
Phone: +1-201-971-6302
INDIA
Phone: +91-120-433-0800
UNITED KINGDOM
Phone: +44-753-714-6104
Email: [email protected]
Client Testimonials


.webp)


