Green Ammonia Price Update: Sustained Growth Across Key Markets in Q1 2026
20-Aug-2025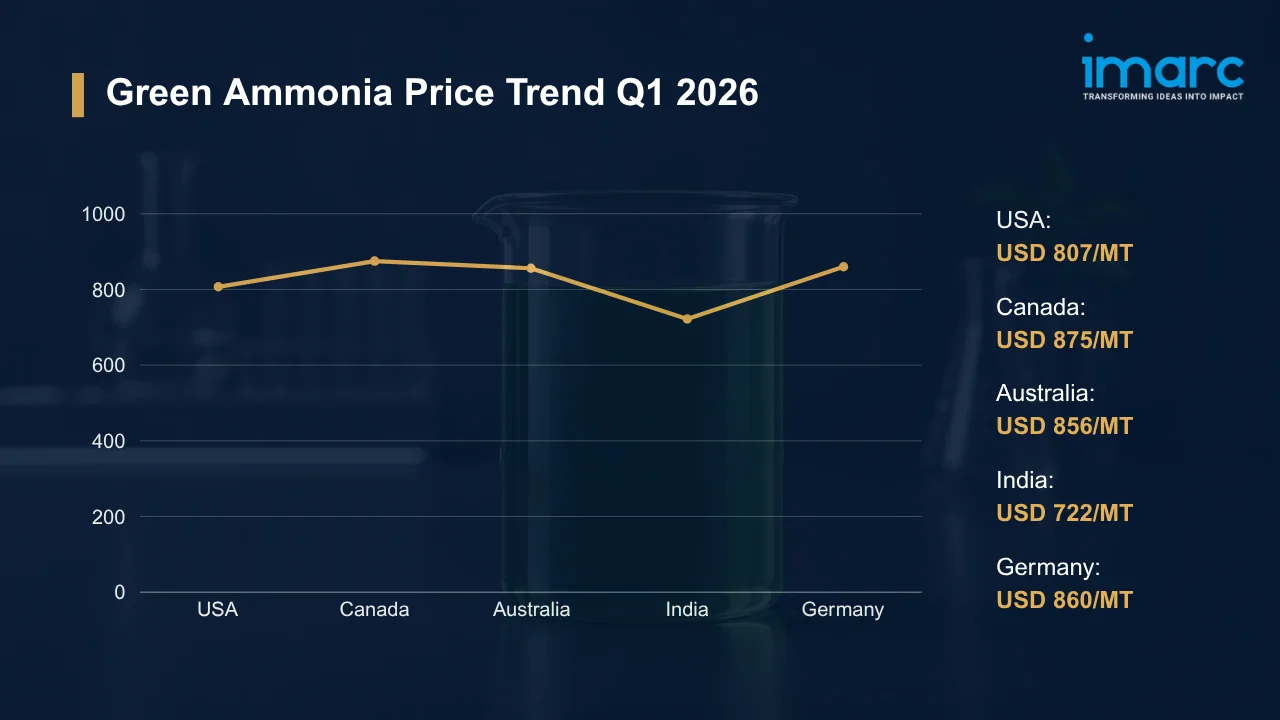
Green ammonia is a zero-carbon nitrogen compound produced by coupling water electrolysis with renewable power, then feeding the resulting hydrogen into the Haber-Bosch synthesis loop. Fertilizer manufacturing, maritime bunkering, and hard-to-abate industrial processes each draw on it as a low-emission feedstock. Green ammonia prices move in step with renewable electricity tariffs, electrolyzer procurement costs, water desalination expenditure at arid production sites, and the rate at which fertilizer and shipping operators can absorb the premium over conventional grey ammonia.
Global Market Overview:
Globally, the green ammonia industry was valued at USD 722.03 Million in 2025. Market projections indicate steady growth, with the industry expected to reach USD 46,630.78 Million by 2034, with a compound annual growth rate (CAGR) of 58.90% during 2026-2034. Statutory decarbonization targets for nitrogen fertilizers, zero-emission shipping bunkering regulations, and scaled electrolyzer deployment are the core forces extending the green ammonia price trend upward, with improving power purchase agreement economics gradually narrowing the cost gap against fossil-based alternatives.
Green Ammonia Price Trend Q1 2026:
Regional prices (USD per MT) and QoQ changes Q1 2026 vs Q4 2025:
| Region | Price (USD/MT) | QoQ Change | Direction |
|---|---|---|---|
| USA | 807 | +3.22% | ↑ |
| Canada | 875 | +2.02% | ↑ |
| Australia | 856 | +2.83% | ↑ |
| India | 722 | +2.11% | ↑ |
| Germany | 860 | +3.98% | ↑ |
To access real-time prices Request Sample
What Moved Prices:
USA:
- At USD 807/MT in Q1 2026, US prices rose 3.22% QoQ as clean-fuel project developers and hydrogen-linked industrial operators stepped up procurement volumes. Commissioning timelines at large-scale electrolytic facilities lagged demand, keeping available supply narrow. Buyers seeking supply certainty locked in term contracts early, adding upward pressure through the period.
- Domestic clean-energy incentive frameworks sustained buyer confidence, while logistics costs from inland renewable generation hubs to coastal distribution terminals kept delivered costs elevated. The green ammonia price chart traced a consistent upward path through the quarter, reflecting the structural gap between production capacity and rising offtake commitments from decarbonization-linked end users.
Canada:
- Canada recorded the highest regional price at USD 875/MT in Q1 2026, a 2.02% QoQ advance driven by export-linked clean fuel programs and structured hydrogen supply chains serving industrial buyers. Domestic production infrastructure remained limited, and early-stage project timelines restricted output volumes against growing procurement demand through the period.
- Freight premiums from western production sites to export terminals sustained cost markups on delivered pricing. Structured contract negotiations between producers and industrial end users shaped sourcing patterns, with buyers aligning procurement cycles to pilot-scale facility output. Upward price momentum persisted as infrastructure investment timelines stretched beyond near-term supply requirements.
Australia:
- In the first quarter of 2026, green ammonia prices in Australia rose to USD 856/MT, up 2.83% QoQ, as export-linked demand from Asian and European buyers supported sustained price floors. New renewable-hydrogen projects remained in ramp-up phases, keeping total available supply below the level required to ease upward pricing pressure across contracted and spot trade flows.
- Export-oriented transactions dominated volume flows during the period. Buyers maintained conservative inventory positions, wary of supply-side uncertainty from developing facilities. Grid transmission costs from remote solar and wind generation zones to coastal shipping terminals contributed persistent cost premiums, preventing price softening even as longer-term project pipelines signaled future capacity growth.
India:
- In Q1 2026, green ammonia prices in India advanced to USD 722/MT, a 2.11% QoQ gain, propelled by fertilizer sector procurement growth and widening industrial demand. Supply conditions stayed tight, with domestic electrolytic capacity still limited and most volumes sourced through imports. Port gateway operations and inland logistics to consumption clusters added measurable cost premiums above the landed import price.
- Production-linked support schemes and government auction mechanisms reinforced market confidence and drew further investment into domestic electrolyzer deployment programs. Procurement behavior remained disciplined, with buyers favoring structured agreements over spot purchases. Gradual renewable energy integration into regional power grids continued to ease longer-term production cost trajectories without materially affecting near-term pricing levels.
Germany:
- During Q1 2026, green ammonia prices in Germany climbed to USD 860/MT, a 3.98% QoQ increase, supported by firm procurement from industrial decarbonization programs and the chemical sector. Import reliance remained high, as domestic production infrastructure was still in early development phases; supply availability depended entirely on external sourcing and associated shipping cost conditions.
- Carbon compliance frameworks and EU renewable fuel certification requirements imposed additional procurement cost layers on industrial buyers. Long-term import agreements with producing-country counterparts shaped contracting behavior across the quarter. Evolving EU regulatory timelines for industrial conversion commitments set the pace of offtake growth, sustaining price levels above those recorded in the prior quarter.
Drivers Influencing the Market:
Several factors continue to shape green ammonia pricing and market behavior:
- Fertilizer and Clean Energy Sector Demand: Agricultural nitrogen requirements and low-carbon fertilizer mandates in major food-producing economies generate the baseline procurement volumes underpinning green ammonia market activity. Urbanization-linked food output growth sustains long-run demand expansion, while seasonal crop cycles introduce variability in quarterly offtake patterns. Decarbonization commitments from nitrogen fertilizer producers transitioning away from grey ammonia feedstocks are broadening the buyer base and deepening market depth across importing regions.
- Renewable Energy and Electrolyzer Production Costs: At the facility level, renewable electricity tariffs account for the single largest share of green ammonia production costs, making power purchase agreement terms the primary determinant of producer economics. Electrolyzer capital costs, stack degradation rates, and capacity utilization further influence breakeven thresholds. Per the IEA Global Hydrogen Review 2025, low-emissions hydrogen output from projects at or approaching final investment decision is projected to surpass 4 Million Metric Tons per year by 2030, with cost competitiveness narrowing as solar and wind power procurement costs continue their multi-year decline across key producing regions.
- Water Availability and Electrolysis Feedstock Conditions: Electrolysis consumes significant volumes of demineralized water; at coastal or arid sites, desalination becomes a non-trivial cost input. Water procurement constraints in water-scarce producing geographies compress production margins and elevate output costs above those of facilities with ready freshwater access. Seasonal freshwater variability introduces quarterly cost swings that ripple through the green ammonia price index for producing nations reliant on surface water rather than desalinated supply chains.
- Ocean Freight and Logistics Economics: Cryogenic tanker availability, port terminal handling capabilities, and prevailing spot ocean freight rates all feed directly into landed ammonia costs at import terminals. Long-haul shipping from Australian, Middle Eastern, and North American production hubs to European and Asian buyers carries material freight premiums relative to fossil-fuel ammonia trade lanes. Drewry's World Container Index surged 23% to USD 3,433 per 40ft container in the first week of June 2026, driven by early peak-season demand across Transpacific and Asia-Europe corridors, indicating a broader tightening in maritime logistics that increases delivered costs for chemical cargo shippers.
- Environmental and Regulatory Compliance: Certification obligations under the EU Renewable Fuels of Non-Biological Origin (RFNBO) framework require producers to document full lifecycle renewable energy sourcing, adding auditing and reporting costs that pass through to market pricing. National green hydrogen definitions in key import markets diverge on additionality, temporal correlation, and geographic requirements, creating compliance complexity for cross-border supply chains. Producers unable to meet the most stringent certification thresholds face reduced access to premium-priced off-take contracts.
- Trade Policy and Currency Dynamics: Bilateral clean energy trade agreements, import tariff structures, and the EU carbon border adjustment mechanism are reshaping origin preferences among industrial buyers, tilting procurement toward certified low-carbon sources. Currency depreciation in producing economies can compress USD-denominated production costs and support export competitiveness, whereas appreciation tightens margins. US clean energy incentive frameworks and evolving subsidy structures in producing nations continue altering the relative cost positions of competing supply origins across the Atlantic and Indo-Pacific trade corridors.
Recent Highlights & Strategic Developments:
Recent strategic moves within the industry further illustrate evolving dynamics:
- In March 2026, Reliance Industries Limited formalized a binding fifteen-year Supply and Purchase Agreement with Samsung C and T Corporation of South Korea for green ammonia deliveries commencing in the second half of FY2029, establishing one of the most consequential long-term low-carbon fuel trade commitments by an Indian industrial conglomerate.
- In June 2025, Solar Energy Corporation of India Limited (SECI), a Navratna Central Public Sector Undertaking under the Ministry of New and Renewable Energy, issued a green ammonia offtake tender, formalizing government-backed procurement as a mechanism to accelerate domestic fertilizer sector decarbonization and green hydrogen program scale-up.
Outlook & Strategic Takeaways:
Looking ahead, the green ammonia market is expected to sustain its high-growth trajectory through 2034, backed by mandatory nitrogen fertilizer decarbonization programs, expanding zero-emission maritime bunkering demand, and scaled electrolyzer infrastructure investments across North America, Europe, and the Asia-Pacific. Renewable electricity cost trajectories and certification framework consolidation will remain the central variables governing the green ammonia price forecast across producing and importing geographies over the medium-term horizon.
To navigate this complex landscape, stakeholders should:
- Assess Freight Market Developments: Track cryogenic tanker availability and spot ocean freight rate movements on primary ammonia trade corridors to anticipate delivered cost shifts. Negotiate logistics contracts with adjustment clauses indexed to Baltic Exchange or comparable freight benchmarks to limit exposure during rate spikes.
- Evaluate Downstream Demand Indicators: Track fertilizer-sector order books, maritime bunkering adoption timelines, and industrial conversion schedules across principal consumption regions. Correlate those signals with procurement planning to avoid overstocking when project-linked supply additions reach the market.
- Review Regulatory Compliance Expenditures: Audit certification, documentation, and reporting costs tied to RFNBO requirements and national green hydrogen standards across target import markets. Prioritize supplier relationships with pre-certified facilities to reduce compliance overhead and shorten contract execution timelines.
- Monitor Regional Price Differentials: Track quarterly sourcing variations across key supply origins, benchmarking green ammonia price per MT against landed cost targets to pinpoint procurement windows. Build comparison protocols that incorporate freight, certification, and terminal handling premiums for accurate total-cost sourcing decisions.
- Strengthen Currency Exposure Management: Implement hedging instruments for procurement denominated in producer-country currencies to stabilize landed cost projections across quarterly buying cycles. Align treasury and procurement functions so that foreign exchange coverage windows match anticipated import payment schedules.
- Explore Emerging Application Segments: Investigate green ammonia's commercial viability in power generation peaking, direct-reduced iron steelmaking, and synthetic fuel production as those pathways move beyond pilot scale. Engage with technology consortia and offtake aggregators to assess portfolio diversification potential in application segments that may materially expand addressable demand by 2030.
Subscription Plans & Customization:
IMARC offers flexible subscription models to suit varying needs:
- Monthly Updates - 12 deliverables/year
- Quarterly Updates - 4 deliverables/year
- Biannual Updates - 2 deliverables/year
Each includes detailed datasets (Excel + PDF) and post-report analyst support.

Get in Touch With Us
UNITED STATES
Phone: +1-201-971-6302
INDIA
Phone: +91-120-433-0800
UNITED KINGDOM
Phone: +44-753-714-6104
Email: [email protected]
Client Testimonials


.webp)


