Stainless Steel Ingot Prices Outlook Q2 2026: Latest Global Trends, Price Charts, and Forecast Analysis
06-Aug-2026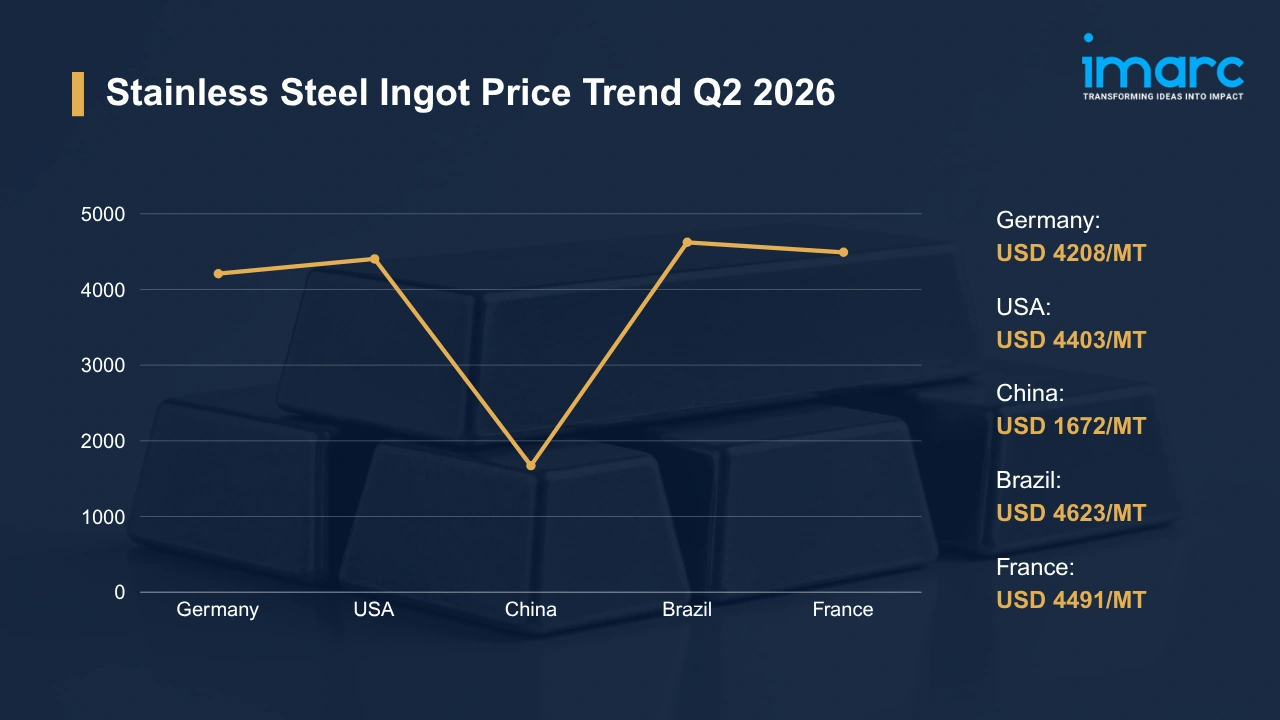
Stainless steel ingot is a semi-finished metallic product manufactured by melting iron with controlled chromium, nickel, and molybdenum additions to achieve high resistance to corrosion, oxidation, and heat in demanding industrial conditions. In the automotive, construction, and chemical processing industries, the need for the material remains steady. Stainless steel ingot prices are shaped primarily by upstream nickel and chromium feedstock costs, electric arc furnace energy expenditure, ocean freight logistics, and demand cycles within key end-use manufacturing segments.
Global Market Overview:
Globally, the stainless steel ingot industry reached a volume of 3.5 Million Tons in 2025. Market projections indicate steady growth, with the industry expected to reach a volume of 4.8 Million Tons by 2034, with a compound annual growth rate (CAGR) of 3.43% during 2026-2034. Across the automotive and construction sectors, sustained output expansion reinforces the stainless steel ingot price trend. Specialty alloy demand grows, with chemical processing and offshore energy applications further broadening the market’s consumption base.
Stainless Steel Ingot Price Trend Q2 2026:
Regional prices (USD per MT) and QoQ changes Q2 2026 vs Q1 2026:
| Region | Price (USD/MT) | QoQ Change | Direction |
|---|---|---|---|
| Germany | 4208 | -1.80% | ↓ |
| USA | 4403 | +1.80% | ↑ |
| China | 1672 | +1.28% | ↑ |
| Brazil | 4623 | -1.50% | ↓ |
| France | 4491 | -2.10% | ↓ |
To access real-time prices Request Sample
What Moved Prices:
Germany:
- In Q2 2026, stainless steel ingot prices in Germany declined to USD 4208/MT as procurement activity among downstream stainless steel mills stayed uneven and conversion demand showed weaker quarterly momentum across fabrication segments. Mill-level order books grew noticeably thinner. Pulling back from forward purchasing commitments, manufacturers reflected cautious industrial sentiment through the quarter.
- Imported material from Asian suppliers kept domestic pricing competitive. Stable logistics on key European import corridors maintained steady supply availability, limiting the ability of domestic mills to recover price floors established in Q1 2026. Across the quarter, the stainless steel ingot price chart reflected consistent downward pressure.
USA:
- In Q2 2026, stainless steel ingot prices in the USA climbed to USD 4403/MT, underpinned by steady demand from industrial fabrication sectors and infrastructure-linked manufacturing programs that maintained consistent material requirements. Domestic mill order books remained firm. Controlling production output carefully, producers sustained price floors and limited exposure to excess supply throughout the quarter.
- Import competition remained present but posed limited disruption to domestic pricing, partly due to logistical constraints and industrial buyers’ preference for local supply chains with shorter lead times. At major fabricators, procurement teams aligned purchasing schedules with production needs. This discipline supported stable order inflows for US-origin material through the period.
China:
- During Q2 2026, stainless steel ingot prices in China rose to USD 1672/MT, supported by improved domestic manufacturing activity and a gradual recovery in downstream stainless steel consumption across key industrial hubs. Producer output strategies were adjusted carefully. Calibrating production levels to match consumption trends, mills stabilized market expectations and supported modest price gains through the period.
- Export competitiveness from Chinese suppliers remained strong, contributing to sustained material movement into international markets through the quarter. Adding to this, domestic FMCG and industrial appliance demand provided baseline consumption support, while regional converter activity in manufacturing hubs like Guangdong continued to absorb output. Chinese currency stability reinforced balanced pricing.
Brazil:
- In Q2 2026, stainless steel ingot prices in Brazil retreated to USD 4623/MT amid fluctuating industrial demand and competitive import flows that weighed on domestic pricing power throughout the period. Procurement from construction and heavy manufacturing stayed inconsistent. Softening order inflows from these sectors reduced local producers’ ability to sustain the price levels maintained in Q1.
- Competitive supply from international origins added further downward pressure, with Brazilian importers benefiting from exchange-rate conditions that made offshore procurement attractive relative to domestic sourcing. Constrained by this dynamic, local producers faced limited pricing power. Through the quarter, BRL volatility introduced additional complexity for import-parity pricing negotiations, amplifying market uncertainty across the supply chain.
France:
- During Q2 2026, stainless steel ingot prices in France fell to USD 4491/MT under the influence of subdued industrial demand and stable import availability within the broader European supply network. French buyers maintained conservative procurement strategies. Focusing on short-term requirements, industrial users across key consuming sectors avoided forward stock building and reduced spot market activity.
- Limited expansion in manufacturing activity across France’s key consuming sectors left upward pricing momentum absent throughout the period. Maintaining competitive conditions, stable supply from intra-European distributors and Asian import channels reduced buyer urgency and allowed procurement managers to focus on short-term requirements rather than forward positioning. Spot market activity remained distinctly minimal.
Drivers Influencing the Market:
Several factors continue to shape stainless steel ingot pricing and market behavior:
- Automotive and Construction Sector Demand: Demand from automotive production and construction activity constitutes the dominant consumption base for stainless steel ingot globally. Tracing these demand cycles, procurement volumes shift with industrial output. Residential and commercial infrastructure buildout in emerging markets, alongside ongoing vehicle manufacturing in developed economies, sustains baseline end-use absorption and supports consistent quarterly demand. Tracked against these output indicators, the stainless steel ingot price index reflects upstream demand dynamics across producing regions.
- Nickel and Chromium Feedstock Cost Dynamics: Nickel and chromium are costliest among stainless alloy inputs. Per the International Nickel Study Group’s April 2026 report, global nickel output is forecast at 3.715 Million Tons in 2026, falling short of projected consumption of 3.747 Million Tons. Constrained supply conditions have elevated nickel price volatility, directly raising feedstock costs for ingot producers across melting and alloying stages.
- Energy Expenditure in Electric Arc Furnace Operations: Electricity is the primary energy input for electric arc furnace steelmaking, making power prices a direct determinant of production costs. European producers face higher power costs. Structurally, this gap limits competitive positioning for regional mills against lower-cost Asian origins.
- Ocean Freight and Logistics Economics: Container shipping rates on Asia-Europe and trans-Pacific corridors directly shape the landed cost of stainless steel ingot at destination ports, particularly for markets relying on Asian-origin supply. Through this mechanism, freight rate volatility affects import economics directly. Drewry’s World Container Index and carrier contract negotiations set the freight baseline that determines cost competitiveness across import-reliant markets, influencing procurement decisions between domestic and offshore sourcing options.
- Environmental and Regulatory Compliance: Tightening regulations on chromium and nickel compound handling, industrial emissions, and waste disposal raise compliance costs for stainless steel ingot producers across key jurisdictions, particularly in Europe and North America. These regulatory frameworks add to production overhead. Under REACH and analogous frameworks in Asian markets, registration and chemical safety obligations impose testing costs that progressively filter into market pricing, particularly for higher-purity alloy grades.
- Trade Policy and Currency Dynamics: Import tariffs and anti-dumping duties in major markets reshape the competitive landscape for stainless steel ingot by determining which origin materials reach buyers on economically viable terms. Through this dynamic, currency movements between USD, EUR, CNY, and BRL introduce additional pricing variability. FOB and CIF contract structures expose buyers to exchange rate risk, amplifying differentials between origin markets. Adding to this complexity, trade quota policies constrain market access in certain jurisdictions.
Recent Highlights & Strategic Developments:
Recent strategic moves within the industry further illustrate evolving dynamics:
- In May 2026, researchers at the University of Hong Kong unveiled SS-H2, a new stainless steel alloy employing a dual-protection corrosion mechanism designed to withstand the harsh conditions of seawater-based green hydrogen production. Led by Professor Mingxin Huang’s team, the development represented a significant materials advance for scaling seawater electrolysis infrastructure in clean energy applications.
Outlook & Strategic Takeaways:
Looking ahead, the stainless steel ingot market is expected to maintain gradual expansion through 2034, with the stainless steel ingot price forecast shaped most directly by upstream nickel and chromium feedstock cost trajectories, electric arc furnace energy dynamics, and trade policy normalization across key regions. Sustained automotive and construction sector demand, alongside rising specialty alloy applications in chemical processing and offshore energy infrastructure, will continue driving consistent material consumption globally through this horizon.
To navigate this complex landscape, stakeholders should:
- Monitor Regional Price Differentials: Track quarterly pricing variations across key supply regions to identify cost-saving procurement windows. Benchmarking the stainless steel ingot price per MT against prevailing contract rates will help procurement teams make optimal sourcing decisions.
- Assess Freight Market Developments: Monitor container shipping rate trends on Asia-Europe corridors to anticipate landed cost movements for import-reliant buyers. Negotiate logistics contracts with built-in rate adjustment mechanisms tied to prevailing benchmark indices to control import procurement costs.
- Evaluate Downstream Demand Indicators: Track automotive production output and construction activity indices across principal consumption regions to identify upcoming demand shifts. Align procurement schedules with these signals to optimize inventory positioning and avoid excess stock accumulation.
- Review Regulatory Compliance Expenditures: Audit compliance costs tied to chromium and nickel compound handling, emissions requirements, and waste discharge across all operating jurisdictions. Identify efficiencies that reduce regulatory burden without compromising chemical safety obligations under REACH and equivalent frameworks.
- Strengthen Currency Exposure Management: Implement hedging strategies for procurement in EUR, BRL, or CNY to stabilize cost projections against USD exchange rate movements. Align treasury coverage schedules with import payment timelines to reduce exposure on cross-border contracts.
- Explore Emerging Application Segments: Investigate growth potential in specialty alloy applications for seawater electrolysis and offshore energy structures as emerging demand pools. Engage with research partners to evaluate commercial viability of novel stainless steel grades that may broaden the addressable market.
Subscription Plans & Customization:
IMARC offers flexible subscription models to suit varying needs:
- Monthly Updates: 12 deliverables/year
- Quarterly Updates: 4 deliverables/year
- Biannual Updates: 2 deliverables/year
Each includes detailed datasets (Excel + PDF) and post-report analyst support.

Get in Touch With Us
UNITED STATES
Phone: +1-201-971-6302
INDIA
Phone: +91-120-433-0800
UNITED KINGDOM
Phone: +44-753-714-6104
Email: [email protected]
Client Testimonials




.webp)




.webp)












