
Nitrobenzene Prices, Trend, Chart, Demand, Market Analysis, News, Historical and Forecast Data Report 2026 Edition
Nitrobenzene Price Trend, Index and Forecast
Track real-time and historical nitrobenzene prices across global regions. Updated monthly with market insights, drivers, and forecasts.
Nitrobenzene Prices July 2026
| Region | Price (USD/KG) | Latest Movement |
|---|---|---|
| Northeast Asia | 1.66 | 6.4% ↑ Up |
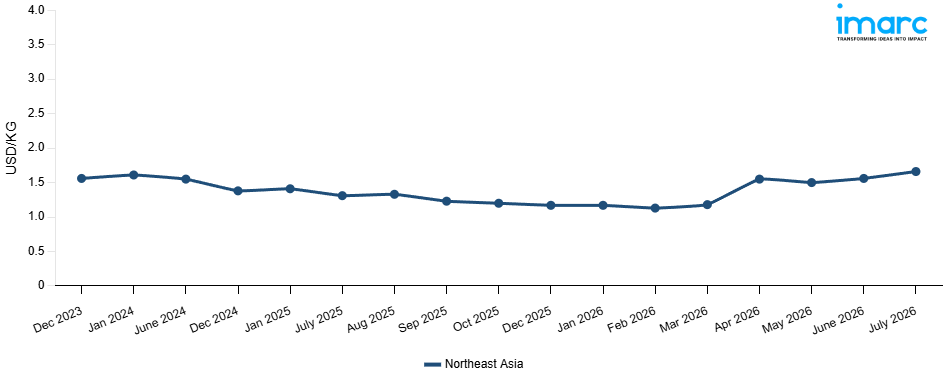
Nitrobenzene Price Index (USD/KG):
The chart below highlights monthly nitrobenzene prices across different regions.
Get Access to Monthly/Quarterly/Yearly Prices, Request Sample
Market Overview Q1 Ending March 2026
Northeast Asia: The nitrobenzene prices in Northeast Asia reached 1.18 USD/KG in March 2026. The upward pricing movement registered between December and March 2026 was 0.9%. Demand from aniline, polyurethane, and specialty chemicals production activities showed firmness, providing moderate procurement support and underpinning mildly bullish market conditions in Northeast Asia. Moderately high levels of upstream benzene and nitric acid costs in regional production plants contributed to a slight upward influence in regional nitrobenzene production costs, thereby supporting the prevailing moderate upward price movement. Consistent import vessel availability from major supply origin countries maintained robust supply conditions, limiting upward price pressures during the period. Moderate levels of restocking in regional aniline and dye intermediate production underpinned mildly bullish market conditions during the period.
Market Overview Q4 Ending December 2025
Northeast Asia: The nitrobenzene prices in Northeast Asia reached 1.17 USD/KG in December 2025. The downward pricing movement registered between September and December 2025 was 4.7%. Amid muted consumption in the polyurethane and rubber processing industries across the region, procurement volumes were restrained by weak downstream demand from the aniline and MDI (methylene diphenyl diisocyanate) production sectors, which was the main driver of the price reduction. Baseline pricing benchmarks were diminished as production cost support for regional producers was further undermined by declining upstream benzene feedstock costs. While excess manufacturing capacity increased supply side pressure, high inventory levels among large manufacturers exacerbated competitive pricing strategies to speed up stock clearing. Bearish pricing conditions persisted throughout the quarter due to cautious downstream consumer procurement strategies anticipating further market softening, cautious export inquiries from traditional trading partners, and limited offtake support.
Market Overview Q3 Ending September 2025
Northeast Asia: The decrease was primarily driven by softening demand in major industrial sectors such as rubber processing and aniline derivatives manufacturing. On the supply side, stable domestic production in China and Japan along with improved logistics efficiency, including lower port handling charges and smoother customs clearance contributed to alleviating cost pressures. Additionally, currency fluctuations, particularly a slight strengthening of the Japanese Yen against the US Dollar, moderated import-related cost volatility. International shipping rates for chemical bulk carriers saw minor adjustments, which slightly impacted landed costs but did not offset the broader downward trend. The market also experienced temporary inventory buildup in key ports, which further pressured spot prices.
Nitrobenzene Price Trend, Market Analysis, and News
IMARC's latest publication, “Nitrobenzene Prices, Trend, Chart, Demand, Market Analysis, News, Historical and Forecast Data Report 2026 Edition,” presents a detailed examination of the nitrobenzene market, providing insights into both global and regional trends that are shaping prices. This report delves into the spot price of nitrobenzene at major ports and analyzes the composition of prices, including FOB and CIF terms. It also presents detailed nitrobenzene prices trend analysis by region, covering North America, Europe, Asia Pacific, Latin America, and Middle East and Africa. The factors affecting nitrobenzene pricing, such as the dynamics of supply and demand, geopolitical influences, and sector-specific developments, are thoroughly explored. This comprehensive report helps stakeholders stay informed with the latest market news, regulatory updates, and technological progress, facilitating informed strategic decision-making and forecasting.
Nitrobenzene Industry Analysis
The global nitrobenzene industry size reached USD 13.2 Billion in 2025. By 2034, IMARC Group expects the market to reach USD 20.8 Billion, at a projected CAGR of 5.02% during 2026-2034. The market is driven by the industrial demand for aniline derivatives, expansion in rubber and dye manufacturing, growth in chemical intermediates markets, and increasing application in specialty chemicals.
Latest developments in the Nitrobenzene Industry:
- June 2025: Researchers investigated the photocatalytic reduction of nitrobenzene using a CdS/MOF photocatalyst, achieving selective formation of aniline, azoxybenzene, and azobenzene. The catalyst remained reusable over multiple cycles.
- October 2023: Sadhana Nitro Chem Ltd got the approval from Maharashtra Pollution Control Board to manufacture paracetamol para-aminophenol (pAP) from nitrobenzene.
- September 2023: Prime Minister of India, Narendra Modi, laid the foundation stone of the downstream petrochemical complex and refinery expansion project at Bina Refinery of Madhya Pradesh, operated by a state-run oil marketing company. The facility will manufacture nitrobenzene along with several other chemicals, which are essential for end-use sectors.
Product Description
Nitrobenzene (C6H5NO2) is a yellow-colored oily liquid with a characteristic almond odor. It dissolves slightly in water and often evaporates into the air. It is sparsely soluble in carbon tetrachloride and highly soluble in ethanol, diethyl ether, acetone, and benzene. It is chemically a nitroarene consisting of benzene carrying a single nitro substituent. It undergoes nitration, halogenation, and sulfonation slowly compared to benzene. It can be reduced to a wide variety of compounds depending on the reaction procedure. It is widely utilized for the production of aniline, which is a chemical used for the production of polyurethane. It is also employed for the production of lubricating oils and dyes, which are used for the proper functioning of vehicles. It is often considered as an essential component or a mild oxidizing agent in the production of fuchsin and quinoline.
Report Coverage
| Key Attributes | Details |
|---|---|
| Product Name | Nitrobenzene |
| Report Features | Exploration of Historical Trends and Market Outlook, Industry Demand, Industry Supply, Gap Analysis, Challenges, Nitrobenzene Price Analysis, and Segment-Wise Assessment. |
| Currency/Units | US$ (Data can also be provided in local currency) or Metric Tons |
| Region/Countries Covered | The current coverage includes analysis at the global and regional levels only. Based on your requirements, we can also customize the report and provide specific information for the following countries: Asia Pacific: China, India, Indonesia, Pakistan, Bangladesh, Japan, Philippines, Vietnam, Thailand, South Korea, Malaysia, Nepal, Taiwan, Sri Lanka, Hongkong, Singapore, Australia, New Zealand Europe: Germany, France, United Kingdom, Italy, Spain, Russia, Turkey, Netherlands, Poland, Sweden, Belgium, Austria, Ireland, Switzerland, Norway, Denmark, Romania, Finland, Czech Republic, Portugal, Greece North America: United States, Canada Latin America: Brazil, Mexico, Argentina, Columbia, Chile, Ecuador, Peru Middle East & Africa: Saudi Arabia, UAE, Israel, Iran, South Africa, Nigeria, Oman, Kuwait, Qatar, Iraq, Egypt, Algeria, Morocco The list of countries presented is not exhaustive. Information on additional countries can be provided if required by the client. |
| Information Covered for Key Suppliers |
|
| Customization Scope | The report can be customized as per the requirements of the customer |
| Report Price and Purchase Option |
Plan A: Monthly Updates - Annual Subscription
Plan B: Quarterly Updates - Annual Subscription
Plan C: Biannually Updates - Annual Subscription
|
| Post-Sale Analyst Support | 360-degree analyst support after report delivery |
| Delivery Format | PDF and Excel through email (We can also provide the editable version of the report in PPT/Word format on special request) |
Key Benefits for Stakeholders:
- IMARC’s report presents a detailed analysis of nitrobenzene pricing, covering global and regional trends, spot prices at key ports, and a breakdown of FOB and CIF prices.
- The study examines factors affecting nitrobenzene price trend, including input costs, supply-demand shifts, and geopolitical impacts, offering insights for informed decision-making.
- The competitive landscape review equips stakeholders with crucial insights into the latest market news, regulatory changes, and technological advancements, ensuring a well-rounded, strategic overview for forecasting and planning.
- IMARC offers various subscription options, including monthly, quarterly, and biannual updates, allowing clients to stay informed with the latest market trends, ongoing developments, and comprehensive market insights. The nitrobenzene price charts ensure our clients remain at the forefront of the industry.
Frequently Asked Questions About the Nitrobenzene Price Trend Report
The nitrobenzene price in July 2026 was 1.66 USD/Kg in Northeast Asia.
The nitrobenzene pricing data is updated on a monthly basis.
We provide the pricing data primarily in the form of an Excel sheet and a PDF.
Yes, our report includes a forecast for nitrobenzene prices.
The regions covered include North America, Europe, Asia Pacific, Middle East, and Latin America. Countries can be customized based on the request (additional charges may be applicable).
Yes, we provide both FOB and CIF prices in our report.
Need more help?
- Speak to our experienced analysts for insights on the current market scenarios.
- Include additional segments and countries to customize the report as per your requirement.
- Gain an unparalleled competitive advantage in your domain by understanding how to utilize the report and positively impacting your operations and revenue.
- For further assistance, please connect with our analysts.
 Request Customization
 Inquire Before Buying
 Speak to an Analyst
 Request Brochure
Benefits of Customization
- Personalize this research
- Triangulate with your data
- Get data as per your format and definition
- Gain a deeper dive into a specific application, geography, customer, or competitor
- Any level of personalization
Get in Touch With Us
UNITED STATES
Phone: +1-201-971-6302
INDIA
Phone: +91-120-433-0800
UNITED KINGDOM
Phone: +44-753-714-6104
Email: [email protected]
Client Testimonials


.webp)


Why Choose Us
IMARC offers trustworthy, data-centric insights into commodity pricing and evolving market trends, enabling businesses to make well-informed decisions in areas such as procurement, strategic planning, and investments. With in-depth knowledge spanning more than 1000 commodities and a vast global presence in over 150 countries, we provide tailored, actionable intelligence designed to meet the specific needs of diverse industries and markets.
1000
+Commodities
150
+Countries Covered
3000
+Clients
20
+Industry
Robust Methodologies & Extensive Resources
IMARC delivers precise commodity pricing insights using proven methodologies and a wealth of data to support strategic decision-making.
Subscription-Based Databases
Our extensive databases provide detailed commodity pricing, import-export trade statistics, and shipment-level tracking for comprehensive market analysis.
Primary Research-Driven Insights
Through direct supplier surveys and expert interviews, we gather real-time market data to enhance pricing accuracy and trend forecasting.
Extensive Secondary Research
We analyze industry reports, trade publications, and market studies to offer tailored intelligence and actionable commodity market insights.
Trusted by 3000+ industry leaders worldwide to drive data-backed decisions. From global manufacturers to government agencies, our clients rely on us for accurate pricing, deep market intelligence, and forward-looking insights.