
North America Bioherbicides Market Size, Share, Trends and Forecast by Crop Type, Source, Application, Mode of Action, Formulation, and Country, 2026-2034
North America Bioherbicides Market Size and Share:
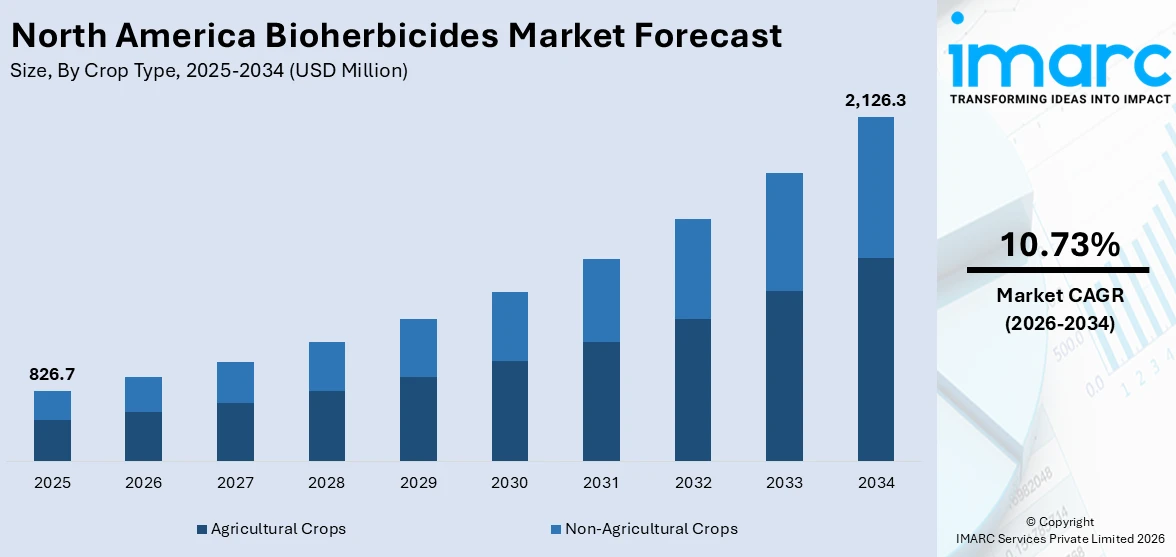
The North America bioherbicides market size was valued at USD 826.7 Million in 2025. Looking forward, IMARC Group estimates the market to reach USD 2,126.3 Million by 2034, exhibiting a CAGR of 10.73% from 2026-2034. The rising demand for organic farming, stringent regulations on synthetic herbicides, and increasing awareness of environmental sustainability are some of the key factors boosting the North America bioherbicides market share. Besides this, advancements in microbial-based bioherbicides, growing consumer preference for chemical-free food, and government support for eco-friendly agricultural practices further boost market growth.
|
Report Attribute
|
Key Statistics
|
|---|---|
|
Base Year
|
2025
|
|
Forecast Years
|
2026-2034
|
|
Historical Years
|
2020-2025
|
|
Market Size in 2025
|
USD 826.7 Million |
|
Market Forecast in 2034
|
USD 2,126.3 Million |
| Market Growth Rate (2026-2034) | 10.73% |
Organic farming is becoming increasingly popular in North America, which is driving the market for bioherbicides. With growing concern for food safety and environmental sustainability, demand for organic produce continues to grow. Bioherbicides are a safe alternative to synthetic herbicides because they are derived from natural organisms, such as bacteria, fungi, and plant extracts, and comply with organic farming standards. Government initiatives, for example, OCCSP, cover 75% of the reimbursement cost of obtaining certification for production. All of these, complemented by subsidization and certification, make them more inclined to adopt bioherbicides on their farms, while retailers are also shifting and giving importance to organic supply chain, which thus boosts the size of the market in North America.
To get more information on this market Request Sample
Regulation and restrictions on the use of synthetic herbicides throughout North America represent one of the main drivers in the bioherbicides market. The residues formed from chemical herbicides in the soil, damaging effects on the quality of the soil, and harmful health effects have limited the use of glyphosate and other synthetic weed control agents. With increasing pressure, the U.S. Environmental Protection Agency (EPA) and Canada’s Pest Management Regulatory Agency (PMRA) are reassessing chemical herbicides, prompting the agriculture and landscaping sectors to transition toward eco-friendly bioherbicides. With growing regulatory demands, bioherbicides are increasingly becoming an alternative for farmers and land managers to achieve sustainable weed control. Corporate sustainability initiatives and public advocacy for safer agricultural inputs are further reinforcing this shift.
North America Bioherbicides Market Trends:
Rising R&D investment for bioherbicide innovation
In North America, there is increasing investment in research and development toward improving bioherbicide efficiency and scope. Companies and institutions are trying to develop new strains of microorganisms and plant-derived formulations that combat a larger diversity of weeds and invasive species. Biotechnology development also leads to more accurate targets for weed elimination with minimum ecological impact. These innovations also span enhancing the stability and shelf-life of the bioherbicides so that they can be effective for more extended periods. Enhanced bioherbicide products can meet the changing needs of organic farmers, landscaping professionals, and large-scale agricultural operations, further fostering movement toward sustainable and natural approaches to weed management.
Shift to IPM Practices
A key trend in the North American bioherbicide market is the growing adoption of Integrated Pest Management (IPM) practices. IPM promotes the adoption of bioherbicides in a more integrated, holistic method of pest management. The incorporation of bioherbicides in cultural, mechanical, and biological control methods may help farmers shift away from the use of chemical herbicides and improve the efficacy of weed management. This technology fosters biodiversity, prevents herbicide resistance development, and ensures long-term soil health. The increase in consumers' preference for safe or green food further accelerates this trend. The more agricultural professionals embrace IPM, the more the use of bioherbicides is viewed as an essential component in green crop management and ecological farming.
Growing Consumer Awareness and Demand for Eco-friendly Products
The North American bioherbicides market is more driven by growing consumer preference for eco-friendly and sustainable agricultural products. In 2023, sales of certified organic products in the U.S. reached a record $69.7 billion, marking a 3.4% increase from the previous year. Consumers increasingly search for food products grown using sustainable methods as environmental problems mount and demand chemical-free produce. Bioherbicides, derived from natural organisms, fulfill this requirement by providing healthy, non-toxic methods of weed control. The health-conscious particularly worry about pesticide residues and their many, long-term effects. Increasingly, food producers and retailers are focusing on organic certification and sustainable agriculture and are therefore promoting the use of bioherbicides as part of North America's move toward environmentally friendly agriculture.
North America Bioherbicides Industry Segmentation:
IMARC Group provides an analysis of the key trends in each segment of the North America bioherbicides market, along with forecasts at the country levels from 2026-2034. The market has been categorized based on crop type, source, application, mode of action, and formulation.
Analysis by Crop Type:
- Agricultural Crops
- Non-Agricultural Crops
Agricultural crops lead the market as bioherbicides gain popularity, driven by the rising adoption of organic farming. Farmers prefer bioherbicides to control weeds without compromising soil health or crop productivity. These eco-friendly solutions align with sustainability goals by reducing reliance on synthetic chemicals and ensuring pesticide-free food production. Growing consumer demand for organic and environmentally safe agricultural products further propels market growth. Additionally, regulatory support for sustainable farming practices encourages bioherbicide adoption. Innovations in microbial and plant-based herbicides enhance their efficacy, making them a viable alternative to conventional weed control methods. As farmers prioritize soil fertility and ecological balance, bioherbicides continue to expand their footprint in modern agriculture, reinforcing long-term sustainability.
Analysis by Source:
- Microbial
- Biochemical
- Others
Microbial bioherbicides dominate the market due to their effectiveness in weed control while ensuring environmental safety. Derived from fungi, bacteria, and algae, these bioherbicides offer targeted action against weeds without harming beneficial plants, soil health, or non-target organisms. Their growing adoption is driven by the increasing demand for sustainable agricultural solutions and reduced dependency on chemical herbicides. Farmers favor microbial bioherbicides for their biodegradability, low toxicity, and compatibility with organic farming practices. Regulatory support for eco-friendly weed management further boosts their market presence. Continuous advancements in microbial formulations enhance their efficacy, making them a vital tool in integrated weed management strategies. As sustainability becomes a priority, microbial bioherbicides continue to gain traction in modern agriculture.
Analysis by Application:
Access the comprehensive market breakdown Request Sample
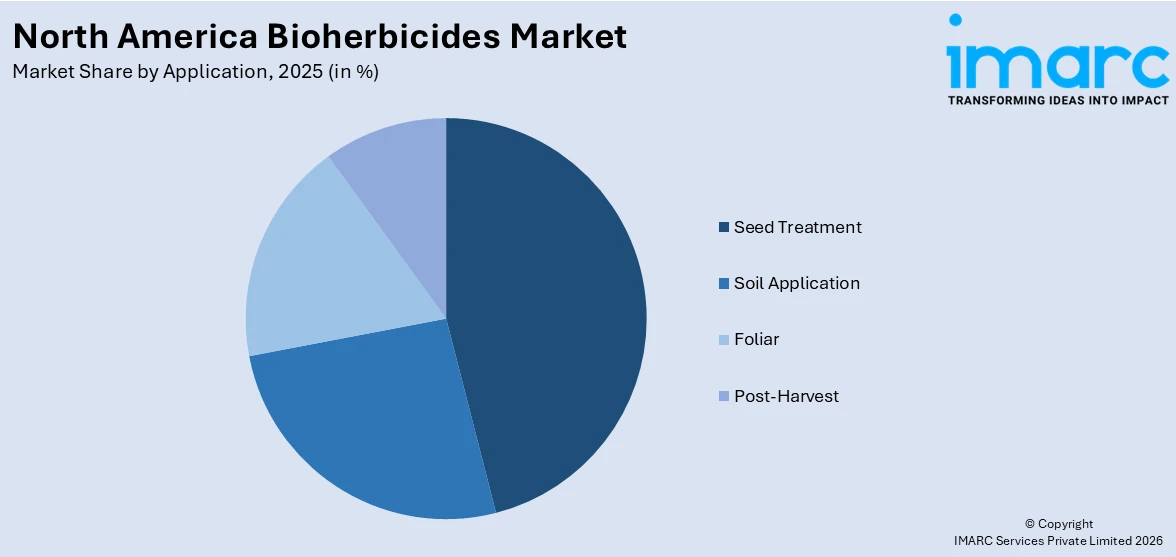
- Seed Treatment
- Soil Application
- Foliar
- Post-Harvest
Seed treatment is the largest segment in bioherbicide applications, offering early weed control and crop protection. By coating seeds with beneficial microorganisms or natural compounds, bioherbicides inhibit weed growth from the initial stages of cultivation. This method ensures targeted weed suppression while promoting healthy crop development without harming soil quality or non-target organisms. Its efficiency and minimal environmental impact make it a preferred choice among farmers seeking sustainable solutions. Seed treatment reduces the need for post-emergent herbicides, lowering chemical input costs and enhancing overall agricultural productivity. As demand for eco-friendly farming practices grows, bioherbicide-based seed treatments continue to gain traction, reinforcing their role in sustainable and resilient crop management strategies.
Analysis by Mode of Action:
- MOA Involving Photosynthesis
- MOA Targeting Enzymes
- Others
MOA targeting enzymes holds the largest market share. These bioherbicides function by inhibiting key biochemical pathways essential for weed growth, disrupting enzymes responsible for cell division and development. As a result, weeds gradually weaken and die while surrounding crops and ecosystems remain unharmed. This targeted approach minimizes unintended environmental impact and reduces reliance on synthetic herbicides. Farmers favor enzyme-targeting bioherbicides for their ability to selectively eliminate weeds without affecting beneficial plants or soil health. With increasing emphasis on sustainable agriculture, these bioherbicides continue to gain traction, supporting eco-friendly farming practices and improving long-term weed management efficiency. Their role in integrated weed control strategies ensures their growing market presence.
Analysis by Formulation:
- Granular
- Liquid
- Others
Granular bioherbicides hold the largest market share due to their ease of application and long-lasting effectiveness. Designed for direct soil application, these bioherbicides provide a slow and controlled release, ensuring extended weed suppression. They are particularly effective in preventing weed germination and managing invasive species in agricultural fields. Their precision in targeting weeds while minimizing environmental impact makes them a preferred choice for sustainable farming. Granular formulations reduce runoff risks, enhance soil health, and require fewer applications, lowering labor and input costs for farmers. As demand for eco-friendly and efficient weed control solutions grows, granular bioherbicides continue to gain traction, reinforcing their role in integrated weed management strategies.
Country Insights:
- United States
- Canada
- Mexico
The United States dominates the bioherbicides market, driven by the rising demand for organic farming and sustainable agriculture. The market is further supported by government incentives that encourage environmentally friendly weed control and strict laws governing chemical herbicides. Farmers and land managers are using bioherbicides as a safer substitute for synthetic weed control methods as a result of growing environmental consciousness. The nation's robust agricultural infrastructure and ongoing scientific discoveries facilitate the creation and uptake of novel bioherbicides. Growth is further accelerated by the presence of important market participants and investments in biotechnological developments. Bioherbicides are becoming more and more popular as consumers' preferences for produce free of pesticides grow, thereby enhancing their contribution to sustainable farming methods in the US.
Competitive Landscape:
A combination of established businesses and up-and-coming startups committed to sustainable agricultural solutions make up the competitive landscape. The main area of competition for businesses in this sector is innovation, especially when it comes to creating highly potent bioherbicides with a wider variety of weed-control applications. Collaborations between private sector businesses and research institutions are essential for promoting product development and innovation. Additionally, market participants are putting more of an emphasis on product differentiation by developing formulations that provide enhanced stability, extended shelf life, and simplicity of use. Additionally, businesses are compelled to embrace sustainable practices while navigating a changing regulatory environment due to the growing significance of regulatory compliance and the rising consumer demand for organic and environmentally friendly farming methods. Competitive strategies also involve expanding distribution networks and forming strategic partnerships with agricultural organizations in the North American bioherbicides market outlook.
The report provides a comprehensive analysis of the competitive landscape in the North America bioherbicides market with detailed profiles of all major companies.
Latest News and Developments:
- In January 2025, ICIG Ventures invested in Ascribe Bio to support the commercial launch of Phytalix, a small-molecule biofungicide. This strategic investment aims to scale Phytalix’s manufacturing by leveraging the global chemical manufacturing capabilities of WeylChem Group, ICIG’s fine chemicals platform. The partnership will help accelerate the production process, enabling Ascribe to meet the growing demand for natural crop protection solutions and enhance its market presence in the agricultural sector.
- In December 2023, The U.S. EPA registered Greenlight Biosciences' Ledprona, the world’s first sprayable dsRNA biopesticide. This product is designed to combat the Colorado potato beetle (CPB), a significant threat to U.S. potato crops. Using RNA interference (RNAi), Ledprona disrupts the CPB's vital protein production without genetically modifying organisms. The approval marks a significant step in reducing reliance on toxic chemicals and offers farmers an innovative solution for pest control and resistance management.
North America Bioherbicides Market Report Scope:
| Report Features | Details |
|---|---|
| Base Year of the Analysis | 2025 |
| Historical Period | 2020-2025 |
| Forecast Period | 2026-2034 |
| Units | Million USD |
| Scope of the Report |
Exploration of Historical Trends and Market Outlook, Industry Catalysts and Challenges, Segment-Wise Historical and Future Market Assessment:
|
| Crop Types Covered | Agricultural Crops, Non-Agricultural Crops |
| Sources Covered | Microbial, Biochemical, Others |
| Applications Covered | Seed Treatment, Soil Application, Foliar, Post-Harvest |
| Modes of Actions Covered | MOA Involving Photosynthesis, MOA Targeting Enzymes, Others |
| Formulations Covered | Granular, Liquid, Others |
| Countries Covered | United States, Canada, Mexico |
| Customization Scope | 10% Free Customization |
| Post-Sale Analyst Support | 10-12 Weeks |
| Delivery Format | PDF and Excel through Email (We can also provide the editable version of the report in PPT/Word format on special request) |
Key Benefits for Stakeholders:
- IMARC’s report offers a comprehensive quantitative analysis of various market segments, historical and current market trends, market forecasts, and dynamics of the North America bioherbicides market from 2020-2034.
- The research study provides the latest information on the market drivers, challenges, and opportunities in the North America bioherbicides market.
- Porter's Five Forces analysis assists stakeholders in assessing the impact of new entrants, competitive rivalry, supplier power, buyer power, and the threat of substitution. It helps stakeholders to analyze the level of competition within the North America bioherbicides industry and its attractiveness.
- Competitive landscape allows stakeholders to understand their competitive environment and provides an insight into the current positions of key players in the market.
Frequently Asked Questions About the North America Bioherbicides Market Report
The North America bioherbicides market was valued at USD 826.7 Million in 2025.
The North America bioherbicides market was valued at USD 2,126.3 Million by 2034 exhibiting a CAGR of 10.73% during 2026-2034.
The growth of the North American bioherbicides market is driven by increasing consumer demand for organic and sustainable agriculture, strict regulations on chemical herbicides, advancements in bioherbicide technology, and the adoption of Integrated Pest Management (IPM) practices. These factors align with environmental concerns and the need for effective, eco-friendly weed control.
Need more help?
- Speak to our experienced analysts for insights on the current market scenarios.
- Include additional segments and countries to customize the report as per your requirement.
- Gain an unparalleled competitive advantage in your domain by understanding how to utilize the report and positively impacting your operations and revenue.
- For further assistance, please connect with our analysts.
 Request Customization
 Speak to an Analyst
 Request Brochure
 Inquire Before Buying
Benefits of Customization
- Personalize this research
- Triangulate with your data
- Get data as per your format and definition
- Gain a deeper dive into a specific application, geography, customer, or competitor
- Any level of personalization
Get in Touch With Us
UNITED STATES
Phone: +1-201-971-6302
INDIA
Phone: +91-120-433-0800
UNITED KINGDOM
Phone: +44-753-714-6104
Email: [email protected]
Client Testimonials


.webp)


