
North America Salmon Market Report by Type (Farmed, Wild Captured), Species (Atlantic, Pink, Chum/Dog, Coho, Sockeye, and Others), End-Product Type (Frozen, Fresh, Canned, and Others), Distribution Channel (Foodservice, Retail), and Country 2026-2034
Market Overview:
The North America salmon market size reached USD 7.5 Billion in 2025. Looking forward, IMARC Group expects the market to reach USD 11.6 Billion by 2034, exhibiting a growth rate (CAGR) of 4.64% during 2026-2034. The increasing preference for easily consumable food products, the growing environmental concerns coupled with the rising interest in sustainable and responsible sourcing of seafood, and the efficient supply chain and logistics infrastructure are among the key factors driving the market growth.
|
Report Attribute
|
Key Statistics
|
|---|---|
|
Base Year
|
2025
|
|
Forecast Years
|
2026-2034
|
|
Historical Years
|
2020-2025
|
| Market Size in 2025 | USD 7.5 Billion |
| Market Forecast in 2034 | USD 11.6 Billion |
| Market Growth Rate 2026-2034 | 4.64% |
Access the full market insights report Request Sample
Salmon is a highly prized and nutritious fish species that belongs to the family Salmonidae. It has distinctive pink flesh and a rich, buttery flavour and is a staple in various cuisines. There are several species of salmon, with the most common ones being the Atlantic salmon and the Pacific salmon, which include varieties, such as Chinook, Sockeye, Coho, and pink salmon. Beyond its culinary appeal, salmon is a nutritional powerhouse, packed with omega-3 fatty acids, high-quality protein, and essential vitamins and minerals, such as vitamin D, B12, and selenium. These nutrients contribute to numerous health benefits, promoting heart health and brain function and reducing inflammation. Due to its popularity and increasing demand, sustainable fishing practices are essential to ensure the preservation of salmon populations and their delicate ecosystems.
The expanding aquaculture industry is driving the market in North America. Moreover, the increasing preference for easily consumable food products, leading to a diverse range of salmon-based offerings such as frozen salmon, canned salmon, smoked salmon, salmon jerky, salmon oil, salmon lox, and salmon spreads, is supporting the market. Besides, salmon aids in maintaining bone and teeth health and enhances the absorption and utilization of essential minerals, such as calcium and phosphorus Apart from this, the growing environmental concerns, and a growing interest in sustainable and responsible sourcing of seafood have led to an increased focus on certified sustainable salmon fisheries and aquaculture operations. Consumers and businesses are actively seeking eco-friendly options, leading to a push for more sustainable salmon production methods. Furthermore, the efficient supply chain and logistics infrastructure play a crucial role in the salmon market. Also, fishing and aquaculture industries are subject to various regulations imposed by governments worldwide to ensure the sustainability of fish stocks and protect the environment. These regulations are positively influencing the production levels and supply chain dynamics.
North America Salmon Market Trends/Drivers:
The Rising Health-Conscious Consumer Trends
As awareness of the numerous health benefits associated with salmon consumption spreads, demand for this nutrient-rich fish continues to increase. Salmon is renowned for its high levels of omega-3 fatty acids, which are essential for heart health and brain function. Additionally, it is an excellent source of high-quality protein, vitamins, such as vitamin D and B12, and minerals, including selenium. The increasing focus on maintaining a healthy lifestyle, coupled with the desire for nutritious and balanced diets, has led consumers to opt for salmon as a premium choice in their meals. Furthermore, the rise of chronic health conditions, such as cardiovascular diseases and obesity, has prompted many consumers to adopt diets that prioritize wholesome foods, such as salmon.
Culinary Versatility and Diverse Applications
Salmon's mild and buttery flavor profile, coupled with its distinctive pink flesh, make it an appealing choice for a wide range of culinary creations. It offers a delightful and flavorful experience to consumers with varying taste preferences. Furthermore, salmon's adaptability in various cuisines, from traditional American dishes to international fare, makes it a staple ingredient for chefs and home cooks alike. The increasing popularity of fusion cuisine has also given rise to innovative salmon-based dishes that cater to evolving consumer palates. The diverse range of ready-to-eat salmon products, such as smoked salmon, salmon burgers, and salmon poke bowls, further expands its reach in the market, appealing to consumers seeking convenient yet nutritious meal options. The culinary versatility of salmon is likely to continue driving its demand and growth in the North America market.
North America Salmon Industry Segmentation:
IMARC Group provides an analysis of the key trends in each segment of the North America salmon market report, along with forecasts at the regional and country levels from 2026-2034. Our report has categorized the market based on type, species, end-product type and distribution channel.
Breakup by Type:
To get detailed segment analysis of this market Request Sample
- Farmed
- Wild Captured
Farmed type represents the most widely used type
The report has provided a detailed breakup and analysis of the market based on the type. This includes farmed, and wild captured. According to the report, farmed represented the largest segment.
Farmed salmon refers to salmon that is raised in controlled aquatic environments, such as fish farms and hatcheries rather than being caught in the wild. Farmed salmon production allows for controlled and consistent year-round harvests, reducing the seasonal fluctuations that occur with wild catch. Moreover, continual advancements in aquaculture technology and practices have significantly improved the efficiency and sustainability of salmon farming. Modern fish farms utilize advanced water filtration systems, disease management protocols, and sustainable feed formulations, minimizing environmental impacts and improving fish welfare. Also, farmed salmon offers economic benefits to the global seafood industry and local economies.
Breakup by Species:
- Atlantic
- Pink
- Chum/Dog
- Coho
- Sockeye
- Others
Atlantic species holds the majority of the market share
A detailed breakup and analysis of the market based on the species has also been provided in the report. This includes Atlantic, pink, chum/Dog, Coho, Sockeye, and others. According to the report, Atlantic species represented the largest segment.
Aquaculture plays a significant role in meeting the growing demand for this species. The aquaculture of Atlantic salmon has expanded globally, with major producing countries. The controlled environment of salmon farms allows for year-round production, reducing the seasonal fluctuations seen in wild salmon catches. As a result, consumers can enjoy Atlantic salmon throughout the year, making it a reliable choice for restaurants, retailers, and consumers worldwide. Moreover, Atlantic salmon's adaptability and versatility in various culinary applications contribute to its market dominance. Its mild and buttery flavor profile makes it an ideal choice for a wide range of recipes and cooking methods, from grilling and baking to smoking and curing.
Breakup by End-Product Type:
- Frozen
- Fresh
- Canned
- Others
Frozen type holds the majority of the market share
A detailed breakup and analysis of the market based on the end-product type has also been provided in the report. This includes frozen, fresh, canned, and others. According to the report, frozen type represented the largest segment.
Frozen salmon refers to salmon that has been processed and preserved through freezing, typically within hours of harvest or processing to retain its freshness and quality. It offers convenience and an extended shelf life, making it a popular choice for both consumers and the food industry. Freezing effectively halts bacterial growth and enzymatic reactions, preventing spoilage and preserving the salmon's taste, texture, and nutritional value. Additionally, it offers flexibility in meal planning and reduces food waste. Consumers can purchase frozen salmon in bulk and store it for later use, enabling them to prepare salmon-based dishes whenever they desire, without the need to visit the market frequently.
Breakup by Distribution Channel:
- Foodservice
- Retail
Foodservice hold the majority of the market share
A detailed breakup and analysis of the market based on the distribution channel has also been provided in the report. This includes foodservice, and retail. According to the report, foodservice represented the largest segment.
Foodservice refers to the sector that includes restaurants, cafes, hotels, catering services, and other establishments that prepare and serve meals to consumers. The widespread popularity of salmon in the foodservice industry is impelled by its culinary versatility and consumer appeal. Salmon's mild and distinctive flavor, along with its attractive pink flesh, makes it a highly sought-after choice for chefs and restaurateurs. Moreover, the foodservice industry benefits from the convenience and efficiency of working with frozen and value-added salmon products. Frozen salmon ensures a steady supply throughout the year, reducing reliance on seasonal availability.
Breakup by Country:
To get detailed regional analysis of this market Request Sample
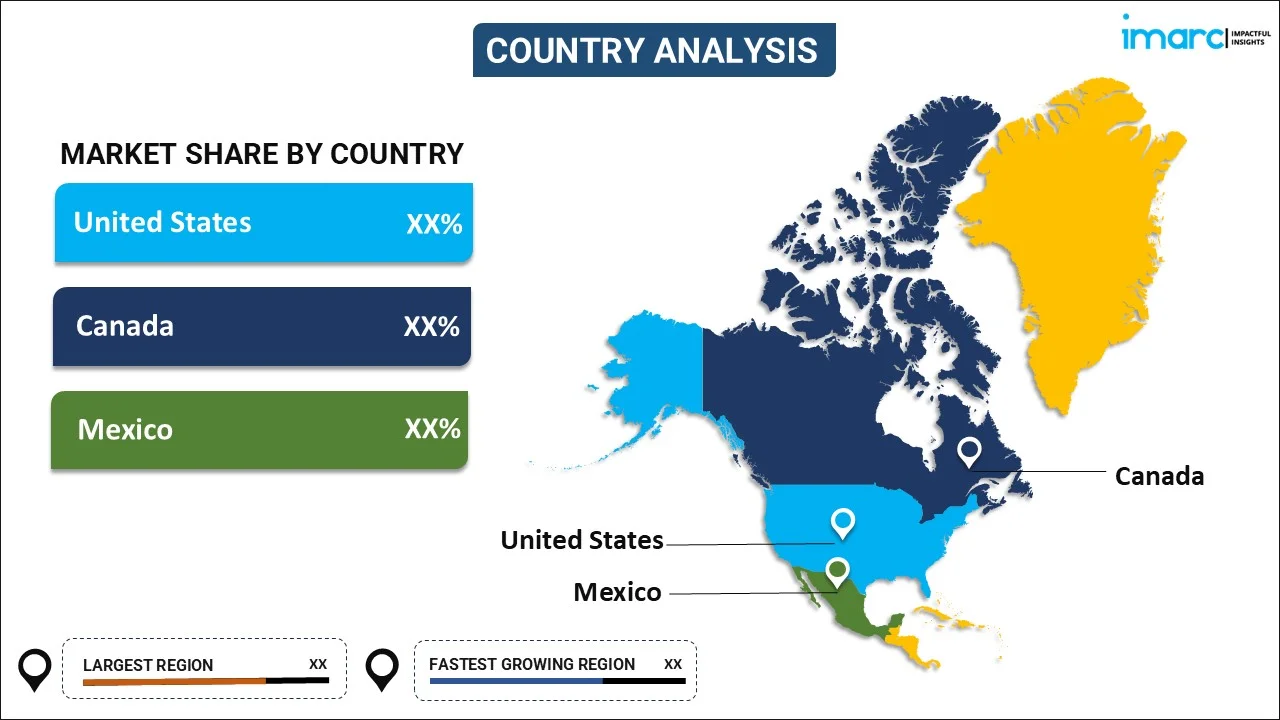
- United States
- Canada
- Mexico
United States exhibits a clear dominance, accounting for the largest Salmon market share
The report has also provided a comprehensive analysis of all the major country markets, which include the United States, Canada, and Mexico. According to the report, the United States represented the largest market for salmon
United States cultural diversity and evolving culinary trends have also led to an increased incorporation of salmon in various cuisines, from traditional dishes to fusion and modern creations. Moreover, the country boasts a well-established aquaculture industry that efficiently produces a significant portion of the salmon consumed domestically. Additionally, the rising stringent regulations and standards for food safety and sustainability have impelled consumer confidence in the quality of salmon products. Additionally, the well-developed distribution and logistics network in the United States facilitates the efficient transportation and supply of salmon to various markets, ensuring a steady availability of the product throughout the year.
Competitive Landscape:
Several major companies in the salmon industry are focusing on sustainable fishing practices and responsible aquaculture. They implement measures to minimize environmental impacts, reduce carbon footprints, and protect wild salmon populations. These efforts aim to maintain the long-term viability of the industry and ensure a stable supply of salmon. Moreover, several companies have invested in traceability systems to provide consumers with information about the origin of their salmon. To cater to diverse consumer preferences, companies have also introduced a wide range of salmon products, including frozen fillets, smoked salmon, value-added products, such as salmon burgers and sausages, and ready-to-eat meals. This diversification allows them to capture different market segments and expand their customer base.
The competitive landscape of the market has been studied in the report with the detailed profiles of the key players operating in the market.
North America Salmon Market Report Scope:
| Report Features | Details |
|---|---|
| Base Year of the Analysis | 2025 |
| Historical Period | 2020-2025 |
| Forecast Period | 2026-2034 |
| Units | ‘000 Tons, Billion USD |
| Scope of the Report | Exploration of Historical and Forecast Trends, Industry Catalysts and Challenges, Segment-Wise Historical and Predictive Market Assessment:
|
| Types Covered | Farmed, Wild Captured |
| Species Covered | Atlantic, Pink, Chum/Dog, Coho, Sockeye, Others |
| End-Product Types Covered | Frozen, Fresh, Canned, Others |
| Distribution Channels Covered | Foodservice, Retail |
| Countries Covered | United States, Canada, Mexico |
| Customization Scope | 10% Free Customization |
| Post-Sale Analyst Support | 10-12 Weeks |
| Delivery Format | PDF and Excel through Email (We can also provide the editable version of the report in PPT/Word format on special request) |
Key Questions Answered in This Report:
- How has the North America salmon market performed so far, and how will it perform in the coming years?
- What are the drivers, restraints, and opportunities in the North America salmon market?
- What is the impact of each driver, restraint, and opportunity on the North America salmon market?
- What is the breakup of the market based on the type?
- Which is the most attractive type in the North America salmon market?
- What is the breakup of the market based on the species?
- Which is the most attractive species in the North America salmon market?
- What is the breakup of the market based on the end-product type?
- Which is the most attractive end-product type in the North America salmon market?
- What is the breakup of the market based on the distribution channel?
- Which is the most attractive distribution channel in the North America salmon market?
- What is the breakup of the market based on imports and domestic manufacturing?
- What is the competitive structure of the North America salmon market?
- Who are the key players/companies in the North America salmon market?
Key Benefits for Stakeholders:
- IMARC’s report offers a comprehensive quantitative analysis of various market segments, historical and current market trends, market forecasts, and dynamics of the North America salmon market from 2020-2034.
- The research study provides the latest information on the market drivers, challenges, and opportunities in the North America salmon market.
- Porter's five forces analysis assist stakeholders in assessing the impact of new entrants, competitive rivalry, supplier power, buyer power, and the threat of substitution. It helps stakeholders to analyze the level of competition within the North America salmon industry and its attractiveness.
- Competitive landscape allows stakeholders to understand their competitive environment and provides an insight into the current positions of key players in the market.
Need more help?
- Speak to our experienced analysts for insights on the current market scenarios.
- Include additional segments and countries to customize the report as per your requirement.
- Gain an unparalleled competitive advantage in your domain by understanding how to utilize the report and positively impacting your operations and revenue.
- For further assistance, please connect with our analysts.
 Request Customization
 Speak to an Analyst
 Request Brochure
 Inquire Before Buying
Benefits of Customization
- Personalize this research
- Triangulate with your data
- Get data as per your format and definition
- Gain a deeper dive into a specific application, geography, customer, or competitor
- Any level of personalization
Get in Touch With Us
UNITED STATES
Phone: +1-201-971-6302
INDIA
Phone: +91-120-433-0800
UNITED KINGDOM
Phone: +44-753-714-6104
Email: [email protected]
Client Testimonials


.webp)


