
North America Smart TV Market Report by Resolution Type (4K UHD TV, HD TV, Full HD TV, 8K TV), Screen Size (Below 32 Inches, 32 to 45 Inches, 46 to 55 Inches, 56 to 65 Inches, Above 65 Inches), Screen Type (Flat, Curved), Technology (LCD (Liquid Crystal Display), LED (Light Emitting Diode), OLED (Organic Light Emitting Diode), QLED (Quantum Dot Light Emitting Diode)), Platform (Android, Roku, WebOS, Tizen OS, iOS, MyHomeScreen, and Others), Distribution Channel (Offline, Online), Application (Residential, Commercial), and Country 2026-2034
Market Overview:
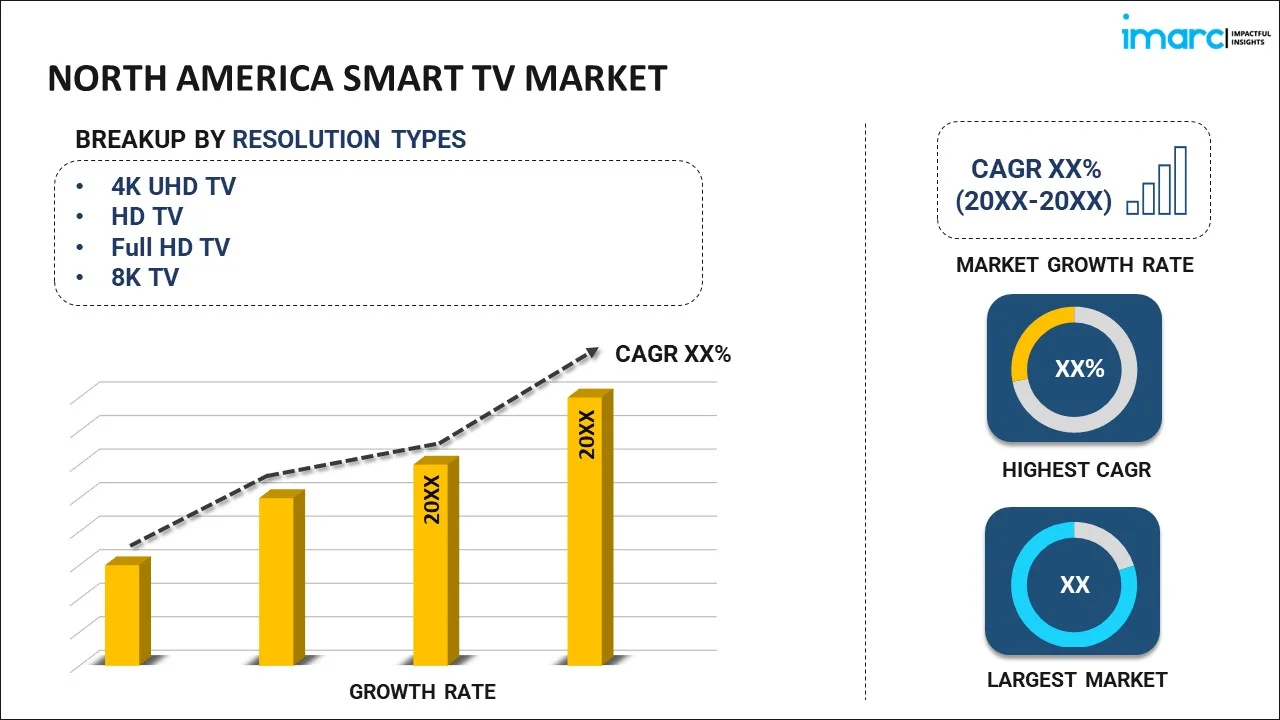
The North America smart TV market size reached USD 85.3 Billion in 2025. Looking forward, IMARC Group expects the market to reach USD 250.0 Billion by 2034, exhibiting a growth rate (CAGR) of 11.63% during 2026-2034. The increasing usage of high-speed internet, rising traction of OTT platforms, and growing demand of smart TVs among gamers represent some of the key factors driving the market.
|
Report Attribute
|
Key Statistics
|
|---|---|
|
Base Year
|
2025
|
|
Forecast Years
|
2026-2034
|
|
Historical Years
|
2020-2025
|
|
Market Size in 2025
|
USD 85.3 Billion |
|
Market Forecast in 2034
|
USD 250.0 Billion |
| Market Growth Rate 2026-2034 | 11.63% |
Access the full market insights report Request Sample
A smart television (TV) is an electrical device integrated with internet connectivity, which is used to watch shows and access various free or paid streaming apps. It comprises an operating system that offers various games, applications, channels, and other digital services and hardware and connection types to receive cable and satellite transmission passively. It supports ethernet, wireless fidelity (Wi-Fi), Bluetooth, and flash memory cards from digital cameras, along with coaxial cable, high-definition multimedia interface (HDMI), and other audio-video connections. A smart TV can also be connected with various input devices, such as smartphones, tablets, keyboards, laptops, speakers, and mouse, to display pictures, play music, and watch videos from various websites and access different social media sites. It can control the operation of numerous connected devices in a smart home, such as smart locks and lights, through a dashboard incorporated into its system. It also provides voice search features to enable the users to navigate the menu, find channels, switch between apps, and control other connected devices without using the remote. As smart TV is user-friendly and provides various advanced features along with a big screen, it finds applications in the residential and commercial sectors across the North American region.
North America Smart TV Market Trends:
At present, the increasing utilization of high-speed internet for socializing, learning, and telehealth represents one of the primary factors influencing the market positively in the North American region. Besides this, there is a rise in the traction of various over-the-top (OTT) platforms as they are convenient, provide quality content, and enable users to watch their favorite shows on their preferred devices. This, coupled with the wide availability of various affordable subscription-based plans provided by streaming media services, is propelling the growth of the market in the region. In addition, the growing demand for smart TVs among gamers to connect their gaming peripherals and rigs and achieve a thrilling experience while playing is offering a favorable market outlook in the North American region. Apart from this, the rising application of smart TVs in office spaces to conduct video conferences, display presentations, and stream videos related to work is supporting the market growth. Moreover, the increasing employment of smart TVs integrated with smart class technology in schools and colleges for promoting better academic learning among students is strengthening the market growth in the North American region. Furthermore, key market players operating in the region are manufacturing smart TVs integrated with artificial intelligence (AI) and high dynamic range (HDR) programming to enhance their functionalities.
Key Market Segmentation:
IMARC Group provides an analysis of the key trends in each sub-segment of the North America smart TV market report, along with forecasts at the regional and country level from 2026-2034. Our report has categorized the market based on resolution type, screen size, screen type, technology, platform, distribution channel, and application.
Resolution Type Insights:
To get detailed segment analysis of this market Request Sample
- 4K UHD TV
- HD TV
- Full HD TV
- 8K TV
The report has provided a detailed breakup and analysis of the North America smart TV market based on the resolution type. This includes 4K UHD TV, HD TV, full HD TV, and 8K TV. According to the report, 4K UHD TV represented the largest segment.
Screen Size Insights:
- Below 32 Inches
- 32 to 45 Inches
- 46 to 55 Inches
- 56 to 65 Inches
- Above 65 Inches
A detailed breakup and analysis of the North America smart TV market based on screen size has also been provided in the report. This includes below 32 inches, 32 to 45 inches, 46 to 55 inches, 56 to 65 inches, and above 65 inches. According to the report, 32 to 45 inches accounted for the largest market share.
Screen Type Insights:
- Flat
- Curved
A detailed breakup and analysis of the North America smart TV market based on the screen type has also been provided in the report. This includes flat and curved. According to the report, flat accounted for the largest market share.
Technology Insights:
- LCD (Liquid Crystal Display)
- LED (Light Emitting Diode)
- OLED (Organic Light Emitting Diode)
- QLED (Quantum Dot Light Emitting Diode)
A detailed breakup and analysis of the North America smart TV market based on technology has also been provided in the report. This includes LCD (liquid crystal display), LED (light emitting diode), OLED (organic light emitting diode), and QLED (quantum dot light emitting diode). According to the report, LED accounted for the largest market share.
Platform Insights:
- Android
- Roku
- WebOS
- Tizen OS
- iOS
- MyHomeScreen
- Others
A detailed breakup and analysis of the North America smart TV market based on the platform has also been provided in the report. This includes android, Roku, WebOS, Tizen OS, iOS, MyHomeScreen, and others. According to the report, android accounted for the largest market share.
Distribution Channel Insights:
- Offline
- Online
A detailed breakup and analysis of the North America smart TV market based on the distribution channel has also been provided in the report. This includes offline and online. According to the report, offline accounted for the largest market share.
Application Insights:
- Residential
- Commercial
A detailed breakup and analysis of the North America smart TV market based on application has also been provided in the report. This includes residential and commercial. According to the report, residential accounted for the largest market share.
Country Insights:
To get detailed regional analysis of this market Request Sample
- United States
- Canada
- Mexico
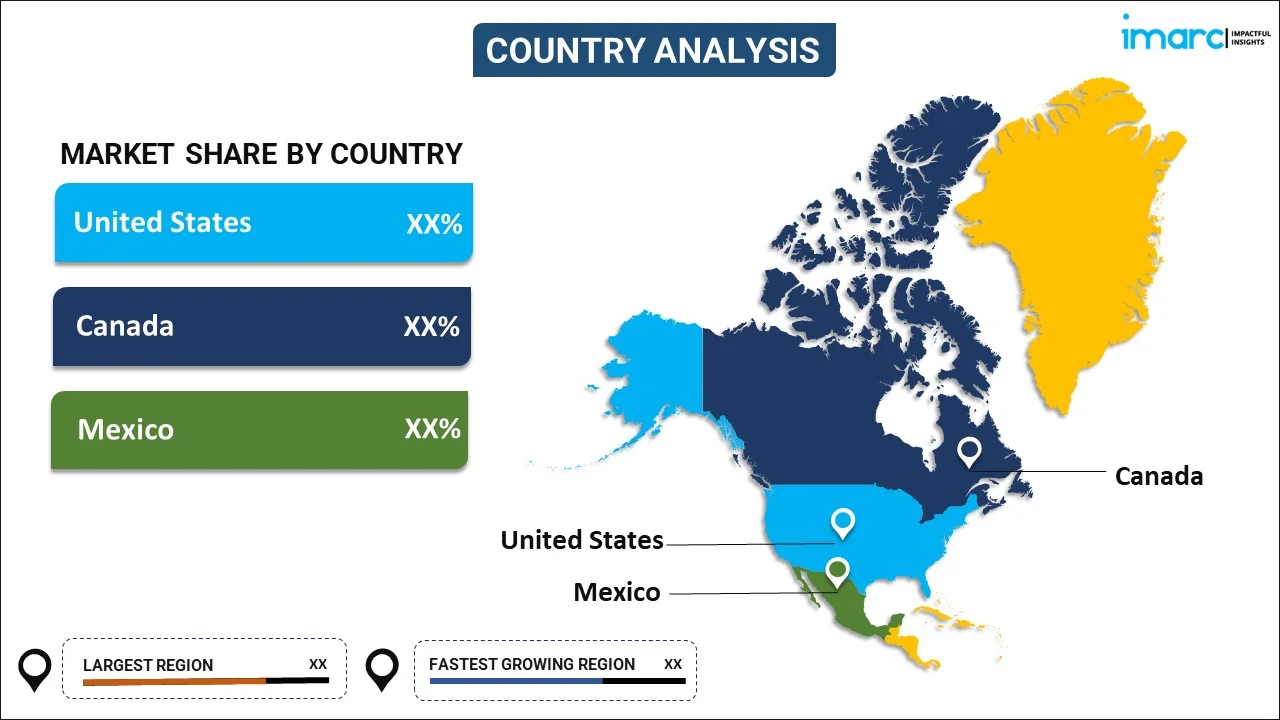
The report has also provided a comprehensive analysis of all the major regional markets that include United States, Canada, and Mexico. According to the report, United States was the largest market for smart TVs. Some of the factors driving the United States smart TV market included the increasing demand for personalized entertainment, rising technological advancements in the electrical industry, the growing usage of smart TVs in the residential sector, etc.
Competitive Landscape:
The report has also provided a comprehensive analysis of the competitive landscape in the North America smart TV market. Detailed profiles of all major companies have also been provided.
Report Coverage:
| Report Features | Details |
|---|---|
| Base Year of the Analysis | 2025 |
| Historical Period | 2020-2025 |
| Forecast Period | 2026-2034 |
| Units | Billion USD |
| Segment Coverage | Resolution Type, Screen Size, Screen Type, Technology, Platform, Application, Distribution Channel, Country |
| Countries Covered | United States, Canada, Mexico |
| Customization Scope | 10% Free Customization |
| Post-Sale Analyst Support | 10-12 Weeks |
| Delivery Format | PDF and Excel through Email (We can also provide the editable version of the report in PPT/Word format on special request) |
Key Benefits for Stakeholders:
- IMARC’s report offers a comprehensive quantitative analysis of various market segments, historical and current market trends, market forecasts, and dynamics of the North America smart TV market from 2020-2034.
- The research study provides the latest information on the market drivers, challenges, and opportunities in the North America smart TV market.
- The study maps the leading as well as the fastest growing regional markets. It further enables stakeholders to identify the key country-level markets within each region.
- Porter's five forces analysis assist stakeholders in assessing the impact of new entrants, competitive rivalry, supplier power, buyer power, and the threat of substitution. It helps stakeholders to analyze the level of competition within the North America smart TV industry and its attractiveness.
- Competitive landscape allows stakeholders to understand their competitive environment and provides an insight into the current positions of key players in the market.
Frequently Asked Questions About the North America Smart TV Industry Analysis & Research Report Report
The North America smart TV market was valued at USD 85.3 Billion in 2025.
We expect the North America smart TV market to exhibit a CAGR of 11.63% during 2026-2034.
The increasing adoption of online video streaming channels, such as YouTube Premium, Netflix, and Amazon Prime Video, along with the rising popularity of Over-The-Top (OTT) platforms, is primarily driving the North America smart TV market.
The sudden outbreak of the COVID-19 pandemic has led to the growing utilization of smart TVs for indoor entertainment purposes, during the lockdown scenario across several North American nations.
Based on the resolution type, the North America smart TV market can be categorized into 4K UHD TV, HD TV, Full HD TV, and 8K TV. Currently, 4K UHD TV exhibits a clear dominance in the market.
Based on the screen size, the North America smart TV market has been segregated into below 32 inches, 32 to 45 inches,46 to 55 inches, 56 to 65 inches, and above 65 inches. Among these, 32 to 45 inches account for the largest market share.
Based on the screen type, the North America smart TV market can be segmented into flat and curved. Currently, flat-screen smart TVs hold the majority of the total market share.
Based on the technology, the North America smart TV market has been divided into LCD (Liquid Crystal Display), LED (Light Emitting Diode), OLED (Organic Light Emitting Diode), and QLED (Quantum Dot Light Emitting Diode). Among these, LED (Light Emitting Diode) smart TVs currently exhibit a clear dominance in the market.
Based on the platform, the North America smart TV market can be categorized into android, Roku, webOS, Tizen OS, iOS, MyHomeScreen, and others. Currently, android accounts for the majority of the total market share.
Based on the distribution channel, the North America smart TV market has been segregated into offline and online, where the offline distribution channel currently holds the largest market share.
Based on the application, the North America smart TV market can be bifurcated into residential and commercial. Currently, the residential sector exhibits a clear dominance in the market.
On a regional level, the market has been classified into United States, Canada, and Mexico, where the United States currently dominates the North America smart TV market.
Need more help?
- Speak to our experienced analysts for insights on the current market scenarios.
- Include additional segments and countries to customize the report as per your requirement.
- Gain an unparalleled competitive advantage in your domain by understanding how to utilize the report and positively impacting your operations and revenue.
- For further assistance, please connect with our analysts.
 Request Customization
 Speak to an Analyst
 Request Brochure
 Inquire Before Buying
Benefits of Customization
- Personalize this research
- Triangulate with your data
- Get data as per your format and definition
- Gain a deeper dive into a specific application, geography, customer, or competitor
- Any level of personalization
Get in Touch With Us
UNITED STATES
Phone: +1-201-971-6302
INDIA
Phone: +91-120-433-0800
UNITED KINGDOM
Phone: +44-753-714-6104
Email: [email protected]
Client Testimonials


.webp)


