
Oats Market Report by Product Type (Flakes, Flour, Bran, and Others), Application (Food Use, Feed Use), and Region 2026-2034
Oats Market Size:
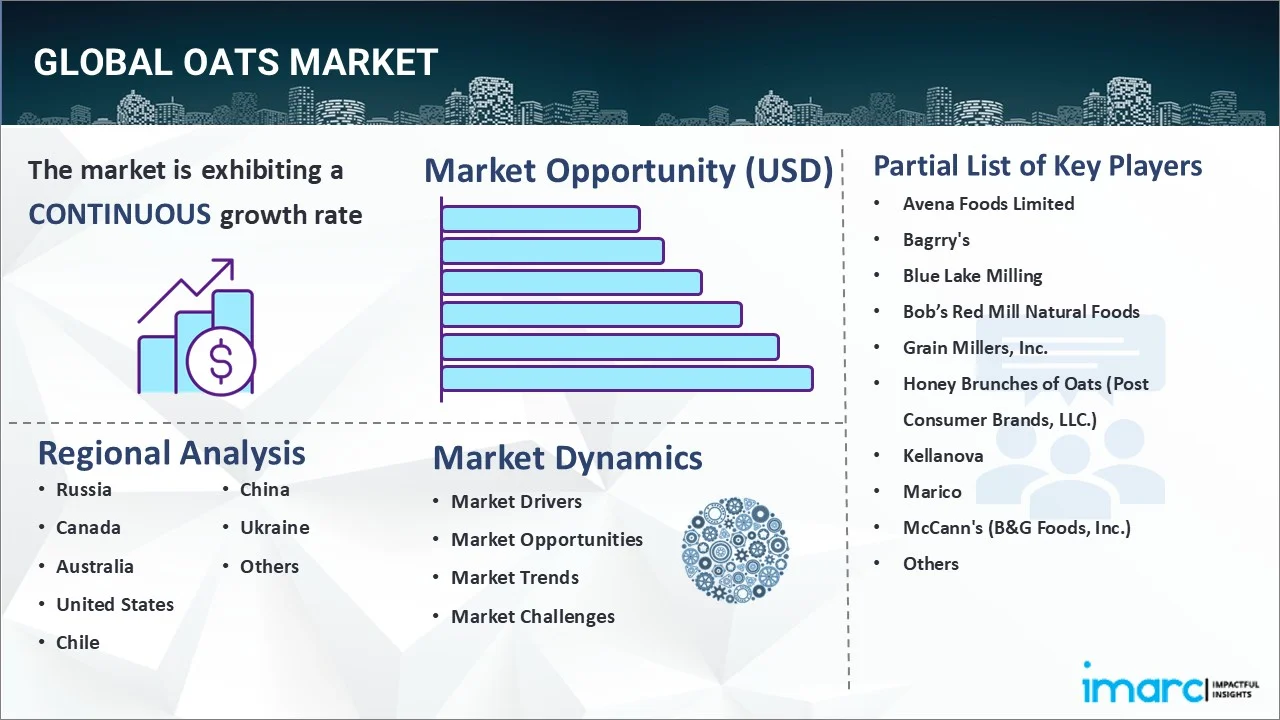
The global oats market size reached USD 5.68 Billion in 2025. Looking forward, IMARC Group expects the market to reach USD 6.62 Billion by 2034, exhibiting a growth rate (CAGR) of 1.63% during 2026-2034. Increasing health awareness, growing preference for healthy lifestyles and plant-based diets, the versatility of oats in various food applications, rising gluten intolerance, government support for sustainable agriculture, technological advancements, digital media influence, and expanding distribution channels are some of the factors supporting the market growth.
|
Report Attribute
|
Key Statistics
|
|---|---|
|
Base Year
|
2025 |
|
Forecast Years
|
2026-2034 |
|
Historical Years
|
2020-2025
|
| Market Size in 2025 | USD 5.68 Billion |
| Market Forecast in 2034 | USD 6.62 Billion |
| Market Growth Rate 2026-2034 | 1.63% |
Oats Market Analysis:
- Major Market Drivers: As per the oats market analysis, several factors are contributing to the market growth, including the rising consumer interest in natural and minimally processed foods, the development of personalized nutrition trends, and progressing investments in research and development (R&D) to improve oat breeds and product formulations. In line with this, the increasing use of oats in the pharmaceutical and nutraceutical industries and burgeoning disposable incomes in emerging economies promoting premiumization of oats products are stimulating the oats market growth. Furthermore, the shift in consumer preference towards sustainability and ingredients that are sourced from ethical sources are providing a thrust to the market growth. Apart from this, government subsidies and incentives, development of new packaging technologies that increase product shelf life and convenience, and the surging use of oats in pet food products are fueling the oats market share.
- Key Market Trends: There are several oats market trends, such as the emergence of novel oat-based product forms, as observed with the rise of oat milk and oat-based meat substitutes, are some of the primary factors bolstering the market growth. In line with this, increased consumer awareness in ancient grain varieties, such as steel-cut and rolled oats, and the growing popularity of organic and non-genetically modified organism (GMO) oats dishes are supporting the oats market trends. Furthermore, the increasing demand for nutritious eating, the growing demand for ready-to-eat (RTE) oats snacks and convenience foods, and burgeoning product use in beauty industry due to their skin-healing qualities are providing a thrust to the market growth. There is also a spike in recognition of online reading sites that showcase various dishes inspired by oats, which is accelerating the market growth. Apart from this, the escalating demand for gluten-free oats dishes among health-conscious customers and the integration of oats into functional drinking and food-making processes are further driving the global oats demand.
- Geographical Trends: The global oat’s market is led by the North America, as a result of the rising health consciousness, presence of leading key market players and effective distribution infrastructure enabling easy accessibility, and supportive government regulations promoting oats cultivation. As per the oats market report, the European market also acquires a notable share of the oats market, as a result of the sustained cultural dietary habits, elevated demand for gluten-free and organic oats products, and increased inclination of consumers toward vegetarianism.
- Competitive Landscape: The market is characterized by the presence of several key players, including Avena Foods Limited, Bagrry's, Blue Lake Milling, Bob’s Red Mill Natural Foods, Grain Millers, Inc., Honey Brunches of Oats (Post Consumer Brands, LLC.), Kellanova, Marico, McCann's (B&G Foods, Inc.), Morning Foods, Nature's Path, Richardson Food & Ingredients, and The Quaker Oats Company (PepsiCo.), among others.
- Challenges and Opportunities: Challenges facing the oats market include price fluctuations in raw oat materials, supply chain disruptions impacting production and distribution, regulatory complexities related to labeling and health claims, and consumer skepticism towards unfamiliar oat-based products. However, opportunities abound in areas such as the development of value-added oats formulations targeting specific health conditions, expansion into untapped markets in Asia-Pacific and Latin America, collaboration with foodservice providers to introduce oats-based menu options and leveraging digital marketing strategies to engage with tech-savvy consumers and drive product adoption, which is further driving the oats market outlook.
To get more information on this market Request Sample
Oats Market Trends:
Escalating Health Awareness
The primary driver of the global oats market is the increasing awareness levels concerning the health benefits presented by oats consumption. Oats are a splendid source of fiber, a dietary component necessary for lowering cholesterol levels while also boosting digestion. The food is also monied in essential nutrients such as minerals, vitamins, and antioxidants, making them a nutritious option. With people becoming more concerned about their health and opting for natural and healthy foods, the demand for oats and oat-containing products is, consequently, increasing. The oats market forecast is also being driven by growing realizations regarding the influence of diet on the state of an individual’s health. As per the USDA Foreign Agricultural Services, in the European Union, about 5.39 million metric tons of oats were produced in 2023.
Shifting Trend Towards Healthy Lifestyle
The global movement towards healthier food choices and lifestyle is supporting the oats market. Consumers are becoming increasingly aware of the role of proper nutrition in preventing chronic diseases and maintaining sound health, which has further resulted in a growing interest in whole grains, such as oats. Moreover, the rising prevalence of obesity, cardiovascular diseases (CVDs), and other health problems linked to unhealthy dietary habits is positively driving the market growth. Oats are perceived as healthy and safe food and fit perfectly into the goals of people willing to eat more consciously, which is further driving the oats market revenue.
Surging Plant Based Diets
Another driver that affects the global oats market on a macro-environmental level is the growing popularity of plant-based diets. The increase in vegetarianism and veganism influences the demand for oats as they are naturally plant-derived and are consumable by vegans and vegetarians. Oats are also rich in protein, fiber, and most essential nutrients, which is why vegans and vegetarians use it as a protein source. Furthermore, the expanding vegan and plant-based markets have increased demand for porridge products with preferences for organic and environmentally superior crops, which is propelling the market growth.
Oats Market Segmentation:
IMARC Group provides an analysis of the key trends in each segment of the market, along with forecasts at the global and country levels for 2026-2034. Our report has categorized the market based on product type and application.
Breakup by Product Type:
To get detailed segment analysis of this market Request Sample
- Flakes
- Flour
- Bran
- Others
Flakes represents the leading market segment
The report has provided a detailed breakup and analysis of the market based on the product type. This includes flakes, flour, bran, and others. According to the report, flakes represented the largest segment.
The flakes segment in the oats market is driven by several key factors, such as the increasing consumer demand for convenient and ready-to-eat (RTE) breakfast options which fuels the growth of the flakes segment. As individuals lead busy lifestyles with limited time for meal preparation, they seek quick and hassle-free breakfast solutions, making flakes an attractive choice. Additionally, the rising awareness of the health benefits associated with oats consumption drives the demand for oat flakes. Consumers are increasingly opting for nutritious breakfast options that provide sustained energy and promote overall well-being, making oat flakes a popular choice due to their high fiber content and other essential nutrients. Moreover, the growing trend towards healthy eating habits and wellness lifestyles further propels the flakes segment. As consumers become more health-conscious and prioritize wholesome food choices, they turn to oat flakes as a nutritious and satiating breakfast option. Furthermore, the versatility of oat flakes in culinary applications drives their popularity.
Breakup by Application:
- Food use
- Feed use
Feed-use represents the leading market segment
The report has provided a detailed breakup and analysis of the market based on the application. This includes food use and feed use. According to the report, feed-use represented the largest segment.
The feed-use segment in the oats market is driven by several key factors, such as the increasing demand for livestock feed additives and supplements, particularly those promoting animal health and productivity, propels the growth of oats as a feed ingredient. Oats offer nutritional benefits for livestock, including high fiber content, essential vitamins, and minerals, which contribute to improved digestion and overall animal well-being. Additionally, oats are favored for their palatability and digestibility among various livestock species, including horses, cattle, poultry, and swine, further driving their use in feed formulations. Moreover, the rising trend towards sustainable and natural farming practices drives the demand for oats-based feed solutions as an alternative to synthetic additives and genetically modified ingredients, aligning with consumer preferences for clean label products in animal agriculture. Furthermore, the increasing awareness of the importance of animal nutrition in optimizing meat, milk, and egg production efficiency fuels the adoption of oats-based feed formulations by livestock producers seeking to enhance the quality and quantity of their agricultural outputs.
Breakup by Region:
To get more information on the regional analysis of this market Request Sample
- Russia
- Canada
- Australia
- United States
- Chile
- China
- Ukraine
- Others
Russia leads the market, accounting for the largest oats market share
The report has also provided a comprehensive analysis of all the major regional markets, which include Russia, Canada, Australia, the United States, Chile, China, Ukraine, and others. According to the report, Russia represents the largest regional market for oats.
The oats market in Russia is driven by several key factors, such as the region is driven by the increasing awareness of the health benefits associated with oats consumption among Russian consumers. Oats are recognized for their high fiber content, which aids in digestion and contributes to overall well-being, aligning with the growing trend towards healthier lifestyles in the country. Additionally, the rise of lifestyle diseases such as obesity and cardiovascular ailments has prompted individuals to seek out nutritious food options like oats to mitigate health risks. Moreover, the affordability and accessibility of oats products in Russia further propel market growth, making it a popular choice for consumers across various income segments. Furthermore, the region is driven by the expanding use of oats in the food processing industry, with manufacturers incorporating oats into a wide range of products such as breakfast cereals, snacks, and bakery items to cater to evolving consumer preferences. This diversification of oats applications not only boosts consumption but also drives innovation in product formulations and packaging. Apart from this, government initiatives to promote domestic oat cultivation and support sustainable agricultural practices contribute to the growth of the oats market in Russia.

Competitive Landscape:
The market research report has also provided a comprehensive analysis of the competitive landscape in the market. Detailed profiles of all major companies have also been provided. Some of the major market players in the oats industry include:
- Avena Foods Limited
- Bagrry's
- Blue Lake Milling
- Bob’s Red Mill Natural Foods
- Grain Millers, Inc.
- Honey Brunches of Oats (Post Consumer Brands, LLC.)
- Kellanova
- Marico
- McCann's (B&G Foods, Inc.)
- Morning Foods
- Nature's Path
- Richardson Food & Ingredients
- The Quaker Oats Company (PepsiCo.)
(Please note that this is only a partial list of the key players, and the complete list is provided in the report.)
Key players in the oats market are actively engaged in various strategies to maintain and strengthen their positions, such as they are investing significantly in research and development to innovate and introduce new oat-based products that cater to evolving consumer preferences and dietary trends. These innovations include the development of gluten-free, organic, and non-GMO oat products to meet the growing demand for healthier and more sustainable options. Additionally, key players are focusing on expanding their distribution networks to reach a wider consumer base, both domestically and internationally. This expansion involves partnerships with retailers, e-commerce platforms, and foodservice providers to ensure the availability of their products across multiple channels. Moreover, key players are prioritizing marketing and advertising efforts to promote the health benefits and versatility of oats, targeting consumers through various channels such as social media, influencer collaborations, and traditional advertising campaigns. Furthermore, strategic acquisitions, mergers, and collaborations with other companies in the food and beverage industry are also common strategies employed by key players to strengthen their market presence, expand their product portfolios, and gain access to new markets and distribution channels.
Oats Market News:
- In February 2020: Avena Foods Limited, the Canadian premier processor of Purity Protocol gluten-free oats, announced the construction of a new oat processing facility to meet the growing demand for safe, plant-based, nutritious, gluten-free foods and beverages. This investment will more than double Avena’s current production capacity of ‘start safe, stay safe’ ready-to-eat ‘Avena Purity Protocol’ conventional and certified-organic oats.
- In March 2020: Nature's Path Foods launched a new line of single-serve oatmeal cups featuring innovative packaging made from recyclable and compostable materials. The eco-friendly packaging aligns with the company's commitment to sustainability and addresses consumer concerns about plastic waste.
Oats Market Report Scope:
| Report Features | Details |
|---|---|
| Base Year of the Analysis | 2025 |
| Historical Period | 2020-2025 |
| Forecast Period | 2026-2034 |
| Units | Million Tons, Billion USD |
| Scope of the Report | Exploration of Historical and Forecast Trends, Industry Catalysts and Challenges, Segment-Wise Historical and Predictive Market Assessment:
|
| Product Types Covered | Flakes, Flour, Bran, Others |
| Applications Covered | Food Use, Feed Use |
| Countries Covered | Russia, Canada, Australia, United States, Chile, China, Ukraine, Others |
| Companies Covered | Avena Foods Limited, Bagrry's, Blue Lake Milling, Bob’s Red Mill Natural Foods, Grain Millers, Inc., Honey Brunches of Oats (Post Consumer Brands, LLC.), Kellanova, Marico, McCann's (B&G Foods, Inc.), Morning Foods, Nature's Path, Richardson Food & Ingredients, The Quaker Oats Company (PepsiCo.), etc. |
| Customization Scope | 10% Free Customization |
| Post-Sale Analyst Support | 10-12 Weeks |
| Delivery Format | PDF and Excel through Email (We can also provide the editable version of the report in PPT/Word format on special request) |
Key Benefits for Stakeholders:
- IMARC’s report offers a comprehensive quantitative analysis of various market segments, historical and current market trends, market forecasts, and dynamics of the oats market from 2020-2034.
- The research study provides the latest information on the market drivers, challenges, and opportunities in the global oats market.
- The study maps the leading, as well as the fastest-growing, regional markets. It further enables stakeholders to identify the key country-level markets within each region.
- Porter's five forces analysis assists stakeholders in assessing the impact of new entrants, competitive rivalry, supplier power, buyer power, and the threat of substitution. It helps stakeholders to analyze the level of competition within the oats industry and its attractiveness.
- Competitive landscape allows stakeholders to understand their competitive environment and provides an insight into the current positions of key players in the market.
Frequently Asked Questions About the Oats Market Report
The global oats market was valued at USD 5.68 Billion in 2025.
We expect the global oats market to exhibit a CAGR of 1.63% during 2026-2034.
The rising consumer awareness towards the numerous health benefits associated with oats, such as easing constipation, promoting the growth of healthy bacteria in the gut, providing antioxidants for improved blood circulation in the body, etc., is primarily driving the global oats market.
The sudden outbreak of the COVID-19 pandemic has led to the changing consumer inclination from conventional brick-and-mortar distribution channels towards online retail platforms for the purchase of oats.
Based on the product type, the global oats market has been segregated into flakes, flour, bran, and others. Among these, flakes currently hold the largest market share.
Based on the application, the global oats market can be bifurcated into food use and feed use. Currently, feed use exhibits a clear dominance in the market.
On a regional level, the market has been classified into Russia, Canada, Australia, United States, Chile, China, Ukraine, and others, where Russia currently dominates the global market.
Need more help?
- Speak to our experienced analysts for insights on the current market scenarios.
- Include additional segments and countries to customize the report as per your requirement.
- Gain an unparalleled competitive advantage in your domain by understanding how to utilize the report and positively impacting your operations and revenue.
- For further assistance, please connect with our analysts.
 Request Customization
 Speak to an Analyst
 Request Brochure
 Inquire Before Buying
Benefits of Customization
- Personalize this research
- Triangulate with your data
- Get data as per your format and definition
- Gain a deeper dive into a specific application, geography, customer, or competitor
- Any level of personalization
Get in Touch With Us
UNITED STATES
Phone: +1-201-971-6302
INDIA
Phone: +91-120-433-0800
UNITED KINGDOM
Phone: +44-753-714-6104
Email: [email protected]
Client Testimonials


.webp)


