
Oil and Gas EPC Market Report by Sector (Upstream, Midstream, Downstream), Service Type (Engineering, Procurement, Construction, Fabrication), Location (Onshore, Offshore), and Region 2026-2034
Oil and Gas EPC Market Size:
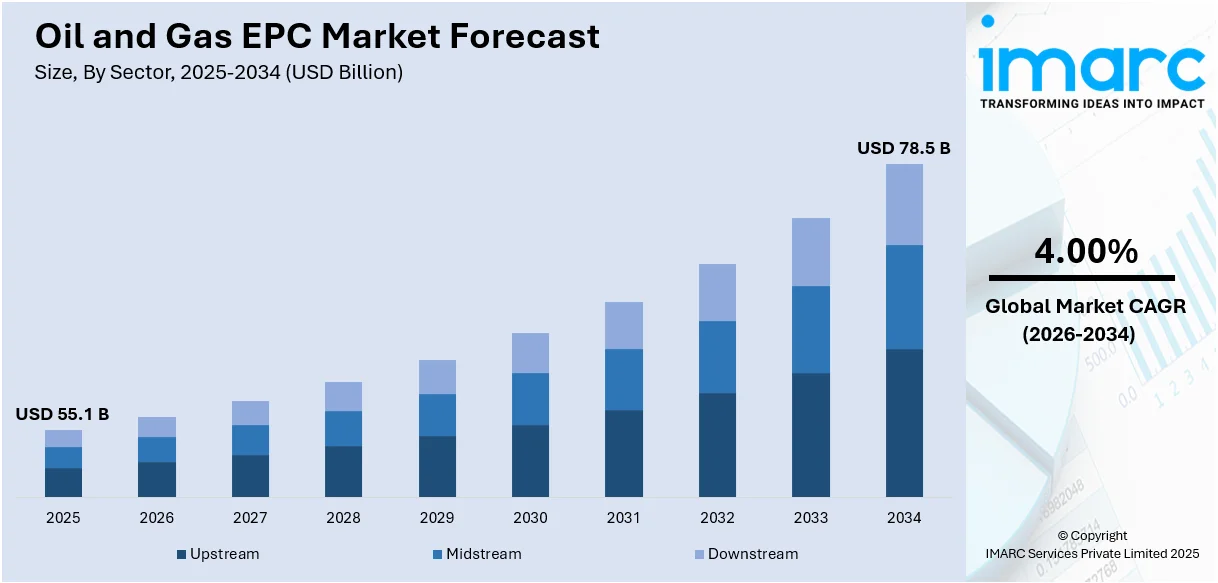
The global oil and gas EPC market size reached USD 55.1 Billion in 2025. Looking forward, IMARC Group expects the market to reach USD 78.5 Billion by 2034, exhibiting a growth rate (CAGR) of 4.00% during 2026-2034. The market is driven by rising global energy demand, technological advancements, and stringent regulatory policies.
|
Report Attribute
|
Key Statistics
|
|---|---|
|
Base Year
|
2025
|
|
Forecast Years
|
2026-2034
|
|
Historical Years
|
2020-2025
|
|
Market Size in 2025
|
USD 55.1 Billion |
|
Market Forecast in 2034
|
USD 78.5 Billion |
| Market Growth Rate 2026-2034 | 4.00% |
Oil and Gas EPC Market Analysis:
- Market Growth and Size: The global oil and gas EPC market is experiencing significant growth, driven by the increasing demand for energy worldwide. With the surge in exploration and production activities, particularly in offshore and unconventional reserves, the market is expanding to meet the needs for new infrastructure and technology upgrades.
- Major Market Drivers: Key drivers include the escalating global energy demand, particularly in developing countries, and technological advancements in exploration and production, such as hydraulic fracturing and horizontal drilling. Additionally, stringent regulatory policies focusing on safety and environmental sustainability are compelling oil and gas companies to invest in compliant and advanced infrastructure, further propelling the EPC market.
- Key Market Trends: The market is witnessing a trend toward the adoption of digital technologies like AI, IoT, and cloud computing for improved efficiency and cost-effectiveness. There is also a growing emphasis on sustainable practices, with investments in carbon capture and storage technologies and the integration of renewable energy sources.
- Geographical Trends: North America, particularly the United States with its shale revolution, is a significant market, while the Asia Pacific region is rapidly growing due to increasing energy consumption in countries like China and India. Europe remains focused on sustainable solutions, whereas the Middle East and Africa continue to invest in their vast conventional reserves.
- Competitive Landscape: The market is characterized by the presence of both global and regional players, with major companies engaging in strategic collaborations, technological innovation, and geographic expansion. The competitive landscape is also shaped by mergers and acquisitions, allowing companies to diversify services and access new markets.
- Challenges and Opportunities: Challenges include geopolitical risks, fluctuating oil prices, and the complexity of projects in harsh environments. However, these challenges also present opportunities for EPC companies to innovate and adapt, offering advanced solutions and tapping into emerging markets, especially in regions with increasing energy needs and infrastructural developments.
To get more information on this market Request Sample
Oil and Gas EPC Market Trends:
Global energy demand growth
The oil and gas engineering, procurement, and construction (EPC) market is primarily driven by the escalating global energy demand. As the global population grows and economies expand, the need for energy intensifies, particularly in developing countries. This increased demand fuels the exploration and production activities in the oil and gas sector, necessitating expanded infrastructure and new projects. EPC companies are integral to this expansion, offering end-to-end services from design to execution, thus benefiting from the growing energy requirements. This demand is being witnessed in both traditional oil and gas resources and unconventional resources like shale gas, requiring specialized EPC services for extraction and processing.
Technological advancements in exploration and production
Technological advancements play a crucial role in shaping the oil and gas EPC market. The development of new technologies, such as hydraulic fracturing and horizontal drilling, has revolutionized the industry, enabling access to previously unreachable reserves. This technological progression has led to the discovery of new oil and gas fields, especially in remote and deep-water locations. EPC companies are at the forefront of integrating these technologies into their projects, improving efficiency and reducing operational costs. The incorporation of digital tools like artificial intelligence (AI) and the Internet of Things (IoT) for project management and predictive maintenance further drives the EPC market by enhancing project execution and reducing time frames, making EPC services more attractive to oil and gas companies.
Regulatory policies and environmental considerations
The regulatory landscape significantly impacts the oil and gas EPC market. Governments worldwide are implementing stringent regulations regarding safety, emissions, and environmental protection. These regulations compel oil and gas companies to modify existing infrastructure and invest in new, compliant facilities. EPC providers, with their expertise in regulatory norms and sustainable practices, become essential partners for these companies. Moreover, the shift toward cleaner energy and the need for carbon footprint reduction in operations has prompted the EPC sector to innovate in providing environmentally friendly solutions. This includes the development of carbon capture and storage (CCS) technologies and the integration of renewable energy sources into oil and gas operations, broadening the market scope for EPC services.
Oil and Gas EPC Industry Segmentation:
IMARC Group provides an analysis of the key trends in each segment of the market, along with forecasts at the global, regional, and country levels for 2026-2034. Our report has categorized the market based on sector, service type, and location.
Breakup by Sector:
- Upstream
- Midstream
- Downstream
Upstream accounts for the majority of the market share
The report has provided a detailed breakup and analysis of the market based on the sector. This includes upstream, midstream, and downstream. According to the report, upstream represented the largest segment.
The upstream sector encompasses activities related to exploration and production (E&P). The dominance of the sector is attributed to the extensive exploration activities for new oil and gas reserves, driven by the global rise in energy demand. EPC services in the upstream sector involve complex and technologically advanced projects, ranging from seismic surveys and geological modeling to drilling and well completion. The focus on unconventional resources like shale gas and deep-water reserves further amplifies the demand for specialized EPC services. Companies operating in this segment are heavily investing in innovative technologies to improve exploration success rates and optimize production efficiency, ensuring their competitive edge in the market.
The midstream sector in the oil and gas EPC market covers transportation and storage infrastructure, an essential link between upstream production and downstream processing. This segment includes the development of pipelines, storage facilities, and transportation systems for crude oil, natural gas, and refined products. The growth in this segment is fueled by the need to expand the transportation network to connect new production areas with processing facilities and markets. Additionally, the increasing trade of liquefied natural gas (LNG) globally has spurred investments in LNG terminals and related infrastructure. EPC companies in the midstream sector are focusing on building efficient and secure transportation systems, often incorporating advanced monitoring and automation technologies to ensure safety and regulatory compliance.
The downstream sector involves the processing, refining, and distribution of petroleum products. This sector is characterized by the construction and maintenance of refineries, petrochemical plants, and distribution networks. The demand in this segment is influenced by the need for more sophisticated and environmentally compliant refining processes, as well as the expansion of petrochemical product ranges. EPC services in the downstream sector are increasingly adopting digital solutions for process optimization and are investing in modernization projects to meet stringent environmental regulations. The focus is also on retrofitting existing facilities to improve efficiency and reduce the environmental impact, catering to the evolving market demands and regulatory landscape.
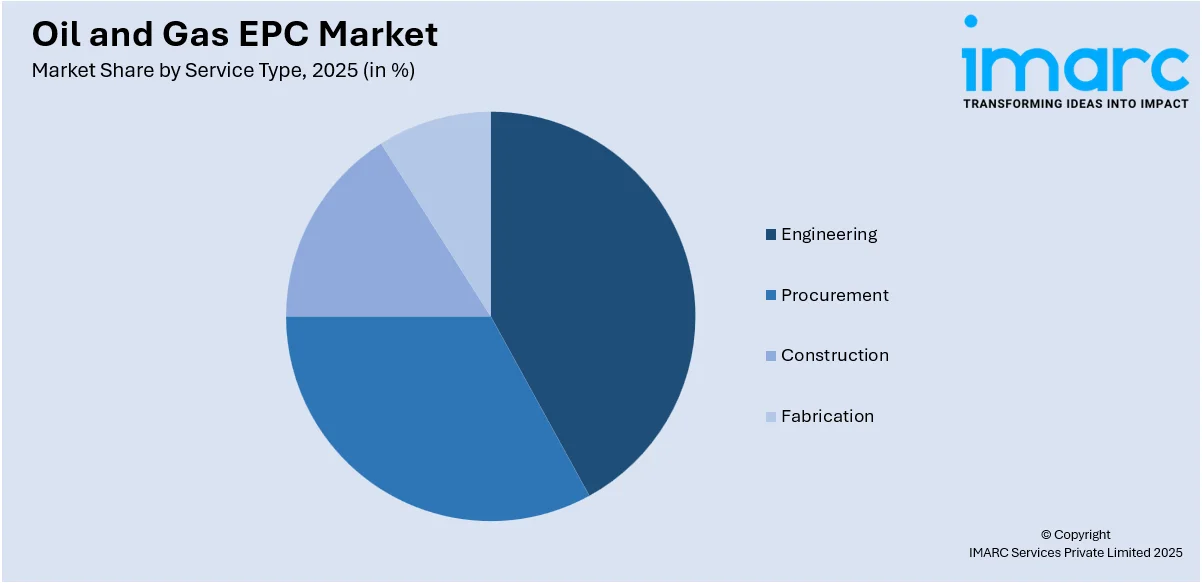
Breakup by Service Type:
Access the comprehensive market breakdown Request Sample
- Engineering
- Procurement
- Construction
- Fabrication
Construction holds the largest share in the industry
A detailed breakup and analysis of the market based on the service type have also been provided in the report. This includes engineering, procurement, construction, and fabrication. According to the report, construction accounted for the largest market share.
The construction services segment involves the building and installation of infrastructure. The growth in this segment is attributed to the extensive labor and material resources required for constructing oil and gas facilities, ranging from drilling rigs and production platforms to pipelines and refineries. Companies in this segment are often challenged with executing complex projects in diverse and sometimes harsh environments. They are increasingly adopting modular construction techniques, advanced machinery, and automation to enhance efficiency, reduce project timelines, and ensure worker safety. The construction phase is critical for the overall success of the project, demanding high levels of expertise and project management capabilities.
Engineering services encompass the initial design and planning stages of a project. This segment involves a range of activities, from feasibility studies and conceptual design to detailed engineering and project management. The demand for engineering services is driven by the need for innovative and efficient designs that can optimize operations and reduce costs. With the increasing complexity of oil and gas projects, especially in challenging environments like deep-water locations, expertise in advanced engineering methodologies and digital tools becomes critical. This segment is vital for ensuring that projects are technically feasible, cost-effective, and compliant with environmental and safety standards.
Procurement services in the oil and gas EPC market involve the sourcing and supply of materials, equipment, and services required for project execution. This segment plays a crucial role in ensuring the timely and cost-effective availability of quality resources. The complexity of oil and gas projects demands specialized procurement strategies to manage the logistics and supply chain effectively. Companies offering procurement services are increasingly leveraging digital platforms and data analytics to enhance supply chain efficiency, reduce costs, and ensure timely delivery. The focus is also on establishing strong relationships with suppliers and vendors to ensure the reliability and quality of the materials and services procured.
Fabrication services in the oil and gas EPC market pertain to the creation of components and structures required for oil and gas projects. This segment involves activities such as welding, metalworking, and assembling parts for use in various applications like offshore platforms and pipeline systems. Fabrication plays a key role in the overall project lifecycle, with a focus on quality, precision, and adherence to industry standards. The demand in this segment is influenced by the need for custom-made, durable, and high-performance components that can withstand the demanding conditions of oil and gas operations. Companies offering fabrication services are continuously evolving their techniques and technologies to meet the specific needs of complex and large-scale projects.

Breakup by Location:
- Onshore
- Offshore
Offshore represents the leading market segment
The report has provided a detailed breakup and analysis of the market based on the location. This includes onshore and offshore. According to the report, offshore represented the largest segment.
The offshore segment deals with projects located in sea or ocean beds. The dominance of this segment is largely due to the increasing exploration and production activities in offshore reserves, driven by the depletion of onshore resources and the technological advancements enabling deep-water drilling. Offshore projects are inherently complex and challenging, requiring specialized engineering, advanced equipment, and robust construction practices to withstand harsh marine environments. The segment includes the development of platforms, subsea pipelines, and floating production systems. EPC companies in this sector are continually innovating to improve safety, environmental sustainability, and efficiency in offshore operations. The high capital investment and technical expertise required for offshore projects contribute to the market growth in this segment.
The onshore segment encompasses projects located on land. This segment includes the construction and maintenance of oil and gas fields, refineries, pipelines, and storage facilities on terrestrial sites. While onshore projects are generally less complex and costly than offshore ones, they are crucial for the continuous supply of oil and gas. The onshore segment benefits from easier accessibility, lower development costs, and a broader range of applicable technologies compared to offshore operations. Recent advancements in extraction technologies, such as hydraulic fracturing and horizontal drilling, have revitalized onshore oil and gas production, especially in regions rich in shale reserves. EPC companies in the onshore segment focus on optimizing project execution through cost-effective solutions and technological integration, catering to the global demand for energy resources.
Breakup by Region:
- North America
- United States
- Canada
- Asia-Pacific
- China
- Japan
- India
- South Korea
- Australia
- Indonesia
- Others
- Europe
- Germany
- France
- United Kingdom
- Italy
- Spain
- Russia
- Others
- Latin America
- Brazil
- Mexico
- Others
- Middle East and Africa
The market research report has also provided a comprehensive analysis of all the major regional markets, which include North America (the United States and Canada); Asia Pacific (China, Japan, India, South Korea, Australia, Indonesia, and others); Europe (Germany, France, the United Kingdom, Italy, Spain, Russia, and others); Latin America (Brazil, Mexico, and others); and the Middle East and Africa.
In North America, the oil and gas EPC market is significantly driven by substantial oil and natural gas reserves available in the region. The United States, in particular, has seen a resurgence in its oil and gas industry due to advancements in extraction technologies like hydraulic fracturing and horizontal drilling, especially in shale formations. The Canadian market is influenced by its vast oil sands reserves and LNG projects. The presence of major oil and gas companies and EPC contractors, coupled with favorable governmental policies, supports the growth of the North America EPC market. The focus on reducing environmental impact and implementing modern technologies in operations further characterizes the market.
The Asia Pacific region represents a rapidly growing segment of the global oil and gas EPC market. This growth is fueled by increasing energy consumption due to rapid industrialization and urbanization, particularly in China and India. Significant investments in exploring and developing new oil and gas fields, along with upgrading existing infrastructure, drive the demand for EPC services. The growing focus on LNG projects in Australia and the expanding oil and gas sector in Indonesia also contribute significantly to the market. The diverse and competitive landscape in the region offers substantial opportunities for EPC companies, especially in integrating innovative and sustainable technologies.
The Europe oil and gas EPC market is influenced by the mature oil and gas fields in the region, the need for technological upgrades in infrastructure, and stringent environmental regulations. Countries like Norway, the United Kingdom, and Russia play significant roles due to their substantial offshore reserves. The market is also driven by the focus on sustainable and efficient energy solutions in the region, including the integration of renewable energy sources and the development of green technologies. European EPC companies are leaders in deploying advanced technologies and engineering solutions, catering to both regional and global markets.
The Latin America oil and gas EPC market is predominantly driven by activities in countries like Brazil and Mexico. The deep-water pre-salt oil fields in Brazil and reforms in the energy sector in Mexico are key growth drivers. The region holds considerable untapped reserves, presenting substantial opportunities for EPC projects. However, political and economic instability can be challenging, impacting investments and project execution. The market growth is contingent on governmental policies, foreign investments, and technological advancements in exploiting complex reserves.
The Middle East and Africa region, with its vast conventional oil and gas reserves, is a crucial player in the global EPC market. The Middle East, particularly countries like Saudi Arabia, the UAE, and Qatar, continues to invest heavily in expanding and upgrading its oil and gas infrastructure. The market in Africa, while smaller, is growing, with countries like Nigeria and Angola investing in developing their oil and gas sectors. The market in the region is characterized by large-scale projects, often with state-owned oil companies playing a significant role. Despite geopolitical risks, the market potential in the Middle East and Africa remains high, driven by ongoing investments in both onshore and offshore projects.
Leading Key Players in the Oil and Gas EPC Industry:
The leading companies in the oil and gas EPC market are actively engaging in strategic collaborations and technological innovation and expanding their geographical reach to strengthen their market position. They are focusing on integrating advanced technologies like AI, IoT, and cloud computing to enhance efficiency, reduce project timelines, and lower operational costs. Moreover, in response to the increasing environmental concerns and regulatory requirements, these companies are investing in sustainable practices, including the development of carbon capture and storage technologies. Partnerships and acquisitions are also prevalent, allowing these companies to diversify their services and tap into emerging markets, particularly in developing countries with growing energy needs.
The market research report has provided a comprehensive analysis of the competitive landscape. Detailed profiles of all major companies have also been provided. Some of the key players in the market include:
- Bechtel Corporation
- Fluor Corporation
- John Wood Group PLC
- KBR Inc.
- Larsen & Toubro Limited
- McDermott
- NMDC Group
- Petrofac Limited
- SAIPEM SpA
- Samsung E&A
- TechnipFMC plc
- Técnicas Reunidas S. A.
- Worley
(Please note that this is only a partial list of the key players, and the complete list is provided in the report.)
Latest News:
- December 2024: Samsung E&A won a contract worth USD 955 million to develop a biorefinery in Malaysia, marking its first venture into the Sustainable Aviation Fuel (SAF) market. This facility will process approximately 650,000 tons of raw materials annually to produce SAF, Renewable Diesel (HVO), and bio-naphtha. The project is part of a joint venture that includes PETRONAS and Euglena Co., Ltd., and aims to utilize waste feedstocks like used vegetable oils and animal fats.
- November 2024: NMDC Group UAE was awarded a USD 300 million contract for EPC by TA’ZIZ, a UAE-based chemical production company. The project included the development of an exclusive chemicals port for developing a chemicals and transition fuels ecosystem.
- October 2024: Petrofac secured a two-year multi-million-dollar contract to expand its production in Bahrain. The contract was awarded by Bapco Upstream W.L.L. Under this contract, Petrofac was entrusted to support Bapco’s production plans, to cater to the gas demands for the country, through the delivery of pipelines, well hook-ups, and tie-ins for multiple new wells in the Bahrain Field.
Oil and Gas EPC Market Report Scope:
| Report Features | Details |
|---|---|
| Base Year of the Analysis | 2025 |
| Historical Period | 2020-2025 |
| Forecast Period | 2026-2034 |
| Units | Billion USD |
| Scope of the Report | Exploration of Historical Trends and Market Outlook, Industry Catalysts and Challenges, Segment-Wise Historical and Future Market Assessment:
|
| Sectors Covered | Upstream, Midstream, Downstream |
| Service Types Covered | Engineering, Procurement, Construction, Fabrication |
| Locations Covered | Onshore, Offshore |
| Regions Covered | Asia Pacific, Europe, North America, Latin America, Middle East and Africa |
| Countries Covered | United States, Canada, Germany, France, United Kingdom, Italy, Spain, Russia, China, Japan, India, South Korea, Australia, Indonesia, Brazil, Mexico |
| Companies Covered | Bechtel Corporation, Fluor Corporation, John Wood Group PLC, KBR Inc., Larsen & Toubro Limited, McDermott, NMDC Group, Petrofac Limited, SAIPEM SpA, Samsung E&A, TechnipFMC plc, Técnicas Reunidas S. A., Worley, etc. |
| Customization Scope | 10% Free Customization |
| Post-Sale Analyst Support | 10-12 Weeks |
| Delivery Format | PDF and Excel through Email (We can also provide the editable version of the report in PPT/Word format on special request) |
Key Benefits for Stakeholders:
- IMARC’s industry report offers a comprehensive quantitative analysis of various market segments, historical and current market trends, market forecasts, and dynamics of the oil and gas EPC market from 2020-2034.
- The research report provides the latest information on the market drivers, challenges, and opportunities in the global oil and gas EPC market.
- The study maps the leading, as well as the fastest-growing, regional markets. It further enables stakeholders to identify the key country-level markets within each region.
- Porter's five forces analysis assists stakeholders in assessing the impact of new entrants, competitive rivalry, supplier power, buyer power, and the threat of substitution. It helps stakeholders to analyze the level of competition within the oil and gas EPC industry and its attractiveness.
- The competitive landscape allows stakeholders to understand their competitive environment and provides insight into the current positions of key players in the market.
Frequently Asked Questions About the Oil & Gas EPC Market Report
The global oil and gas EPC market was valued at USD 55.1 Billion in 2025.
We expect the global oil and gas EPC market to exhibit a CAGR of 4.00% during 2026-2034.
The rising demand for oil and gas EPC, as it allows the owners to manage all the relationships and infrastructure projects with enhanced performance, flexibility, cost-effectiveness, a single point of responsibility, etc., is primarily driving the global oil and gas EPC market.
The sudden outbreak of the COVID-19 pandemic had led to the implementation of stringent lockdown regulations across several nations, resulting in the temporary closure of numerous oil and gas industries, thereby negatively impacting the global market for oil and gas EPC.
Based on the sector, the global oil and gas EPC market can be segmented into upstream, midstream, and downstream. Currently, the upstream sector holds the majority of the total market share.
Based on the service type, the global oil and gas EPC market has been divided into engineering, procurement, construction, and fabrication. Among these, construction currently exhibits a clear dominance in the market.
Based on the location, the global oil and gas EPC market can be categorized into onshore and offshore. Currently, offshore accounts for the largest market share.
On a regional level, the market has been classified into North America, Asia-Pacific, Europe, Latin America, and Middle East and Africa.
Some of the major players in the global oil and gas EPC market include Bechtel Corporation, Fluor Corporation, John Wood Group PLC, KBR Inc., Larsen & Toubro Limited, McDermott, NMDC Group, Petrofac Limited, SAIPEM SpA, Samsung E&A, TechnipFMC plc, Técnicas Reunidas S. A., and Worley.
Need more help?
- Speak to our experienced analysts for insights on the current market scenarios.
- Include additional segments and countries to customize the report as per your requirement.
- Gain an unparalleled competitive advantage in your domain by understanding how to utilize the report and positively impacting your operations and revenue.
- For further assistance, please connect with our analysts.
 Request Customization
 Speak to an Analyst
 Request Brochure
 Inquire Before Buying
Benefits of Customization
- Personalize this research
- Triangulate with your data
- Get data as per your format and definition
- Gain a deeper dive into a specific application, geography, customer, or competitor
- Any level of personalization
Get in Touch With Us
UNITED STATES
Phone: +1-201-971-6302
INDIA
Phone: +91-120-433-0800
UNITED KINGDOM
Phone: +44-753-714-6104
Email: [email protected]
Client Testimonials


.webp)


