
Oleochemicals Market Size, Share, Trends and Forecast by Type, Form, Application, Feedstock, and Region, 2026-2034
Oleochemicals Market Size, Share, Trends & Forecast (2026-2034)
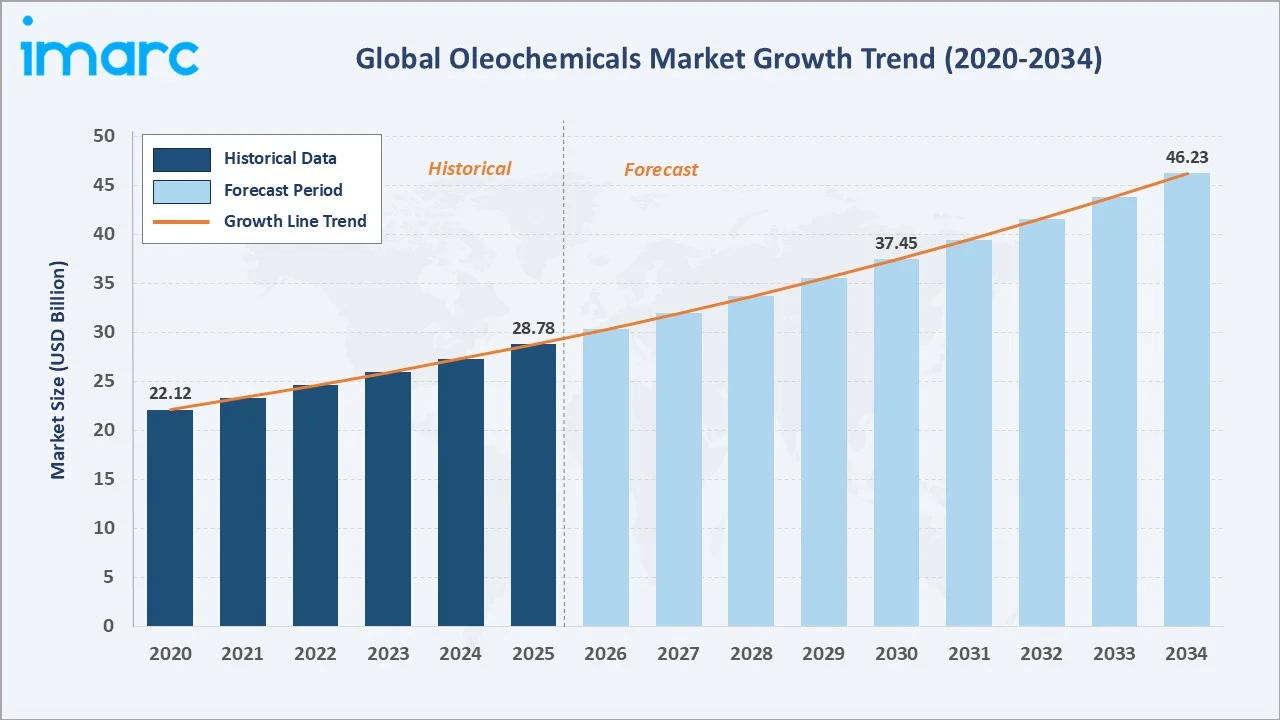
The global oleochemicals market reached USD 28.78 Billion in 2025 and is projected to reach USD 46.23 Billion by 2034, growing at a CAGR of 5.41% during 2026-2034. Rising demand from the soap and detergent industry, the structural shift from petrochemical to bio-based surfactants, expanding personal care consumption across Asia Pacific, and growing adoption in lubricants, plastics, and coatings are the primary growth catalysts.
Market Snapshot
|
Metric |
Value |
|
Market Size (2025) |
USD 28.78 Billion |
|
Forecast Market Size (2034) |
USD 46.23 Billion |
|
CAGR (2026-2034) |
5.41% |
|
Base Year |
2025 |
|
Historical Period |
2020-2025 |
|
Forecast Period |
2026-2034 |
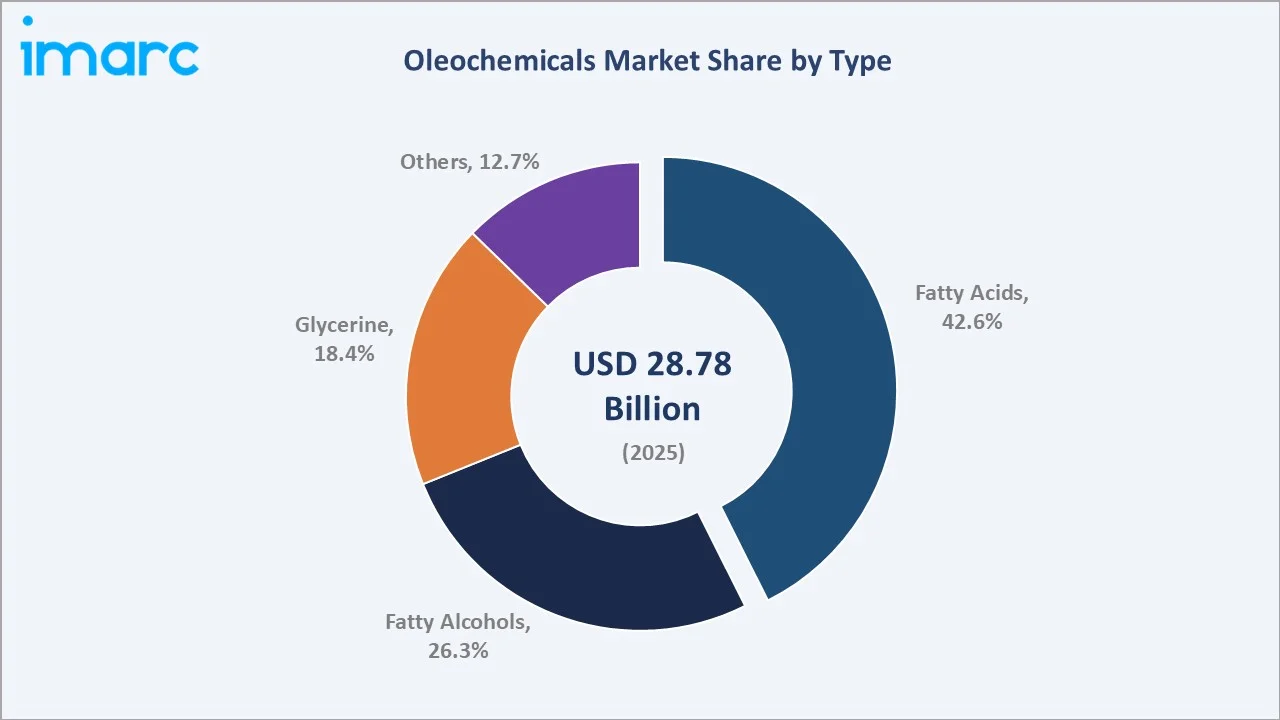
Asia Pacific leads regionally with a 46.8% share in 2025, anchored by Indonesia and Malaysia's palm oil feedstock supply and expanding downstream consumption in China and India. Fatty Acids command the dominant type segment at 42.6%, while liquid form accounts for 64.8% of the form breakdown, reflecting consumption in personal care, lubricants, and detergent formulations.
To get more information on this market, Request Sample
The market grew from USD 22.12 Billion in 2020 to USD 28.78 Billion in 2025, reflecting a historical CAGR of approximately 5.07%. The forecast period 2026–2034 is anchored by accelerating bio-based surfactant adoption, expanding palm and palm-kernel oil-based fatty acid and fatty alcohol capacity in Southeast Asia, and the structural shift in detergent and personal care formulations away from petrochemical alternatives toward renewable oleochemical feedstocks.
Executive Summary
The global oleochemicals market is experiencing steady, sustained expansion driven by converging demand from the soap and detergent industry, personal care and cosmetics, lubricants and greases, plastics additives, and coatings end-use sectors. The market reached USD 28.78 Billion in 2025 and is forecast to reach USD 46.23 Billion by 2034, growing at a CAGR of 5.41%. The growth trajectory is underpinned by the global pivot toward bio-based and renewable raw materials, accelerated by sustainability commitments from FMCG majors and regulatory pressure on petrochemical-based surfactants.
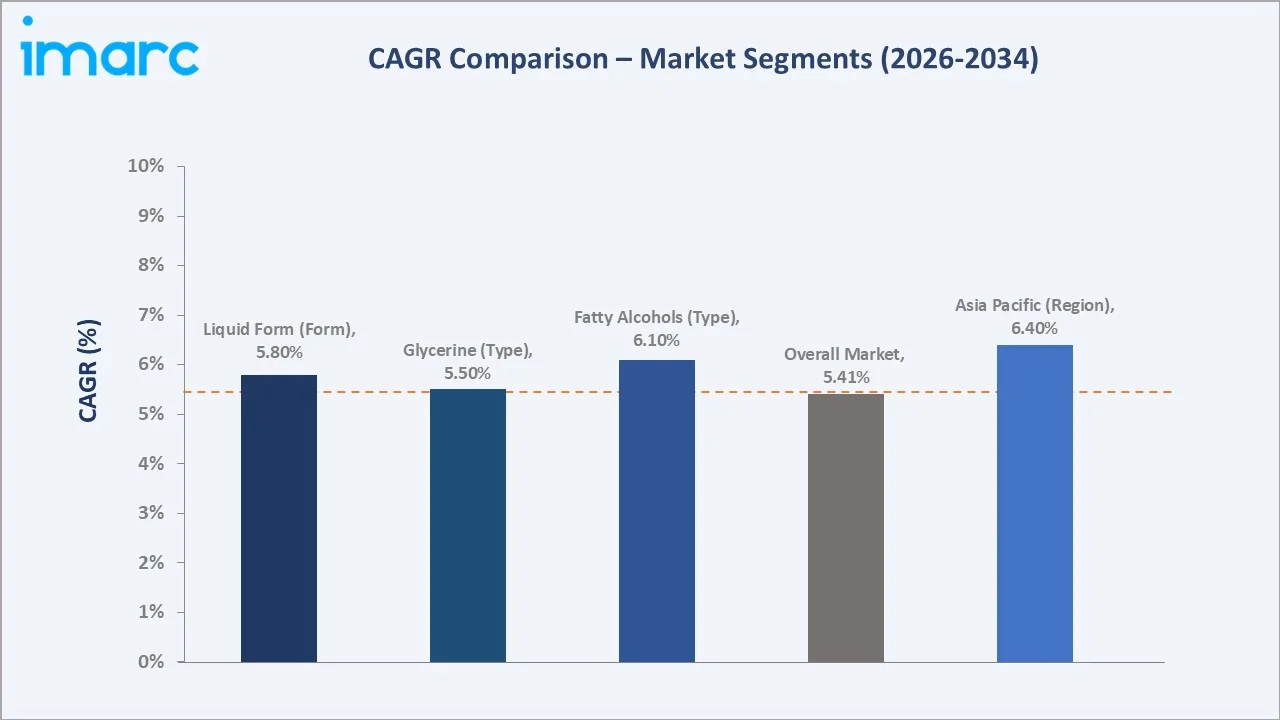
Fatty acids dominate the type segment with a 42.6% share in 2025, reflecting their indispensable role in soap manufacturing, candle production, rubber processing, and as intermediates for fatty alcohols and esters. Fatty alcohols at 26.3% and glycerin at 18.4% represent the next-largest type categories, each anchored by large addressable end-use markets in surfactants, personal care, and pharmaceutical applications, respectively.
Liquid form leads at 64.8%, supported by process-integration advantages in surfactant production, lubricant blending, and personal care formulation. Asia Pacific commands 46.8% of the regional share, driven by Indonesia and Malaysia's combined palm oil production exceeding 66 million metric tons annually. Key players including Wilmar International Ltd, Kuala Lumpur Kepong Berhad, IOI Corporation Berhad, Kao Corporation, and VVF Group compete through capacity expansion, RSPO sustainability certification, and downstream specialty product innovation.
Key Market Insights
|
Insight |
Data |
|
Largest Type Segment |
Fatty Acids – 42.6% share (2025) |
|
Fastest Growing Type |
Fatty Alcohols – ~6.1% CAGR (2026-2034) |
|
Largest Form Segment |
Liquid – 64.8% share (2025) |
|
Fastest Growing Form |
Liquid – ~5.8% CAGR (2026-2034) |
|
Leading Region |
Asia Pacific – 46.8% share (2025) |
|
Top Companies |
Wilmar International Ltd, Kuala Lumpur Kepong Berhad, IOI Corporation Berhad, Kao Corporation, and VVF Group. |
Key Analytical Observations Supporting the Above Data:
- Fatty acids at 42.6% (2025) reflect the segment's dominant role in soap manufacturing, rubber processing, candles, and as upstream intermediates for fatty alcohols and esters. The segment benefits from the structurally large global soap and detergent industry, which alone consumes more than 35% of global fatty acid output annually.
- Fatty alcohols at 26.3% (2025), growing at approximately 6.1% CAGR, represent the highest-growth type segment, driven by accelerating demand for bio-based surfactants in laundry detergents, dishwashing liquids, and personal care formulations, particularly as petrochemical-based alternatives face regulatory and consumer-driven displacement.
- Liquid form at 64.8% (2025) reflects its compatibility with continuous-flow manufacturing in surfactant, lubricant, and cosmetics operations. Liquid oleochemicals offer superior process integration, reduced melting energy requirements, and direct compatibility with industry-standard pipeline and tank-truck logistics.
- Asia Pacific's 46.8% share (2025) is structurally anchored by Indonesia (producing approximately 47 million tons of palm oil annually) and Malaysia (approximately 19 million tons), which together supply more than 80% of global palm and palm kernel-based oleochemical feedstock.
Oleochemicals Market Overview
Oleochemicals are chemical compounds derived from natural fats and oils, including vegetable oils (palm, palm kernel, coconut, soy, rapeseed, sunflower) and animal fats (tallow). The global oleochemicals market encompasses four core type categories: fatty acids, fatty alcohols, glycerin, and others, produced through hydrolysis, hydrogenation, and transesterification of triglycerides.
Oleochemicals serve as renewable, bio-based substitutes for petrochemical surfactants, plasticizers, and intermediates across soaps and detergents, plastics, paper, lubricants, rubber, coatings and resins, and personal care end-use industries.
The market is shaped by three structural forces: the global pivot toward renewable raw materials, accelerated by sustainability commitments from Unilever, P&G, and L'Oréal; palm and palm kernel oil feedstock economics in Southeast Asia sustaining cost competitiveness versus petrochemicals; and expanding consumption in emerging markets across Asia Pacific, Latin America, and the Middle East driven by rising disposable income and per-capita personal care usage.
Market Dynamics
To evaluate market opportunities, Request Sample
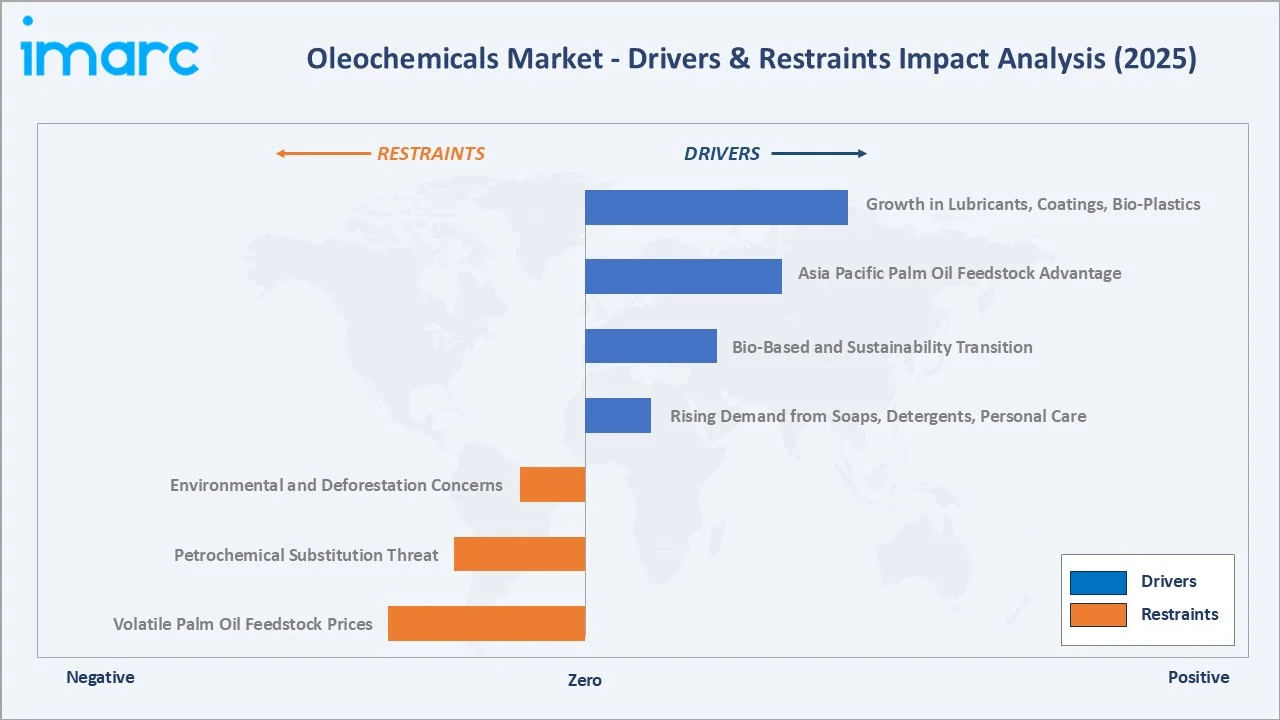
Market Drivers
- Rising Demand from Soaps, Detergents, and Personal Care: The global bath soap market size was valued at USD 25.5 Billion in 2025. Soaps & detergents consume more than one-third of global fatty acid and fatty alcohol output.
- Bio-Based and Sustainability Transition: Global FMCG and chemical companies have committed to renewable feedstocks, with Unilever targeting 100% bio-based or recycled-content surfactants by 2030.
- Asia Pacific Palm Oil Feedstock Advantage: Indonesia and Malaysia's combined palm and palm kernel oil output, exceeding 66 million metric tons annually, provides a cost-competitive renewable feedstock base.
- Growth in Lubricants, Coatings, and Bio-Plastics: Bio-based lubricants, polyols for polyurethane, and bio-plasticizer applications are expanding the addressable market beyond traditional surfactant and soap end-uses, opening higher-margin specialty segments.
Market Restraints
- Volatile Palm Oil Feedstock Prices: Malaysian crude palm oil futures settled at USD 998.00 per metric ton at the end of November 2025, marking a decline of USD 8.50 compared to the previous month. This directly affects production economics. Weather events, Indonesian export policies, and biodiesel mandate-driven feedstock diversion compound price volatility.
- Petrochemical Substitution Threat: Synthetic fatty alcohols and surfactants derived from ethylene and propylene compete on cost in non-sustainability-driven applications. Oil price downturns can temporarily erode oleochemicals' price competitiveness.
- Environmental and Deforestation Concerns: Palm oil's association with deforestation creates downstream reputational and regulatory risk for producers reliant on uncertified feedstock. RSPO certification adds 5–10% to feedstock costs but is increasingly mandatory for European and North American customers.
Market Opportunities
- Specialty and High-Value Derivatives: Esters, ethoxylates, sulfates, and methyl ester sulfonates command 2–4× the margin of commodity fatty acids and offer significant growth headroom in personal care, pharmaceuticals, and industrial applications.
- India's Expanding Oleochemicals Demand: India's per-capita personal care and household cleaning consumption is projected to grow at 9–11% CAGR through 2030, creating substantial domestic demand pull incentivizing capacity expansion.
Market Challenges
- Regulatory and Certification Complexity: Compliance with RSPO, ISCC, REACH, and US FDA requirements imposes documentation, traceability, and audit costs that challenge smaller and mid-tier manufacturers.
- Glycerin Market Oversupply: Crude glycerin, a by-product of biodiesel and soap production, has faced periodic oversupply driven by global biodiesel mandate expansion, compressing glycerin prices and producer margins.
Emerging Market Trends
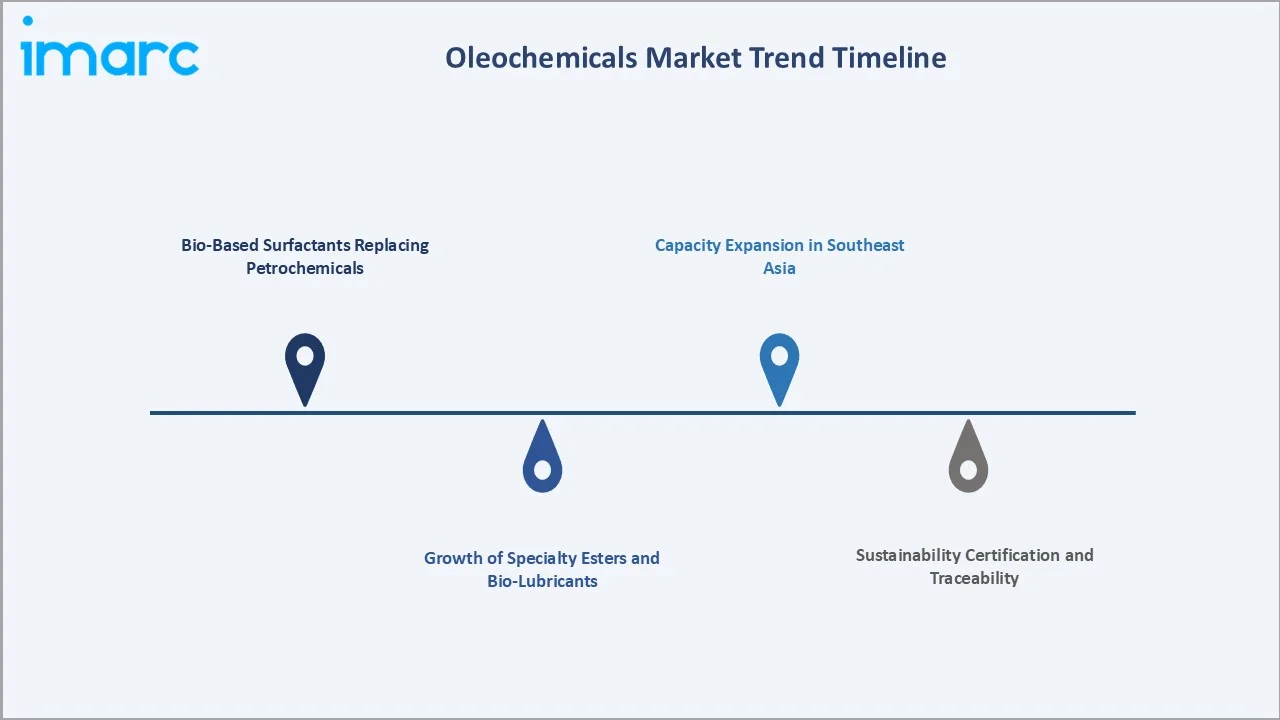
1. Bio-Based Surfactants Replacing Petrochemicals
Global personal care and detergent majors are systematically transitioning to fatty alcohol ethoxylates, methyl ester sulfonates, and other bio-based surfactants. Unilever, Procter & Gamble, and L'Oréal have published 2030 commitments to source 95%-100% bio-based or recycled-content surfactants, creating structural multi-billion-dollar demand pull for oleochemical-derived alternatives.
2. Capacity Expansion in Southeast Asia
In May 2025, Louis Dreyfus Company inaugurated a new glycerin refining plant and edible oil packaging line in Lampung, Indonesia, to expand its downstream operations and strengthen its global supply chain capabilities. The new facilities are expected to support rising demand for USP-grade glycerin and packaged edible oils.
3. Sustainability Certification and Traceability
As of December 2025, RSPO has enabled the certification of 5.1 million hectares of oil palm plantations in 24 countries, establishing a global benchmark for sustainable palm oil production, with Unilever sustainably sourcing 82% of its core palm oil volumes, including full sourcing coverage for palm oil and 64% for palm kernel oil and related derivatives, with 62% obtained from certified sources.
4. Growth of Specialty Esters and Bio-Lubricants
The bio-lubricants segment, expanding at approximately 7.5% CAGR through 2034, is creating a high-margin specialty growth vector. Methyl esters of palm-derived fatty acids serve as base stocks for biodegradable lubricants in marine, agricultural, and food-processing applications.
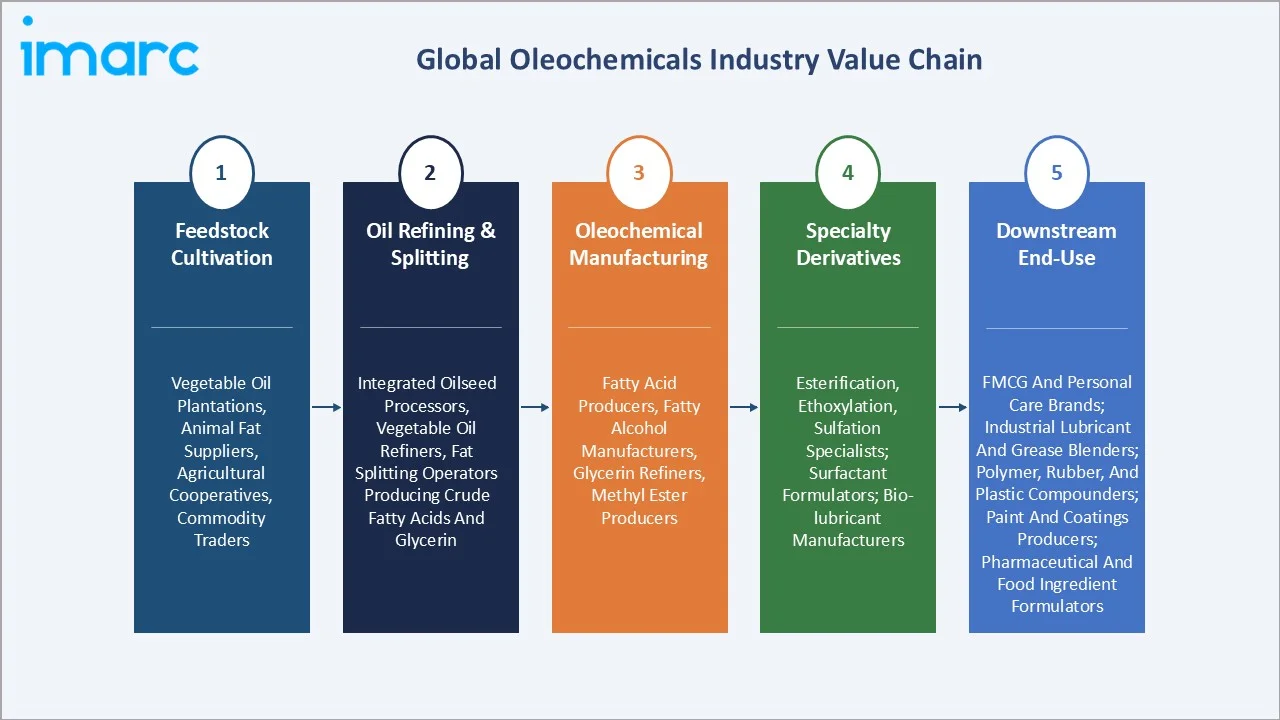
Industry Value Chain Analysis
The oleochemicals value chain spans agricultural feedstock cultivation through downstream specialty chemical and FMCG manufacturing, with significant value creation occurring at the oil refining, splitting, and downstream derivatization stages. Sustainability certification (RSPO for palm-based feedstock) is increasingly a value-chain prerequisite for European and North American end-users.
|
Stage |
Key Players / Examples |
|
Feedstock Cultivation |
Vegetable oil plantations; animal fat suppliers; agricultural cooperatives and commodity traders |
|
Oil Refining & Splitting |
Integrated oilseed processors; vegetable oil refiners; fat splitting and hydrolysis operators producing crude fatty acids and glycerin |
|
Oleochemical Manufacturing |
Fatty acid producers; fatty alcohol manufacturers; glycerin refiners; methyl ester producers; specialty oleochemical processors |
|
Specialty Derivatives |
Esterification, ethoxylation, and sulfation specialists; surfactant and emulsifier formulators; bio-lubricant and bio-plasticizer manufacturers |
|
Downstream End-Use |
FMCG and personal care brands; industrial lubricant and grease blenders; polymer, rubber, and plastic compounders; paint and coatings producers; pharmaceutical and food ingredient formulators |
Technology Landscape in the Oleochemicals Industry
Fatty Acid Splitting and Fractionation
High-pressure fat splitting using the Colgate-Emery continuous countercurrent process remains the dominant industrial route, hydrolyzing triglycerides at 250–260°C and 50–60 bar to produce mixed fatty acids and crude glycerin. Subsequent fractional distillation under vacuum separates fatty acids by chain length (C8–C18), with leading operators deploying multi-column distillation trains to achieve pharmaceutical- and personal-care-grade purity.
Fatty Alcohol Hydrogenation
Fatty alcohols are produced via high-pressure catalytic hydrogenation of methyl esters or fatty acids over copper-chromite or copper-zinc catalysts at 200–300°C and 200–300 bar. The technology shift toward bio-based ethoxylates and methyl ester sulfonates is driving capacity additions in Malaysia and Indonesia to serve global surfactant demand.
Glycerin Refining and Purification
Crude glycerin, recovered as a co-product from fat splitting and biodiesel production, undergoes evaporation, ion-exchange, and vacuum distillation to produce technical-, USP-, and pharmaceutical-grade refined glycerin (>99.5% purity). Refining integration with upstream splitting operations is the dominant value-capture model, while specialist refiners serve regional pharmaceutical and food customers.
Bio-Based and Enzymatic Process Innovation
Enzymatic fat splitting using immobilized lipases and biocatalytic esterification routes are emerging as energy-efficient alternatives to high-pressure thermal processes, reducing energy intensity by 30–40% and enabling production of specialty mono- and di-glycerides for personal care and food applications.
Market Segmentation Analysis
The report covers the following segments:
|
Segment Category |
Leading Segment |
Market Share |
Year |
|
Type |
Fatty Acids |
42.6% |
2025 |
|
Form |
Liquid |
64.8% |
2025 |
|
Application |
🔒 |
🔒 |
2025 |
|
Feedstock |
🔒 |
🔒 |
2025 |
|
Region |
Asia Pacific |
46.8% |
2025 |

By Type
Fatty acids dominate the type segment with a 42.6% share in 2025. This category encompasses stearic acid, palmitic acid, oleic acid, lauric acid, and myristic acid, used primarily in soaps, candles, rubber processing, and as intermediates for fatty alcohols and esters. The segment benefits from soap and detergent industry consumption, which alone accounts for approximately 35% of global fatty acid demand.
To access detailed market analysis, Request Sample
Fatty alcohols at 26.3% represent the second-largest type segment, encompassing C8–C18 alcohols used predominantly in surfactant production for laundry detergents, dishwashing liquids, and personal care products. Fatty alcohols are also the fastest-growing type segment at approximately 6.1% CAGR, driven by the structural shift from petrochemical-based alternatives to bio-based renewable surfactants in FMCG formulations.
By Form
Liquid oleochemicals command a 64.8% share in 2025. Liquid form is preferred for surfactant manufacturing, lubricant blending, and personal care formulation, offering process integration advantages including direct pipeline transfer, reduced melting energy requirements, and continuous-flow compatibility.
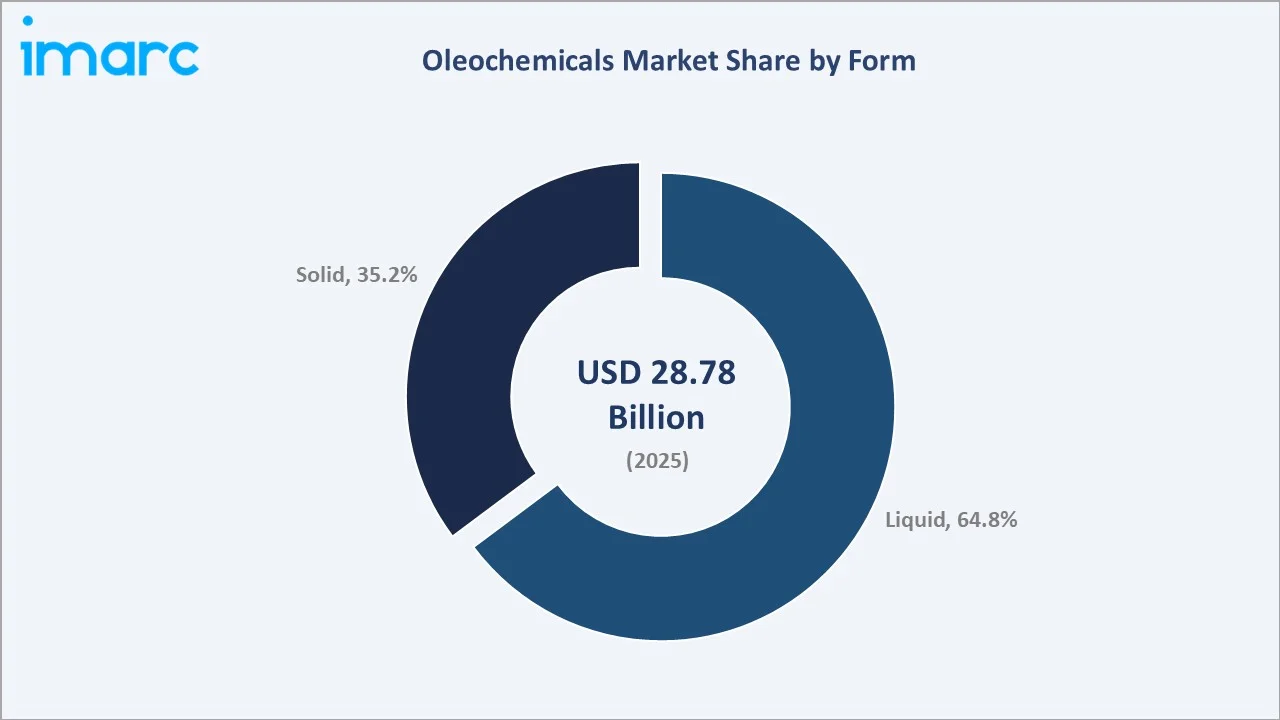
Solid form represents 35.2% of the market, encompassing flaked, pelletized, and bead-form fatty acids and fatty alcohols. Stearic acid (in flake form) is the dominant solid oleochemical, with major consumption in rubber compounding, candle manufacturing, and cosmetics. Solid form offers handling, storage, and dosing advantages in batch manufacturing, particularly for small-scale formulators.
Regional Market Insights
Asia Pacific's market leadership (46.8%, 2025) reflects the region's combined upstream feedstock advantage and downstream consumption growth. Indonesia and Malaysia together produce over 80% of global palm and palm kernel oil. China and India represent the fastest-growing consumption markets, driven by expanding domestic FMCG, personal care, and industrial chemical demand.
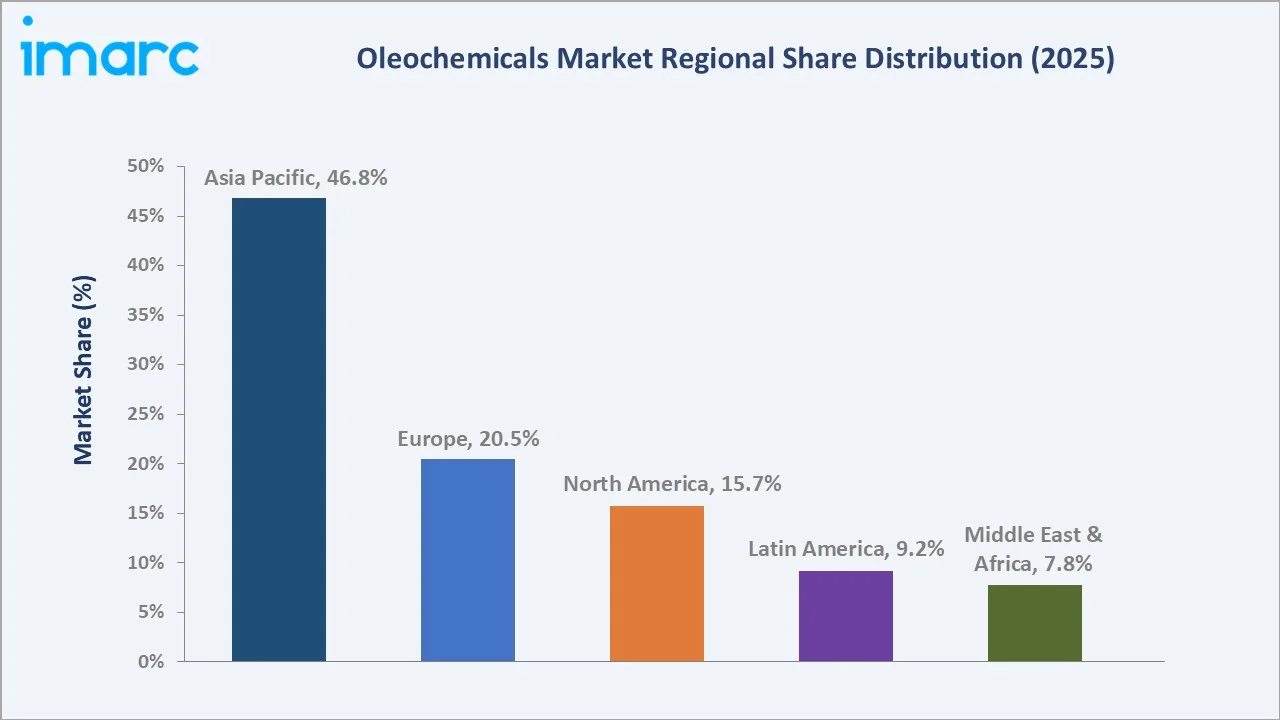
Europe at 20.5% maintains its position as a high-value oleochemicals consumer and producer, with Germany, Belgium, and the Netherlands hosting key specialty manufacturing facilities. EU sustainability regulations, including the Single-Use Plastics Directive, are accelerating bio-based surfactant adoption across detergent, cosmetics, and personal care formulations.
|
Region |
Share (2025) |
Key Growth Drivers |
|
Asia Pacific |
46.8% |
Dominant palm and palm kernel oil feedstock supply; rapid downstream FMCG and personal care consumption growth; integrated upstream-downstream operations |
|
Europe |
20.5% |
Stringent sustainability regulations driving bio-based surfactant adoption; established specialty oleochemicals manufacturing base; strong personal care and cosmetics industry demand |
|
North America |
15.7% |
Large soap, detergent, and personal care manufacturing base; tallow and soy-based feedstock availability; bio-based product sourcing commitments from FMCG majors |
|
Latin America |
9.2% |
Brazilian soy and tallow-based oleochemical production; growing domestic personal care and detergent demand; expanding biodiesel co-product glycerin output |
|
Middle East & Africa |
7.8% |
Emerging domestic FMCG manufacturing; growing personal care consumption; investment in downstream oleochemical capacity |
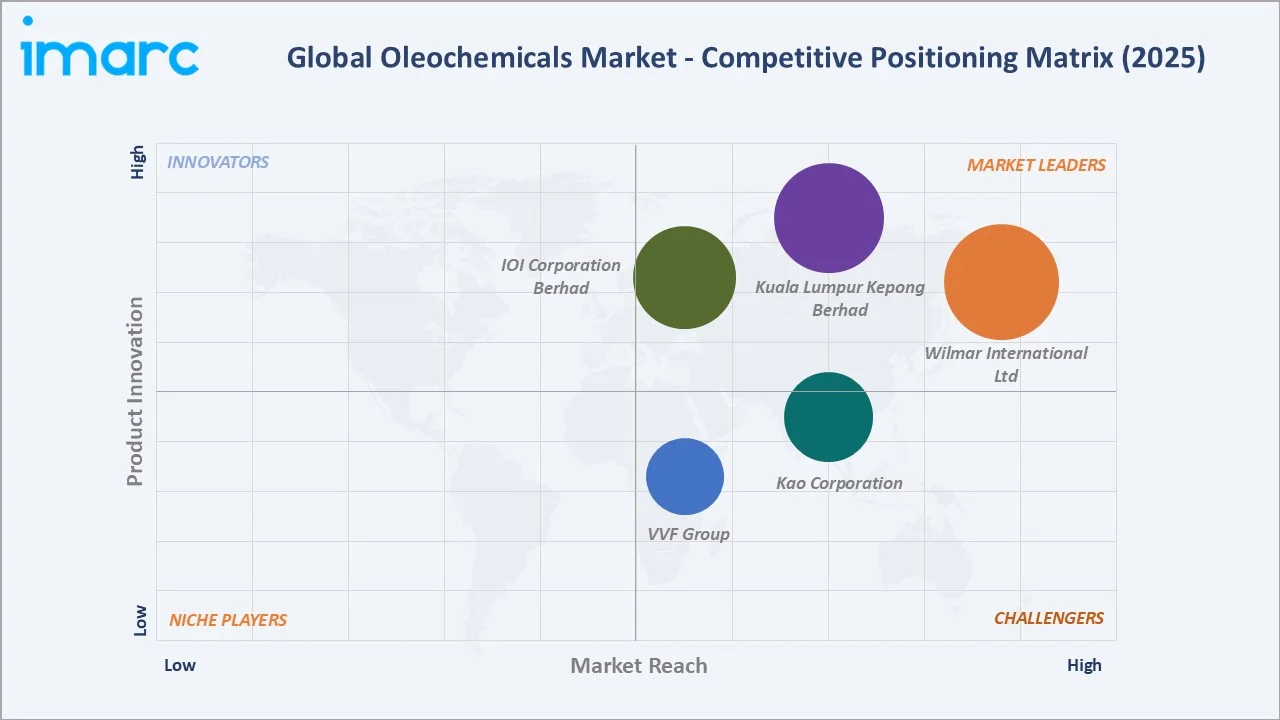
Competitive Landscape
The global oleochemicals market exhibits moderate concentration, with the top five players (Wilmar International Ltd, Kuala Lumpur Kepong Berhad, IOI Corporation Berhad, Kao Corporation, and VVF Group) collectively holding approximately 40–45% of global market revenue in 2025.
|
Company Name |
Brand Name / Portfolio |
Market Position |
Core Strength |
|
Wilmar International Ltd |
Wilmar Oleochemicals |
Market Leader |
Integrated palm-to-oleochemical supply chain; largest global capacity; vertical feedstock advantage |
|
Kuala Lumpur Kepong Berhad |
PALMOWAX, PALMOCOL, PALMOSALT, PALMFONATE, SYMPARE, PALMERA, among others |
Market Leader |
Fatty acid, fatty alcohol, and glycerin breadth; specialty esters portfolio; Malaysia–Europe footprint |
|
IOI Corporation Berhad |
Palmac, Palmsabun, Palmsurf |
Market Leader |
Palm and palm kernel-based oleochemicals; RSPO-certified supply chain; food and pharma-grade capabilities |
|
Kao Corporation |
LUNAC, KALCOL, CETANOL, COCONAD, FARMIN, KAOAMIN, among others |
Strong Challenger |
Specialty surfactants and esters; high-value personal care and home care chemicals; Japan and global reach |
|
VVF Group |
VVF |
Challenger |
Offers fatty alcohols, fatty acids, and glycerin; wide distribution & logistics network |
Wilmar International Ltd and Kuala Lumpur Kepong Berhad lead through integrated upstream-downstream palm and palm kernel oil operations, while Kao Corporation competes through specialty derivatives and high-value formulation expertise.
Key Company Profiles
Wilmar International Ltd
Wilmar International Ltd is the world's largest integrated palm oil and oleochemicals producer, with operations spanning palm plantations, oil refining, and downstream oleochemical manufacturing.
- Product Portfolio: Fatty acids, fatty alcohols, glycerin, methyl esters, soap noodles, and specialty esters.
- Recent Development: In February 2026, Wilmar International Ltd reported FY2025 net profit of USD 1.41 billion, up 20.6%, while core net profit rose 9.7% to USD 1.28 billion and revenue increased 4.5% to USD 70.42 billion. The growth was supported by higher contributions from feed & industrial products (including oleochemicals), plantations, and joint ventures/associates.
- Strategic Focus: Vertical integration across the palm value chain; specialty derivatives expansion; RSPO-certified sourcing for European and North American FMCG customers.
Kuala Lumpur Kepong Berhad
Kuala Lumpur Kepong Berhad operates KLK OLEO, the oleochemicals division. It is among the world's largest fatty acid, fatty alcohol, and glycerin producers, operating integrated palm refining and oleochemical complexes.
- Product Portfolio: Fatty acids, fatty alcohols, glycerin, methyl esters, esters, soaps, and bio-based polymer intermediates.
- Recent Developments: In February 2025, KLK OLEO expanded its global presence by opening a new representative office, KLK OLEO India (KLKOI), in Mumbai to strengthen relationships with customers and distributors across the Indian subcontinent.
- Strategic Focus: Specialty ester and surfactant downstream expansion; European presence through Emmerich and Belgium operations; sustainability certification leadership.
Market Concentration Analysis
The global oleochemicals market exhibits moderate concentration, with the top five players holding approximately 40–45% of revenue in 2025. The next tier accounts for an additional 18–22% of global market share. Regional players and integrated FMCG-captive producers complete the competitive landscape.
Consolidation patterns are concentrated around downstream specialty derivatives capacity additions rather than horizontal M&A. Wilmar International Ltd, Kuala Lumpur Kepong Berhad, and IOI Corporation Berhad have pursued capacity expansion within their integrated palm-feedstock complexes. The structural feature is the upstream-downstream integration advantage of Southeast Asian producers, which limits new entrant economics outside the integrated palm value chain.
Investment & Growth Opportunities
Fastest Growing Segments
Fatty alcohols (~6.1% CAGR), specialty esters and surfactants (~7% CAGR), bio-lubricants (~7.5% CAGR), and bio-based polyurethane intermediates (~8% CAGR) represent the highest-growth investment vectors through 2034. These subcategories together address a combined incremental addressable opportunity of approximately USD 8 Billion by 2034.
Emerging Market Expansion
India, Southeast Asia (Vietnam, Thailand, Philippines), and the Middle East represent the highest-growth emerging consumption markets through 2034. Investment in regional manufacturing capacity by Wilmar, Godrej Industries, and 3F Industries reflects the strategic importance of capturing India's expanding oleochemicals consumption pull.
Sustainability and Certification Premium
- RSPO-certified palm-derived oleochemicals command price premiums of 8–12% over uncertified equivalents, with European and North American FMCG customers increasingly mandating certified sourcing.
- Bio-based surfactant capacity investment is the largest near-term capital deployment opportunity, with global FMCG majors requiring an estimated USD 4–6 Billion of incremental bio-surfactant capacity to meet 2030 sustainability commitments.
- Specialty ester and ethoxylate capacity, particularly for personal care and pharmaceuticals, offers attractive returns with limited competitive intensity outside established specialty players.
Future Market Outlook (2026-2034)
The global oleochemicals market is positioned for steady, sustained expansion through 2034. From a base of USD 28.78 Billion in 2025, the market is projected to reach USD 46.23 Billion by 2034, representing total incremental value creation of USD 17.45 Billion at a CAGR of 5.41%. This trajectory is underpinned by the global pivot to bio-based and renewable raw materials in FMCG, lubricants, and industrial chemical applications, alongside expanding per-capita consumption across Asia Pacific, Latin America, and Middle East emerging markets.
Three structural shifts will define the 2026–2034 market: the accelerating substitution of petrochemical-based surfactants by bio-based fatty alcohol ethoxylates and methyl ester sulfonates; consolidation of integrated upstream-downstream players in Southeast Asia; and the rise of specialty derivatives, esters, ethoxylates, and bio-lubricants, as the primary margin-expansion lever.
Research Methodology
Primary Research
Primary research comprised structured interviews with over 100 industry participants in 2024–2025, including oleochemical producers, palm and palm kernel oil refiners, downstream FMCG procurement teams, surfactant formulators, lubricant blenders, and sustainability certification specialists across Indonesia, Malaysia, India, China, Germany, and the US.
Secondary Research
Secondary research encompassed Wilmar International, KLK Berhad, IOI Group, Kao Corporation, Evonik, and Oleon NV annual reports; RSPO and ISCC certification databases; Indonesian and Malaysian palm oil board statistics; international trade data (UN Comtrade for fatty acids and fatty alcohols HS codes); and industry publications (ICIS, S&P Global Commodity Insights, Oleoline).
Forecasting Models
Market size estimations were derived using top-down and bottom-up forecasting, incorporating global palm and palm kernel oil production data, downstream FMCG and industrial consumption trends, type-level capacity additions, and price evolution by oleochemical category. A base-case CAGR of 5.41% reflects consensus estimates validated against industry capacity pipelines, FMCG sustainability sourcing commitments, and historical oleochemical consumption growth patterns from FY2020 to FY2025.
Oleochemicals Market Report Scope:
| Report Features | Details |
|---|---|
| Base Year of the Analysis | 2025 |
| Historical Period | 2020-2025 |
| Forecast Period | 2026-2034 |
| Units | Billion USD |
| Scope of the Report | Exploration of Historical Trends and Market Outlook, Industry Catalysts and Challenges, Segment-Wise Historical and Predictive Market Assessment:
|
| Types Covered | Fatty Acids, Fatty Alcohols, Glycerine, Others |
| Forms Covered |
|
| Applications Covered | Soaps and Detergents, Plastics, Paper, Lubricants, Rubber, Coatings and Resins, Personal Care Products, Others |
| Feedstocks Covered | Palm, Soy, Rapeseed, Sunflower, Tallow, Palm Kernel, Coconut, Others |
| Regions Covered | Asia Pacific, Europe, North America, Latin America, Middle East and Africa |
| Countries Covered | United States, Canada, Germany, France, United Kingdom, Italy, Spain, Russia, China, Japan, India, South Korea, Australia, Indonesia, Brazil, Mexico, Argentina, Colombia, Chile, Peru, Turkey, Saudi Arabia, Iran, United Arab Emirates |
| Companies Covered | Wilmar International Ltd, Kuala Lumpur Kepong Berhad, IOI Corporation Berhad, Kao Corporation, VVF Group, etc. |
| Customization Scope | 10% Free Customization |
| Post-Sale Analyst Support | 10-12 Weeks |
| Delivery Format | PDF and Excel through Email (We can also provide the editable version of the report in PPT/Word format on special request) |
Key Benefits for Stakeholders:
- IMARC's industry report offers a comprehensive quantitative analysis of various market segments, historical and current market trends, market forecasts, and dynamics of the oleochemicals market from 2020-2034.
- The research report study provides the latest information on the market drivers, challenges, and opportunities in the global oleochemicals market.
- The study maps the leading, as well as the fastest-growing, regional markets. It further enables stakeholders to identify the key country-level markets within each region.
- Porter's five forces analysis assists stakeholders in assessing the impact of new entrants, competitive rivalry, supplier power, buyer power, and the threat of substitution. It helps stakeholders to analyze the level of competition within the oleochemicals industry and its attractiveness.
- The competitive landscape allows stakeholders to understand their competitive environment and provides an insight into the current positions of key players in the market.
Frequently Asked Questions About the Oleochemicals Market Report
The global oleochemicals market reached USD 28.78 Billion in 2025 and is projected to reach USD 46.23 Billion by 2034.
The market is expected to grow at a CAGR of 5.41% during 2026-2034, driven by bio-based surfactant adoption, FMCG sustainability commitments, and expanding emerging-market consumption.
Asia Pacific leads with a 46.8% share in 2025, anchored by Indonesia and Malaysia's combined palm oil production exceeding 66 million tons annually and rapidly expanding downstream consumption in China and India.
Fatty acids dominate with a 42.6% share in 2025, driven by their indispensable role in soap, candle, rubber, and surfactant intermediate production.
Liquid form holds the largest share at 64.8%, supported by superior process integration in surfactant, lubricant, and personal care manufacturing.
Key players include Wilmar International Ltd, Kuala Lumpur Kepong Berhad, IOI Corporation Berhad, Kao Corporation, and VVF Group.
Fatty alcohols are growing at approximately 6.1% CAGR, driven by accelerating substitution of petrochemical-based surfactants by bio-based ethoxylates and sulfates in laundry detergents, dishwashing liquids, and personal care formulations.
Key challenges include volatile palm oil feedstock prices, petrochemical substitution threats during oil price downturns, environmental and deforestation concerns linked to palm cultivation, RSPO and other certification compliance costs, and periodic glycerin oversupply linked to biodiesel mandate expansions.
Specialty esters and ethoxylates, bio-lubricants, bio-based polyurethane intermediates, RSPO-certified premium supply chains, and India and Southeast Asia capacity expansion represent the highest-growth investment opportunities.
Need more help?
- Speak to our experienced analysts for insights on the current market scenarios.
- Include additional segments and countries to customize the report as per your requirement.
- Gain an unparalleled competitive advantage in your domain by understanding how to utilize the report and positively impacting your operations and revenue.
- For further assistance, please connect with our analysts.
 Request Customization
 Speak to an Analyst
 Request Brochure
 Inquire Before Buying
Benefits of Customization
- Personalize this research
- Triangulate with your data
- Get data as per your format and definition
- Gain a deeper dive into a specific application, geography, customer, or competitor
- Any level of personalization
Get in Touch With Us
UNITED STATES
Phone: +1-201-971-6302
INDIA
Phone: +91-120-433-0800
UNITED KINGDOM
Phone: +44-753-714-6104
Email: [email protected]
Client Testimonials


.webp)


