
On-demand Transportation Market Size, Share, Trends and Forecast by Service Type, Vehicle Type, Application, and Region, 2026-2034
On-demand Transportation Market Size and Share:
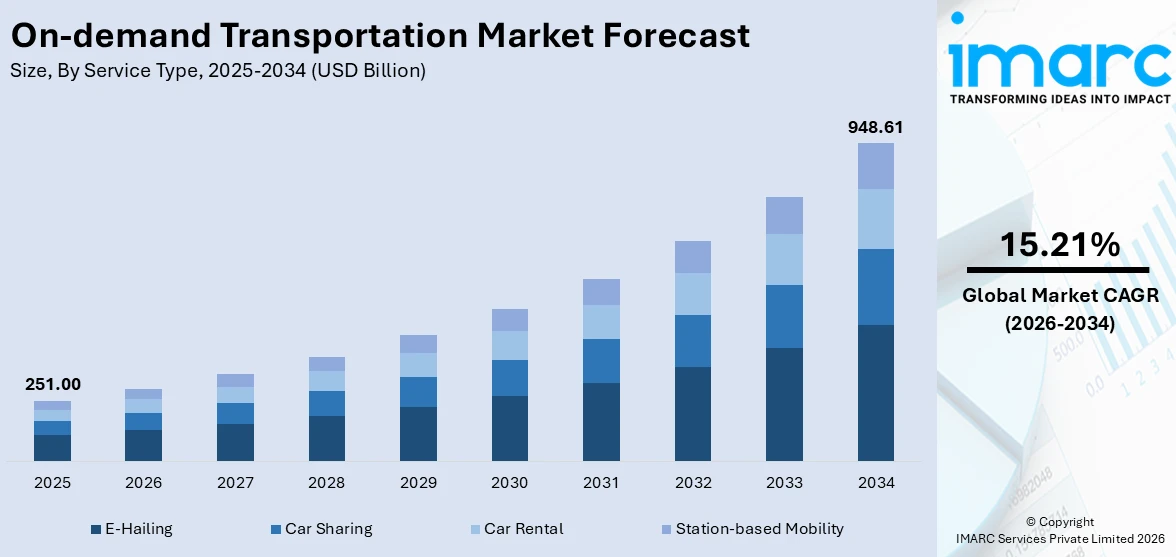
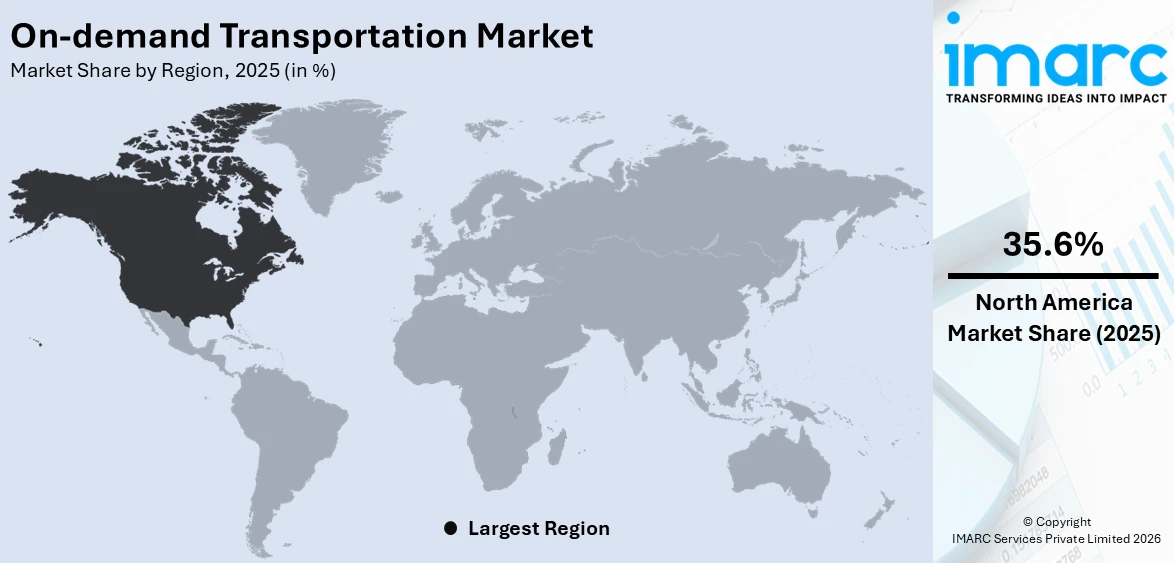
The global on-demand transportation market size was valued at USD 251.00 Billion in 2025. Looking forward, IMARC Group estimates the market to reach USD 948.61 Billion by 2034, exhibiting a CAGR of 15.21% from 2026-2034. North America currently dominates the market, holding a market share of 35.6% in 2025. The region benefits from widespread smartphone adoption, robust digital infrastructure, high consumer spending capacity, and a well-established ecosystem of ride-hailing and mobility service providers that continue to expand their offerings and geographic reach, supporting the overall demand for convenient, app-based transportation solutions and contributing to the on-demand transportation market share.
The global on-demand transportation market is being driven by several interconnected factors that are reshaping urban and intercity mobility. Rising urbanization across major economies is increasing the demand for flexible, convenient, and cost-effective commuting alternatives. The proliferation of smartphones and mobile internet connectivity is enabling seamless access to ride-hailing, car-sharing, and car-rental platforms, thereby expanding the user base significantly. Additionally, the integration of advanced technologies such as artificial intelligence (AI), real-time navigation, and dynamic pricing algorithms is enhancing service efficiency and customer experience. Supportive government policies promoting sustainable transportation and smart city development are further catalyzing the on-demand transportation market growth. The evolving preferences of younger demographics who prioritize access over ownership are also accelerating adoption across diverse geographic regions worldwide.
The United States has emerged as a major region in the on-demand transportation market owing to many factors. Extensive urbanization, particularly in metropolitan areas, creates sustained demand for ride-hailing and car-sharing services as viable alternatives to personal vehicle usage. In September 2025, Lyft partnered with May Mobility to roll out a robotaxi pilot service in Atlanta, allowing users to hail autonomous Toyota Sienna vehicles through the Lyft app along selected routes in Midtown. Supportive regulatory frameworks at both federal and state levels are enabling the expansion of on-demand mobility platforms while ensuring passenger safety standards. Furthermore, the growing emphasis on reducing greenhouse gas emissions and alleviating urban traffic congestion is prompting consumers and policymakers to support shared transportation models.
To get more information on this market Request Sample
On-demand Transportation Market Trends:
Integration of Electric Vehicles
The integration of electric vehicles into on-demand transportation platforms is emerging as a significant trend reshaping industry landscape. Ride-hailing and car-sharing operators are progressively incorporating electric vehicles into their fleets to reduce operational fuel costs and align with growing environmental sustainability mandates. Governments across multiple regions are offering incentives for electric vehicle adoption, including tax credits, subsidies, and preferential regulatory treatment, which are encouraging fleet operators to accelerate their electrification timelines. In January 2024, Uber Technologies announced collaboration with Tesla to encourage EV adoption among ride-hailing drivers by offering purchase incentives of up to $2,000 for Tesla Model 3 and Model Y vehicles. Consumers are also demonstrating increasing preference for environmentally responsible transportation options, which is supporting the transition toward electric mobility within on-demand platforms.
Expansion of Autonomous Driving Technology
The expansion of autonomous driving technology represents a transformative development within the on-demand transportation sector that is attracting substantial investment and research efforts. Leading technology firms and automotive manufacturers are developing and testing self-driving capabilities for ride-hailing and shared mobility applications across controlled urban environments. In February 2026, Waymo announced that its autonomous robotaxi service will expand into multiple new U.S. metropolitan markets, including Orlando, Dallas, Houston, and San Antonio, where its fully driverless vehicles will begin transporting passengers via the Waymo One app. The deployment of autonomous vehicles promises to reduce labor costs significantly while improving operational availability and service consistency for platform operators. The on-demand transportation market outlook remains promising as continued technological breakthroughs bring fully autonomous commercial operations closer to widespread reality across major metropolitan markets.
Rise of Multimodal Transportation Platforms
The rise of multimodal transportation platforms is gaining considerable momentum as consumers increasingly seek integrated mobility solutions that combine various modes of transport within a single application. These platforms aggregate services including ride-hailing, car-sharing, public transit, bicycle rentals, and scooter sharing, offering users comprehensive journey planning and seamless payment options. In May 2025, Link Transit partnered with the commuter app Moovit to enable riders in Burlington to plan, pay for, and navigate multimodal journeys – including real‑time transit and Uber ride options – from a single interface. The on-demand transportation market forecast indicates continued expansion as platform providers invest in interoperability standards, API integrations, and cross-modal ticketing systems to deliver increasingly sophisticated, user-centric mobility ecosystems across global urban centers.
On-demand Transportation Industry Segmentation:
IMARC Group provides an analysis of the key trends in each segment of the global on-demand transportation market, along with forecast at the global, regional, and country levels from 2026-2034. The market has been categorized based on service type, vehicle type, and application.
Analysis by Service Type:
- E-Hailing
- Car Sharing
- Car Rental
- Station-based Mobility
E-hailing holds 37.6% of the market share, enabling users to request immediate transportation through smartphone applications, connecting passengers with available drivers in real time. The segment is helped by the high penetration of digital payment systems and the increasing demand for on-demand and door-to-door mobility services. City dwellers are increasingly relying on e-hailing services for daily commuting, airport transfers, and short-distance travel because of their convenience, affordability, and time-saving attributes. The constant enhancement of matching algorithms and routes is helping e-hailing services retain their customers across major markets by reducing waiting times. E-hailing services are adding more services to their bouquet to meet different consumer demands. The increasing penetration of mobile internet services across emerging economies is helping e-hailing services expand their potential consumer base. Supportive urban transport policies and increasing traffic congestion across metropolitan cities are adding to the demand for e-hailing services globally.
Analysis by Vehicle Type:
- Four-Wheeler
- Micro Mobility
Four-wheeler leads the market with a share of 88.7%, encompassing sedans, SUVs, and hatchbacks deployed across ride-hailing, car-sharing, and car-rental platforms, forming the backbone of on-demand transportation services globally. The success of four-wheelers can be explained by their capacity to transport more passengers, offer comfort in various climates, and provide safety and security during travel in an enclosed environment, suitable for various distances and climates. The preference of consumers for four-wheelers to commute, conduct business, and travel long distances can be explained by their reliability and the variety of vehicle categories available in the market across various price points. The preference of fleet operators for four-wheelers can be explained by their potential to cater to the economy and luxury segments of the market, along with their high utilization rate. The increase in infrastructure for servicing, fueling, and charging of vehicles can be explained by its potential to support the efficient operation of four-wheeler fleets in various geographical locations.
Analysis by Application:
Access the comprehensive market breakdown Request Sample
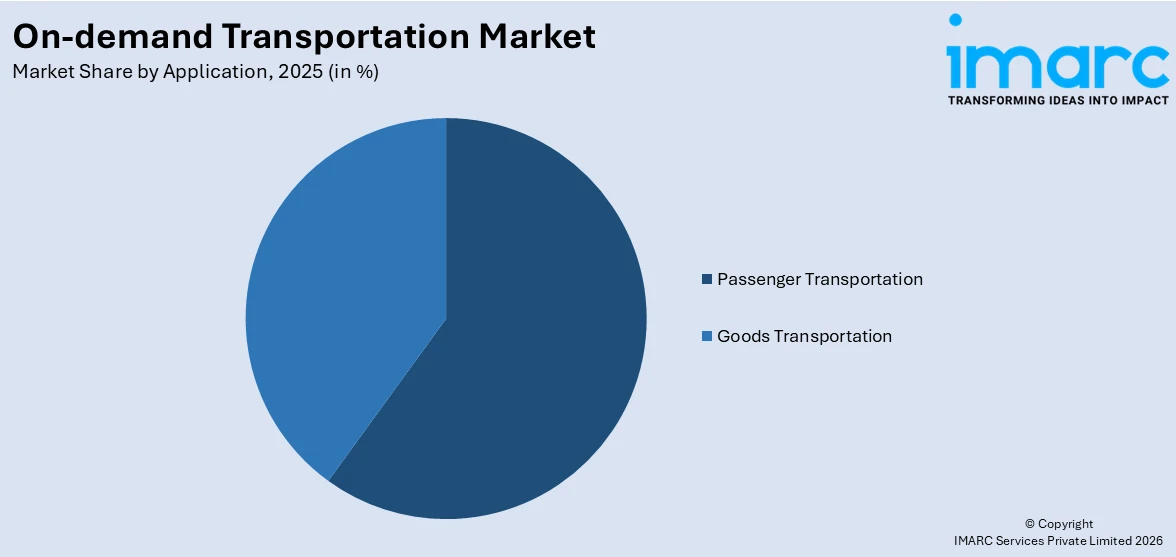
- Passenger Transportation
- Goods Transportation
Passenger transportation dominates the market, representing the primary application of on-demand mobility services, encompassing daily commuting, airport and station transfers, intercity travel, and leisure trips facilitated through digital platforms. The segment benefits from the increasing urban population seeking convenient alternatives to private vehicle ownership and public transit limitations. Consumers value the flexibility of scheduling rides on demand, choosing vehicle categories based on personal preferences, and accessing transparent pricing through mobile applications. As per sources, Uber reported that its platform surpassed 200 million monthly active users globally, with over 40 million trips completed each day across its ride‑hailing and mobility network. The expansion of ride-pooling and shared ride options within passenger transportation is enhancing affordability while reducing per-trip carbon emissions, attracting environmentally conscious users. Platform providers continuously invest in safety features including driver verification, in-app emergency buttons, and real-time trip monitoring to build passenger confidence and loyalty. The growing integration of corporate transportation accounts and subscription-based ride packages is diversifying the revenue streams within the passenger segment.
Regional Analysis:
To get more information on the regional analysis of this market Request Sample
- North America
- United States
- Canada
- Asia-Pacific
- China
- Japan
- India
- South Korea
- Australia
- Indonesia
- Others
- Europe
- Germany
- France
- United Kingdom
- Italy
- Spain
- Russia
- Others
- Latin America
- Brazil
- Mexico
- Others
- Middle East and Africa
North America, accounting for 35.6% of the share, maintaining the leading position in the market. The region benefits from a technologically advanced ecosystem that supports the seamless operation of ride-hailing, car-sharing, and car-rental platforms across metropolitan and suburban areas. High smartphone penetration, widespread mobile internet access, and established digital payment infrastructure provide a strong foundation for on-demand mobility adoption among consumers. The presence of leading global ride-hailing companies headquartered in the region drives continuous innovation in service offerings, pricing models, and fleet management technologies. Urban congestion in major cities encourages consumers to choose on-demand transportation over private vehicle ownership, particularly for daily commuting and short-distance travel. Supportive regulatory environments at state and municipal levels enable platform operators to expand their geographic coverage and diversify their service portfolios. The growing corporate adoption of mobility solutions for employee transportation and business travel further strengthens demand across professional market segments within the region.
Key Regional Takeaways:
United States On-Demand Transportation Market Analysis
The United States represents a pivotal market for on-demand transportation services, driven by a combination of technological innovation, extensive digital infrastructure, and evolving consumer mobility preferences. The country's dense metropolitan areas generate consistent demand for ride-hailing and car-sharing services as commuters seek efficient alternatives to personal vehicle ownership amid rising fuel prices and limited parking availability. In January 2025, the U.S. Federal Highway Administration awarded $635 million in grants to expand electric vehicle charging and alternative fueling infrastructure nationwide, supporting broader adoption of electrified mobility including shared and ride‑hailing fleets. The rapid integration of AI and machine learning (ML) into platform operations enhances route optimization, demand prediction, and dynamic pricing, improving both user experience and operator profitability. Regulatory frameworks across various states continue to evolve, establishing clear operational guidelines that balance innovation with passenger safety requirements. The growing emphasis on environmental sustainability is prompting fleet electrification initiatives, with major operators committing to zero-emission vehicle targets within defined timelines. Corporate mobility programs and partnerships with enterprise clients are expanding the commercial application of on-demand services beyond individual consumer use.
Europe On-Demand Transportation Market Analysis
Europe represents a significant and growing market for on-demand transportation services, supported by progressive urban mobility policies and strong environmental sustainability mandates across the continent. The European Union's emphasis on reducing carbon emissions from the transportation sector is encouraging the adoption of shared mobility solutions and electric vehicle integration within on-demand fleets. Major urban centers including London, Paris, Berlin, and Madrid demonstrate high adoption rates for ride-hailing and car-sharing services, driven by efficient public transit integration and dense population concentrations. Regulatory harmonization efforts across member states are creating more favorable operating conditions for cross-border mobility platform expansion. The on-demand transportation market trends indicate growing consumer preference for sustainable, multimodal transportation options that combine public transit with on-demand last-mile services. The continent's well-developed digital payment infrastructure and high smartphone penetration facilitate seamless user onboarding and transaction processing. Investment in autonomous vehicle testing programs and smart city transportation initiatives across European nations is positioning the region for next-generation mobility service deployment.
Asia-Pacific On-Demand Transportation Market Analysis
Asia-Pacific represents a rapidly expanding market for on-demand transportation services, fueled by massive urbanization, rising disposable incomes, and increasing smartphone penetration across both developed and emerging economies. Countries including China, India, Japan, South Korea, Indonesia, and Australia are witnessing accelerating adoption of ride-hailing and car-sharing platforms as urban populations seek affordable and convenient commuting alternatives. The region's dense urban environments and growing traffic congestion are compelling consumers and governments to embrace shared mobility solutions that reduce vehicular emissions and improve transit efficiency. Government initiatives supporting digital infrastructure development and smart city programs are creating enabling environments for on-demand transportation expansion. The younger demographic profile across many Asia-Pacific nations drives strong adoption of mobile-first transportation services, further strengthening the on-demand mobility ecosystem throughout the region.
Latin America On-Demand Transportation Market Analysis
Latin America is emerging as an important growth market for on-demand transportation services, driven by rapid urbanization and expanding mobile internet connectivity across the region. Major metropolitan areas in Brazil, Mexico, and other nations are experiencing increasing adoption of ride-hailing platforms as consumers seek safe, reliable, and affordable commuting options. The region's growing middle class and rising smartphone penetration are broadening the addressable market for digital mobility services. Urban infrastructure limitations and public transit capacity constraints further reinforce consumer preference for on-demand alternatives. Government efforts to formalize and regulate the ride-hailing sector are establishing operational frameworks that encourage market investment and expansion.
Middle East and Africa On-Demand Transportation Market Analysis
The Middle East and Africa represent a developing but promising market for on-demand transportation services, supported by rapid digital transformation initiatives and growing urban populations. Gulf Cooperation Council nations are investing heavily in smart city infrastructure and transportation modernization, creating favorable conditions for ride-hailing and mobility platform adoption. Increasing tourism flows and the hosting of major international events are driving demand for convenient, technology-enabled transportation solutions. In Africa, rising mobile phone penetration and expanding internet connectivity are enabling the introduction of ride-hailing services in major urban centers. Regulatory developments across the region are gradually formalizing on-demand transportation operations, building frameworks that encourage private investment and service expansion.
Competitive Landscape:
The on-demand transportation market exhibits a dynamic competitive landscape characterized by the presence of established technology platforms, automotive manufacturers, and emerging regional operators competing for market dominance. Leading players are investing heavily in technology development, including autonomous driving capabilities, electric vehicle integration, and advanced data analytics to enhance operational efficiency and customer experience. Strategic partnerships between ride-hailing companies, automotive OEMs, and technology providers are accelerating innovation cycles and expanding service portfolios. Market participants are pursuing geographic expansion into underserved regions while simultaneously diversifying their service offerings to include goods delivery, corporate mobility solutions, and multimodal transportation packages. Competitive differentiation increasingly centers on platform reliability, pricing transparency, safety features, and environmental sustainability commitments.
The report provides a comprehensive analysis of the competitive landscape in the on-demand transportation market with detailed profiles of all major companies, including:
- ANI Technologies Pvt. Ltd
- Avis Budget Group Inc.
- Bayerische Motoren Werke AG
- Daimler AG
- Ford Motor Company
- Gett Inc.
- Grab Holdings Inc.
- International Business Machine Corporation
- Lyft Inc.
- Robert Bosch GmbH
- Toyota Motor Corporation
- Uber Technologies Inc.
Latest News and Developments:
- In February 2026, Uber announced a partnership with Joby Aviation to launch Uber Air in Dubai later this year. The service will feature all-electric air taxis carrying up to four passengers at speeds of 200 mph. Bookings will be via the Uber app, connecting key locations like Dubai Mall and the airport, with pricing similar to Uber Black.
- In September 2025, Amazon’s subsidiary Zoox launched a public autonomous ride-hailing service in Las Vegas, using purpose-built robotaxis with no steering wheel or pedals. Initially offering free rides between select locations, Zoox plans to expand to San Francisco, Austin, and Miami, marking a key step toward mainstream self-driving mobility services.
On-demand Transportation Market Report Scope:
| Report Features | Details |
|---|---|
| Base Year of the Analysis | 2025 |
| Historical Period | 2020-2025 |
| Forecast Period | 2026-2034 |
| Units | Billion USD |
| Scope of the Report | Exploration of Historical Trends and Market Outlook, Industry Catalysts and Challenges, Segment-Wise Historical and Future Market Assessment:
|
| Service Types Covered | E-Hailing, Car Sharing, Car Rental, Station-Based Mobility |
| Vehicle Types Covered | Four-Wheeler, Micro Mobility |
| Applications Covered | Passenger Transportation, Goods Transportation |
| Regions Covered | North America, Asia-Pacific, Europe, Latin America, Middle East and Africa |
| Countries Covered | United States, Canada, China, Japan, India, South Korea, Australia, Indonesia, Germany, France, United Kingdom, Italy, Spain, Russia, Brazil, Mexico |
| Companies Covered | ANI Technologies Pvt. Ltd, Avis Budget Group Inc., Bayerische Motoren Werke AG, Daimler AG, Ford Motor Company, Gett Inc., Grab Holdings Inc., International Business Machine Corporation, Lyft Inc., Robert Bosch GmbH, Toyota Motor Corporation, Uber Technologies Inc., etc. |
| Customization Scope | 10% Free Customization |
| Post-Sale Analyst Support | 10-12 Weeks |
| Delivery Format | PDF and Excel through Email (We can also provide the editable version of the report in PPT/Word format on special request) |
Key Benefits for Stakeholders:
- IMARC’s report offers a comprehensive quantitative analysis of various market segments, historical and current market trends, market forecasts, and dynamics of the on-demand transportation market from 2020-2034.
- The research study provides the latest information on the market drivers, challenges, and opportunities in the global on-demand transportation market.
- The study maps the leading, as well as the fastest-growing, regional markets. It further enables stakeholders to identify the key country-level markets within each region.
- Porter's Five Forces analysis assists stakeholders in assessing the impact of new entrants, competitive rivalry, supplier power, buyer power, and the threat of substitution. It helps stakeholders to analyze the level of competition within the on-demand transportation industry and its attractiveness.
- Competitive landscape allows stakeholders to understand their competitive environment and provides an insight into the current positions of key players in the market.
Frequently Asked Questions About the On-demand Transportation Market Report
The on-demand transportation market was valued at USD 251.00 Billion in 2025.
The on-demand transportation market is projected to exhibit a CAGR of 15.21% during 2026-2034, reaching a value of USD 948.61 Billion by 2034.
The on-demand transportation market is primarily driven by increasing urbanization, rising smartphone penetration, growing consumer preference for convenient and cost-effective mobility solutions, expanding digital payment infrastructure, and supportive government policies promoting sustainable transportation. Additionally, the integration of advanced technologies including AI and route optimization algorithms enhancing service quality and expanding the user base globally.
North America currently dominates the on-demand transportation market, accounting for a share of 35.6%. The region benefits from advanced digital infrastructure, high smartphone adoption, and the presence of leading global ride-hailing and mobility service platforms.
Some of the major players in the on-demand transportation market include ANI Technologies Pvt. Ltd, Avis Budget Group Inc., Bayerische Motoren Werke AG, Daimler AG, Ford Motor Company, Gett Inc., Grab Holdings Inc., International Business Machine Corporation, Lyft Inc., Robert Bosch GmbH, Toyota Motor Corporation, Uber Technologies Inc., etc.
Need more help?
- Speak to our experienced analysts for insights on the current market scenarios.
- Include additional segments and countries to customize the report as per your requirement.
- Gain an unparalleled competitive advantage in your domain by understanding how to utilize the report and positively impacting your operations and revenue.
- For further assistance, please connect with our analysts.
 Request Customization
 Speak to an Analyst
 Request Brochure
 Inquire Before Buying
Benefits of Customization
- Personalize this research
- Triangulate with your data
- Get data as per your format and definition
- Gain a deeper dive into a specific application, geography, customer, or competitor
- Any level of personalization
Get in Touch With Us
UNITED STATES
Phone: +1-201-971-6302
INDIA
Phone: +91-120-433-0800
UNITED KINGDOM
Phone: +44-753-714-6104
Email: [email protected]
Client Testimonials


.webp)


