
Oyster Market Size, Share, Trends and Forecast by Oyster Type, End User, Packaging Form, and Region, 2026-2034
Global Oyster Market Size, Share, Trends & Forecast (2026-2034)
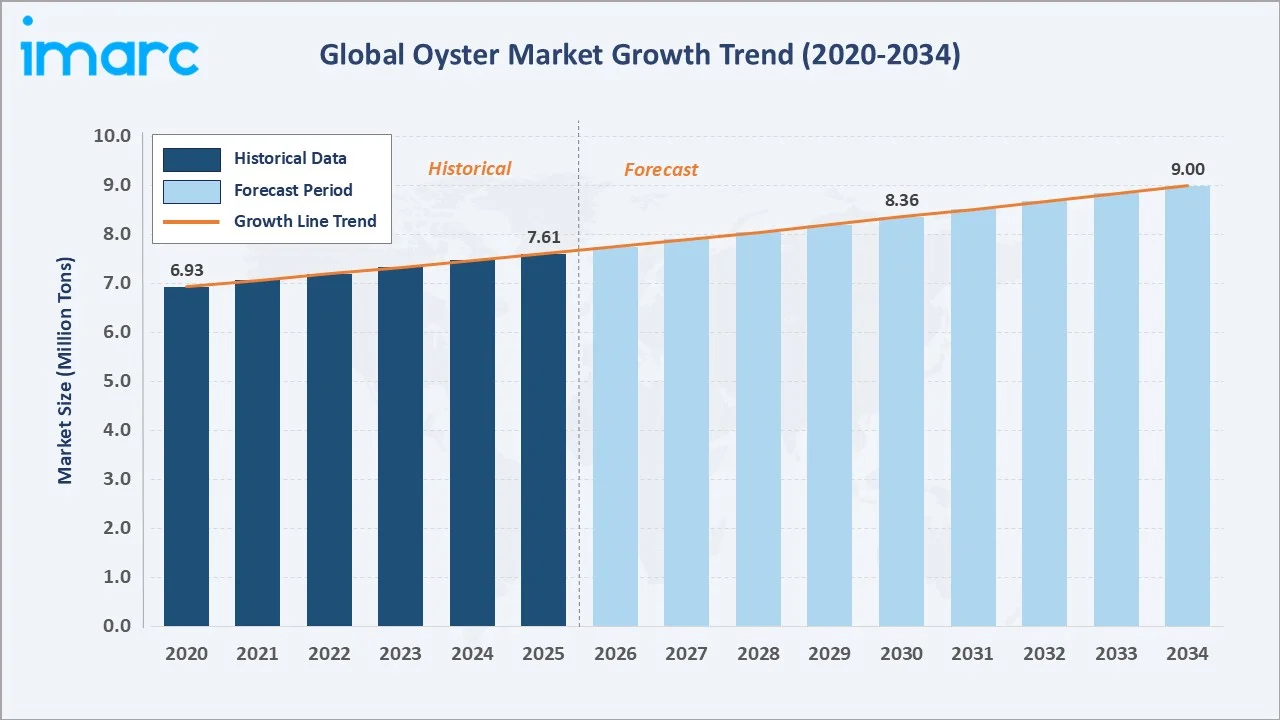
The global oyster market size reached at 7.61 Million Tons in 2025 and is projected to reach 9.00 Million Tons by 2034, exhibiting a CAGR of 1.88% during the forecast period 2026-2034. Rising global demand for sustainable seafood, growing health-consciousness driving demand for nutrient-dense aquatic protein, and expanding aquaculture production capacity across the Asia Pacific are the primary growth enablers. Fresh oysters dominate packaging form at 70.0% in 2025, while the Retail channel accounts for 64.7% of end-user demand. Asia Pacific leads regional distribution with a commanding 94.9% global volume share in 2025, anchored by China's vast commercial oyster farming ecosystem.
Market Snapshot
|
Metric |
Value |
|
Market Size (2025) |
7.61 Million Tons |
|
Forecast Market Size (2034) |
9.00 Million Tons |
|
CAGR (2026-2034) |
1.88% |
|
Base Year |
2025 |
|
Historical Period |
2020-2025 |
|
Forecast Period |
2026-2034 |
|
Largest Region |
Asia Pacific (94.9% share, 2025) |
|
Fastest Growing Region |
Asia Pacific |
|
Leading Packaging Form |
Fresh (70.0%, 2025) |
|
Leading End-User |
Retail (64.7%, 2025) |
The global oyster market growth trajectory from 2020 through 2034, contrasting a consistent historical expansion base against a sustained forecast curve powered by aquaculture scaling, premiumisation of seafood, and rising institutional foodservice demand across key Asian and Western markets.
To get more information on this market, Request Sample
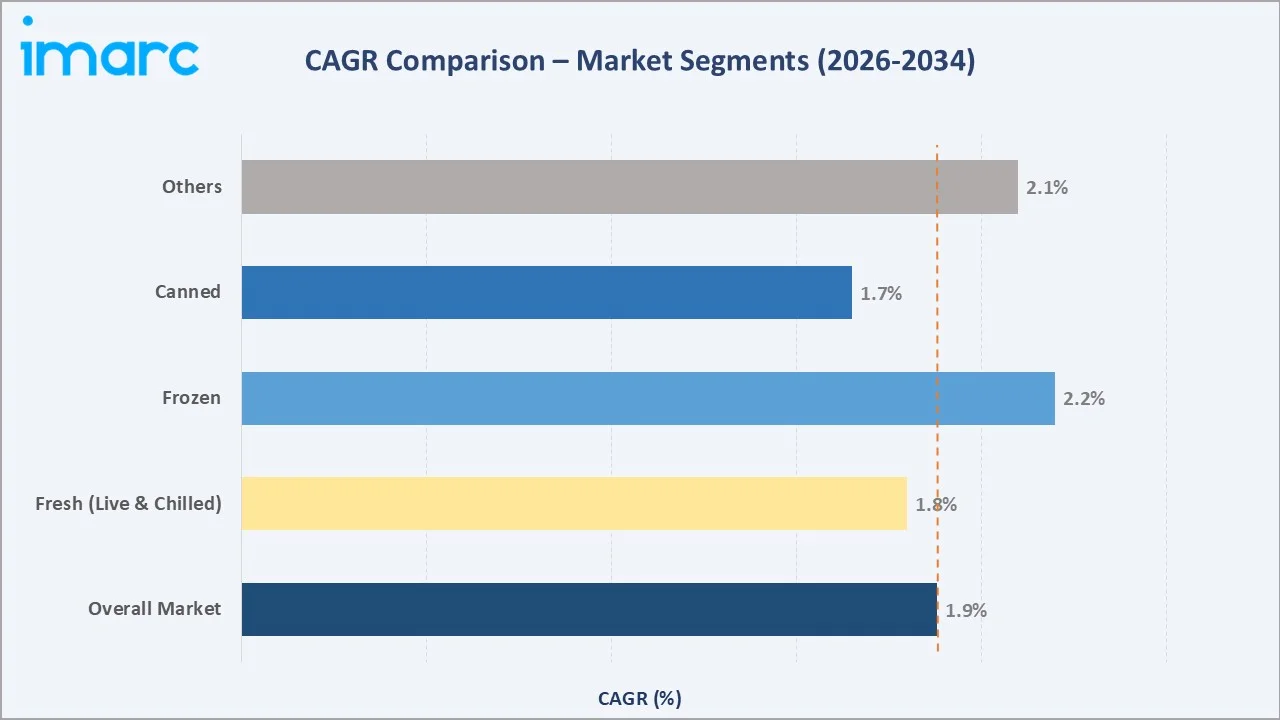
Packaging form-level CAGR comparisons highlighting Frozen and Others formats as the faster-growing sub-categories within the global oyster market analysis through 2034, reflecting value-added product development and export trade expansion.
Executive Summary
The global oyster market is at a measured but consistent growth phase, propelled by structural shifts in dietary preferences, the global seafood sustainability movement, and the rising middle-class appetite for premium aquatic protein. Volumed at 7.61 Million Tons in 2025, the market is forecast to reach 9.00 Million Tons by 2034 at a CAGR of 1.88%. Asia Pacific remains the undisputed epicenter of global oyster production and consumption, holding 94.9% of global market revenue in 2025.
Fresh packaging commands the largest share at 70.0% in 2025, driven by consumer preference for natural, minimally processed shellfish and well-established cold-chain logistics networks in key producing nations. Frozen and canned oysters together represent 26.7%, catering to export markets and shelf-stable applications in food manufacturing. The Retail channel leads at 64.7% in 2025, supported by expanding specialty seafood sections in hypermarkets and the rapid growth of online seafood direct-to-consumer platforms. Foodservice at 35.3% reflects strong demand from fine-dining restaurants, oyster bars, and hotel establishments.
Strategically, the global oyster market is shaped by the intersection of government support for aquaculture, food safety regulatory reforms, and sustainable harvesting certifications from bodies such as the Aquaculture Stewardship Council (ASC). Key companies include Huitres Favier Earl, Hog Island Oyster Company, France Naissain, and Mere Point Oyster Company, representing the diverse competitive landscape spanning artisanal producers to large-scale commercial operators across Asia Pacific, North America, and Europe.
Key Market Insights
|
Insight |
Data |
|
Largest Packaging Form |
Fresh – 70.0% share (2025) |
|
Second Packaging Form |
Frozen – 18.5% share (2025) |
|
Leading End-User Channel |
Retail – 64.7% (2025) |
|
Leading Region |
Asia Pacific – 94.9% revenue share (2025) |
|
Top Companies |
Huitres Favier Earl, Hog Island Oyster Company, France Naissain, Mere Point Oyster Company |
Key Analytical Observations Supporting The Above Data:
- Fresh oysters' 70.0% dominance in 2025 reflects well-developed cold-chain logistics supporting live shellfish delivery and strong consumer preference for natural, unprocessed formats in sophisticated seafood markets across North America, Europe, and the Asia Pacific.
- Asia Pacific's 94.9% global dominance in 2025 - a level of regional concentration unmatched in most seafood categories - reflects China's role as the world's largest oyster.
- Retail's 64.7% end-user leadership in 2025 reflects the growing integration of fresh seafood counters and specialty oyster sections in hypermarkets, and the rapid expansion of online seafood direct-to-consumer platforms in North America and Europe.
Global Oyster Market Overview
Oysters are bivalve mollusks produced for human consumption, with additional roles in reef restoration, bioremediation, and pearl cultivation. Supply operates through wild harvest and aquaculture systems (longline, rack-and-bag, cage, bottom culture), with aquaculture now dominating global production. The market ecosystem includes hatcheries, grow-out farms, processors, distributors, retailers, and foodservice operators. End-use spans fine dining, casual restaurants, retail (fresh, frozen, canned), and processed food applications.
Growth is driven by urbanization-led dietary shifts toward lean protein, rising disposable incomes, and increasing demand for premium seafood—particularly across Asia Pacific and North America. Expanding global seafood consumption and aquaculture adoption continue to structurally support market growth.
Market Dynamics
To evaluate market opportunities, Request Sample
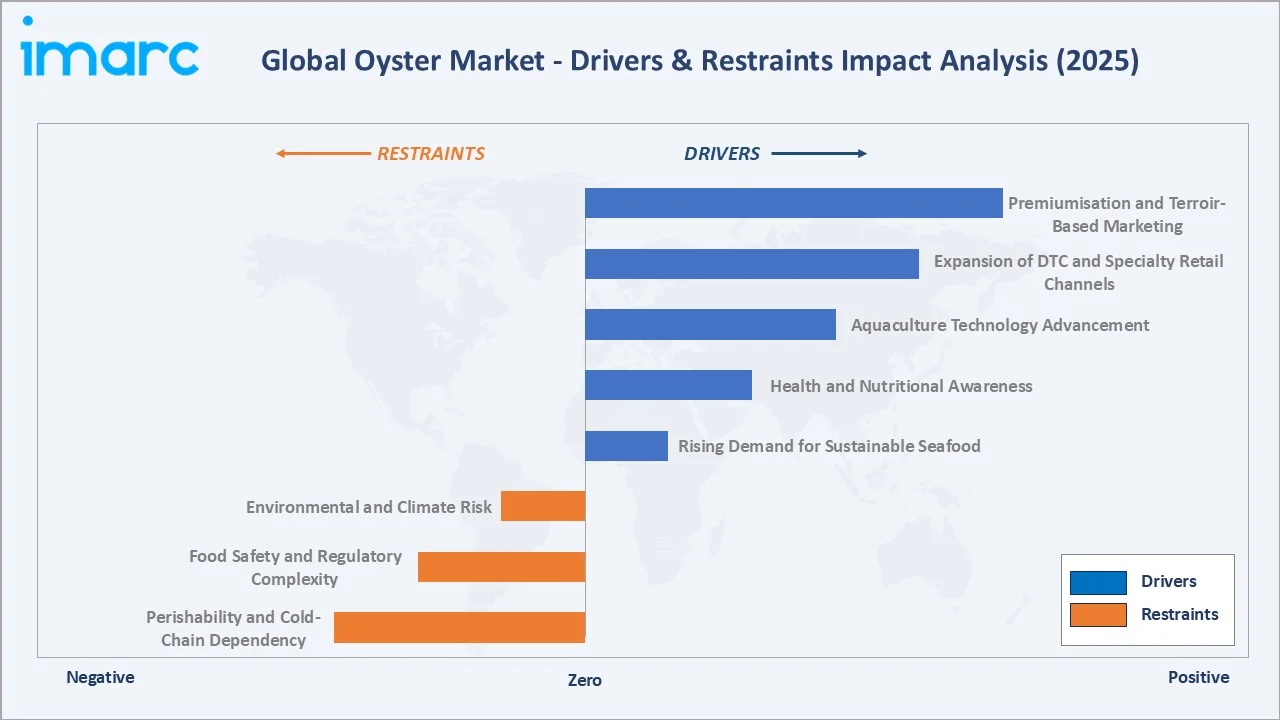
Market Drivers
- Rising Demand for Sustainable Seafood: Rising preference for responsibly farmed oysters (e.g., ASC-certified) driven by their low-input, water-filtering nature; supported by sustainable sourcing policies across North America and Europe.
- Health and Nutritional Awareness: High zinc, omega-3, vitamin B12, and protein content support demand amid growing focus on immunity and nutrient-dense diets.
- Aquaculture Technology Advancement: Advances in breeding, hatcheries, and RAS improve yields and reduce mortality, lowering costs—especially for Pacific cupped oysters (Crassostrea gigas).
- Expansion of DTC and Specialty Retail Channels: Post-2020 expansion of direct-to-consumer delivery and premium retail channels is increasing accessibility and market reach.
Market Restraints
- Perishability and Cold-Chain Dependency: High perishability drives logistics costs and limits penetration in infrastructure-constrained regions.
- Food Safety and Regulatory Complexity: Strict food safety standards (e.g., pathogen control, traceability) increase compliance costs, particularly for small producers.
- Environmental and Climate Risk: Ocean acidification and harmful algal blooms disrupt production and create supply volatility.
Market Opportunities
- Premiumisation and Terroir-Based Marketing: A growing consumer segment equates oyster origin with quality and flavour profile - analogous to wine appellation. Provenance-certified oysters from Cancale (France) and Coffin Bay (Australia) command significant price premiums, supporting differentiated margin opportunities for origin-focused producers.
- Processed and Value-Added Product Development: Frozen half-shell, smoked, brined, and marinated oyster products are underpenetrated relative to market potential. Value-added products command 25-50% price premiums over commodity fresh products, offering improved margins, extended shelf-life benefits, and new market entry pathways in ambient-shelf retail categories.
- Emerging Market Aquaculture Expansion: South-East Asian markets, including Vietnam, Indonesia, and the Philippines, are investing in modernised oyster aquaculture infrastructure, supported by government developmental programmes. Expanding domestic middle-class demand will complement export growth into premium regional food markets.
Market Challenges
- Fragmented Industry Structure: A large proportion of global oyster production is controlled by small-scale, family-operated farms with limited capital for technology investment, quality certification, and supply chain integration. This fragmentation constrains production consistency, traceability implementation, and collective bargaining power in pricing negotiations with large retail and foodservice buyers.
- Food Safety Incidents and Consumer Perception: High-profile oyster-related foodborne illness outbreaks - particularly Vibrio and Norovirus events - generate disproportionately negative media coverage, causing temporary demand contractions that can persist for 6-12 months in affected markets.
Emerging Market Trends
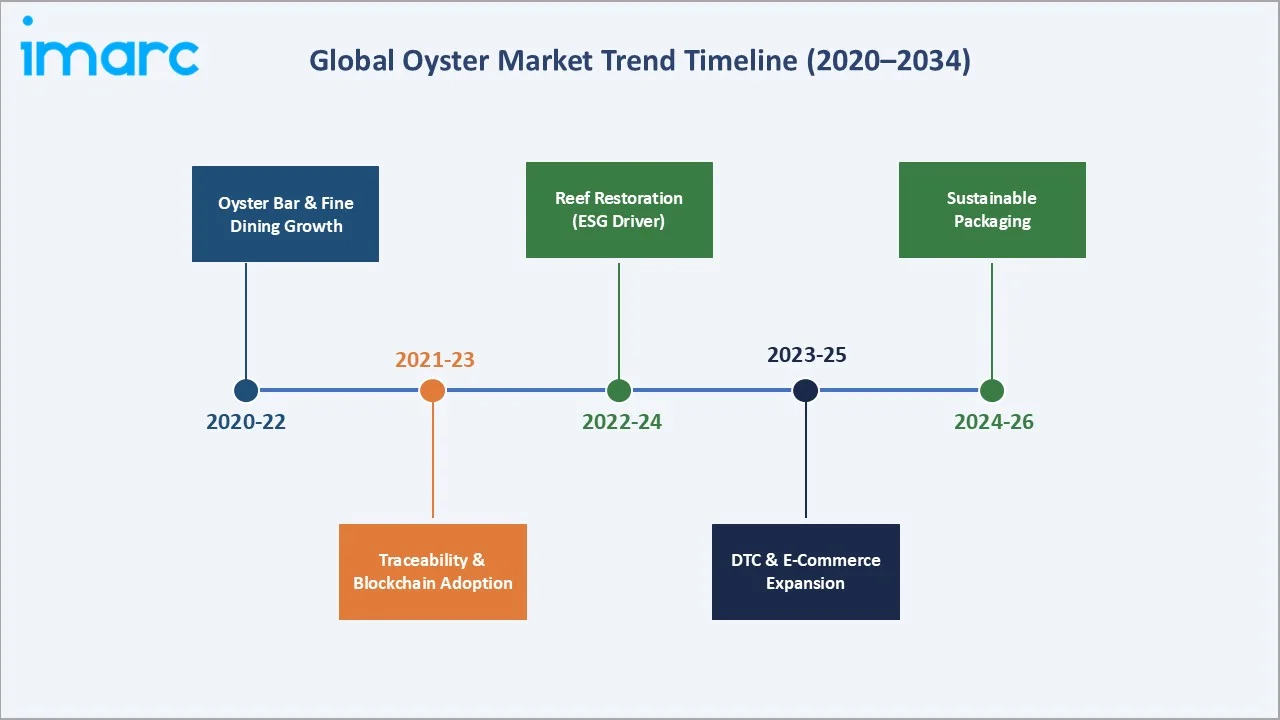
1. Oyster Bar and Fine-Dining Culture Driving Premium Demand
The global proliferation of dedicated oyster bar formats - from standalone oyster bars to integrated seafood counters in upscale supermarkets - is creating premium retail and foodservice demand structures. Cities including New York, London, Tokyo, and Shanghai have seen double-digit growth in oyster-focused dining establishments since 2020, elevating oysters from occasional indulgence to an accessible premium protein category.
2. Traceability Technology and Blockchain Integration
Seafood traceability technology adoption is accelerating, driven by regulatory requirements (EU Regulation 1380/2013, US Seafood Import Monitoring Program) and consumer demand. Blockchain-based provenance platforms, including those deployed by Hoopers Island Oyster Company, enable end-to-end supply chain visibility from grow-out bed to point of sale, reducing counterfeit risk and supporting premium pricing through verified origin claims.
3. Oyster Reef Restoration as a Regulatory and ESG Driver
Government-funded reef restoration programs in the US (NOAA), Australia (OzFish), and Europe (OSPAR Convention countries) are expanding the ecological foundation for commercial harvesting while generating positive ESG narratives for industry participants. The Nature Conservancy's global oyster reef restoration initiative spans over 50 countries, creating structural demand for hatchery-produced oyster seed stock.
4. Direct-to-Consumer (DTC) and E-Commerce Channel Expansion
Insulated express shipping has opened a viable DTC channel for premium producers, bypassing traditional wholesale intermediaries. US DTC operators demonstrate that premium oysters command USD 40-80 per dozen shipped - revenue multiples of 3-5x versus wholesale pricing. This trend is expanding to European and Asian urban markets, supported by improving express logistics infrastructure.
5. Sustainable Packaging and Zero-Waste Initiatives
Leading oyster producers and retailers are investing in sustainable packaging - fully compostable mesh bags, recycled corrugated containers, and shell recycling programs. French shell recycling initiatives achieve return rates exceeding 80% in major producing regions, representing both sustainability credentials and a cost-reduction strategy for hatchery operators requiring calcium carbonate substrate for larval settlement.
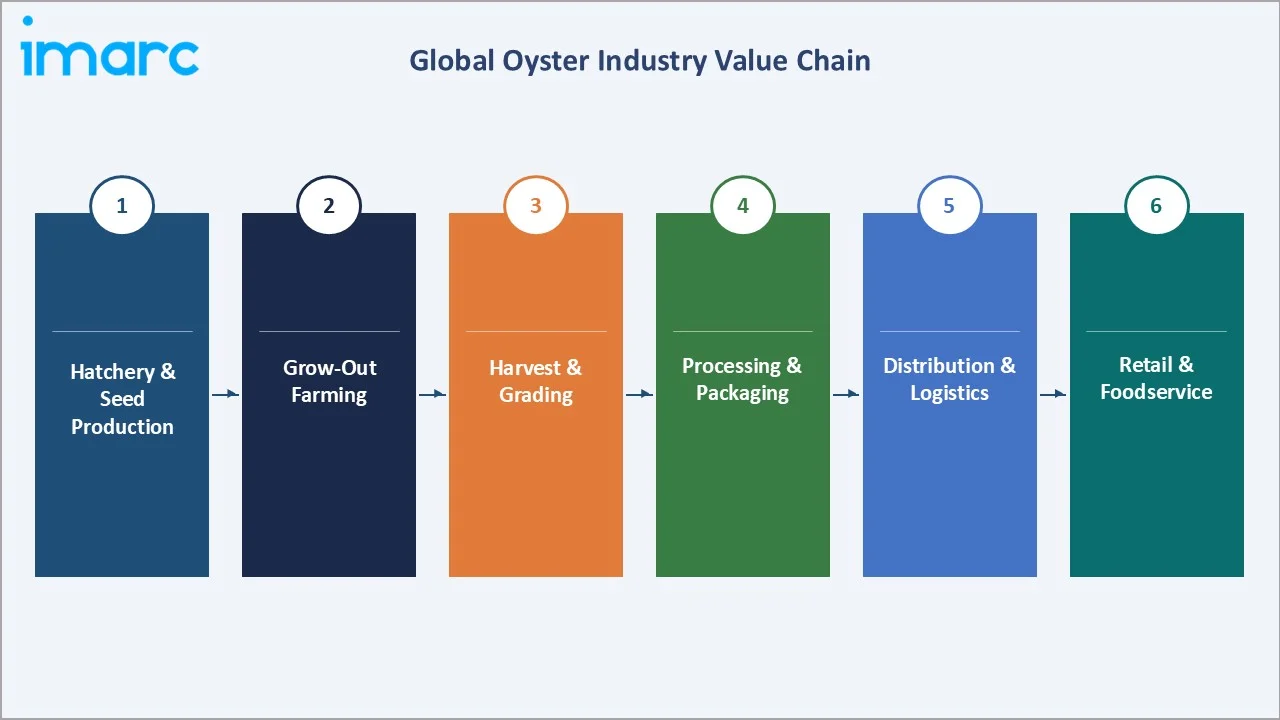
Industry Value Chain Analysis
The oyster industry value chain spans six integrated stages from seed production through end-consumer delivery. Each stage embeds distinct quality, regulatory, and commercial dynamics that collectively determine product integrity, market access, and price realisation.
|
Stage |
Key Players / Examples |
|
Hatchery & Seed Production |
Larval rearing, seed oyster production |
|
Grow-Out Farming |
Rack-and-bag, longline, cage, or bottom culture on licensed lease areas |
|
Harvesting & Grading |
Size-grading, washing, culling; manual in artisanal operations; automated in larger operations in China and the US Pacific Northwest |
|
Processing & Packaging |
Fresh (live/chilled), frozen half-shell, shucked/jarred, smoked, canned; cold-chain packing; HACCP compliance verification |
|
Distribution & Logistics |
Temperature-controlled trucking, air freight (export), DTC express courier; wholesale seafood distributors, auction markets. |
|
Retail & Foodservice |
Supermarkets, hypermarkets, specialty seafood retailers, online platforms, restaurants, hotels, oyster bars, catering operators |
Grow-out farm operators occupy the central strategic position in the oyster value chain, integrating seed procurement, environmental management, and quality-grade production into turnkey supply relationships with distributors and retailers. However, the increasing DTC channel penetration is enabling farm operators to capture retail-level margins directly, bypassing distributor intermediaries and significantly improving farm-gate revenue realisation.
Technology Landscape in the Oyster Industry
Hatchery and Selective Breeding Technology
Genomic selection programs have produced oyster strains with improved disease resistance - particularly against OsHV-1 (Pacific Oyster Mortality Syndrome) - reducing larval mortality rates by 20-35% in commercial trials. These genetic improvement programs are active in France, Ireland, Australia, and the United States, with France Naissain and Taylor Shellfish among the leading practitioners. Triploid oyster production technology enables year-round marketability by eliminating seasonal spawning quality degradation.
Environmental Monitoring and IoT Systems
IoT-connected sensors measuring dissolved oxygen, temperature, pH, and salinity at grow-out sites enable real-time environmental management that reduces stress-related mortality and improves growth rate predictability. Automated harvesting and sorting machinery, including optical grading systems processing 10,000+ oysters per hour, is reducing labor costs in large-scale operations in China and the US Pacific Northwest.
Food Safety and Traceability Technology
RFID-tagged harvest bags, GPS-logged harvesting vessel data, and blockchain-based chain-of-custody platforms are enabling rapid trace-back capability critical for EU and US regulatory compliance. Depuration technology advancements, including UV-assisted recirculation systems, are reducing pathogen loads in harvested oysters while minimizing holding mortality, improving food safety outcomes across the supply chain.
Market Segmentation Analysis
The report covers the following segments:
| Segment Category | Leading Segment | Market Share | Year |
|---|---|---|---|
| Oyster Type | American Cupped Oyster | 2.8% | 2025 |
| End User | Retail | 64.7% | 2025 |
| Packaging Form | Fresh | 70.0% | 2025 |
| Region | Asia Pacific | 94.9% | 2025 |

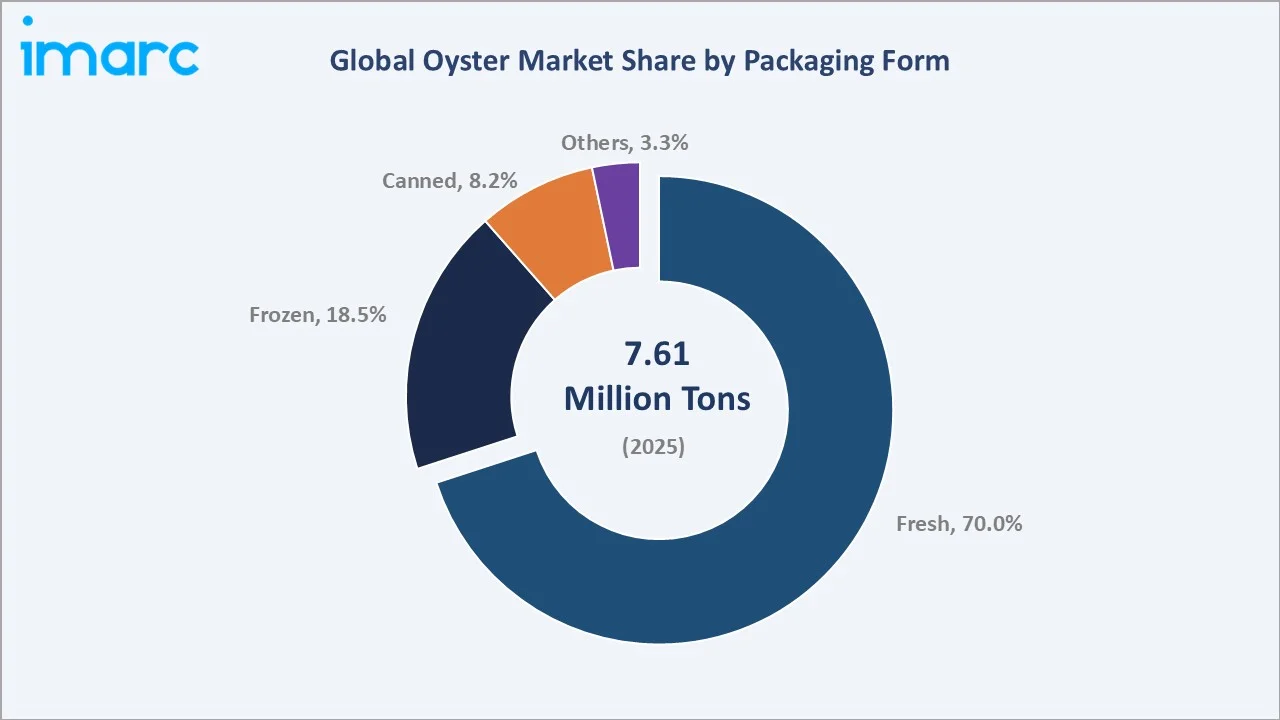
By Packaging Form
Fresh oysters command a 70.0% majority share in 2025, reflecting the market's strong preference for live, chilled shellfish in sophisticated seafood markets. The fresh segment benefits from well-established cold-chain logistics in Asia Pacific, North America, and Europe, with refrigerated transport infrastructure enabling 3-7-day shelf-life windows from harvest to consumption.
To access detailed market analysis, Request Sample
Frozen oysters hold 18.5% share in 2025, serving as the preferred format for export trade, food manufacturing inputs, and markets with limited cold-chain access. Frozen half-shell and frozen shucked products have expanded significantly into foodservice supply chains across North America, the Middle East, and Southeast Asia. Canned oysters at 8.2% maintain a stable value-oriented position in retail grocery, military provisioning, and processed food manufacturing. The Others category at 3.3% captures smoked, marinated, and specialty preserved formats experiencing premium growth in specialty retail and gifting channels.
By End User
Retail leads at 64.7% in 2025, driven by supermarket fresh seafood counter expansion, specialty shellfish retailers, and the rapidly growing online DTC channel. Supermarkets and hypermarkets have invested significantly in fresh seafood infrastructure, and specialty seafood retailers focused on premium shellfish continue to expand in major urban centers across North America and Europe. Online channels enabling DTC oyster delivery are the fastest-growing retail sub-segment within the category.
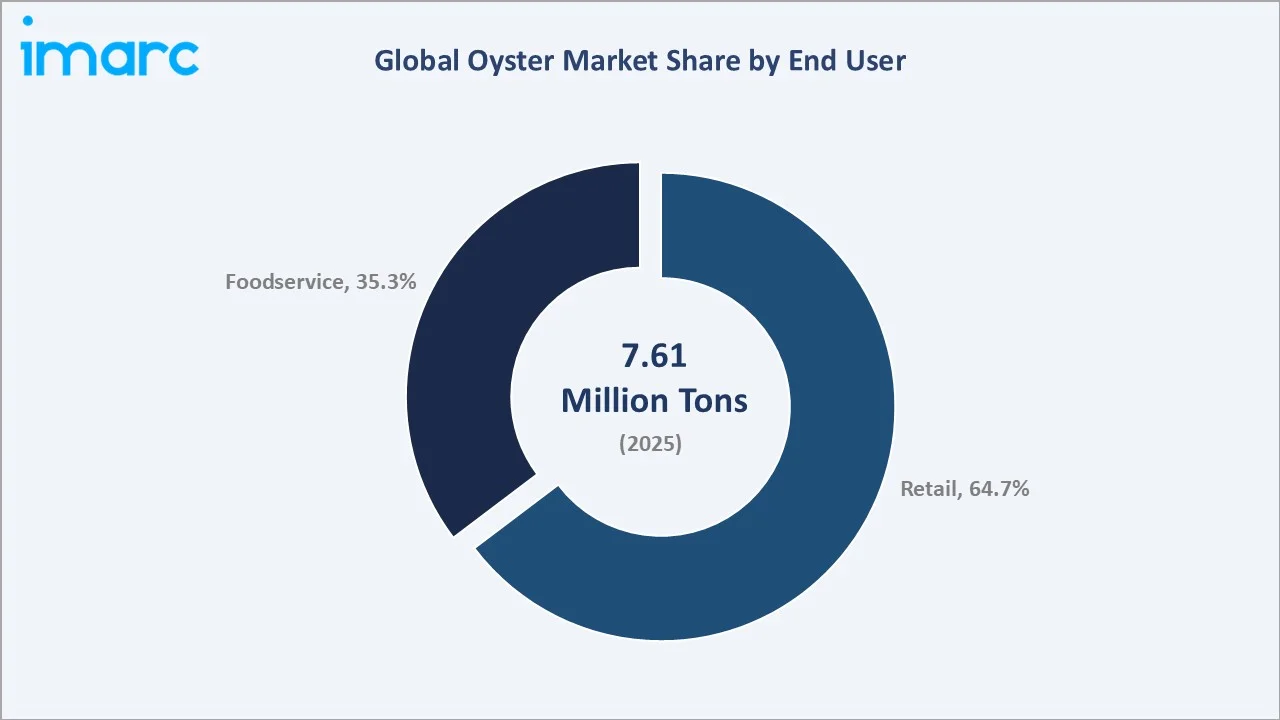
The Foodservice segment at 35.3% encompasses restaurants, hotels, catering operations, and institutional buyers. Fine-dining and casual-dining restaurants are the highest-value foodservice accounts for premium oyster producers, while volume demand from hotel banqueting, buffet operations, and institutional catering drives bulk purchasing. Oyster bars as a dedicated format have grown significantly in major global cities, creating a specialized high-revenue foodservice micro-segment commanding the highest per-unit prices across the supply chain.
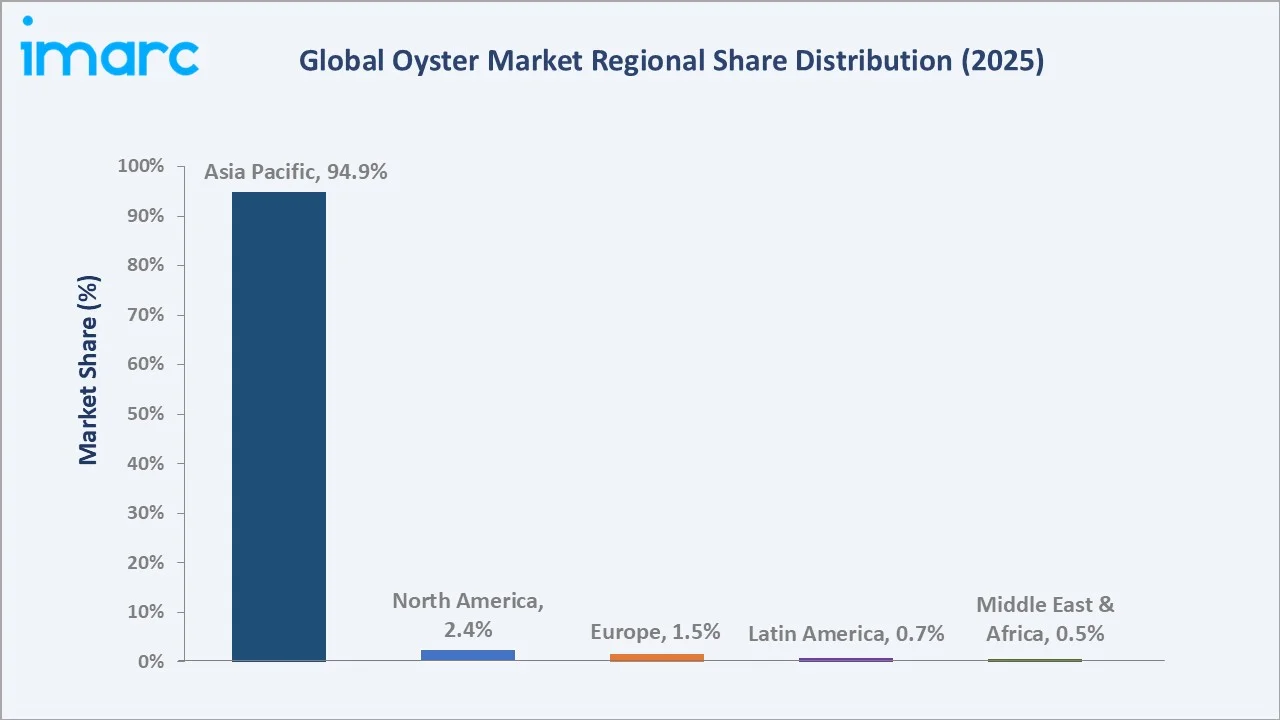
Regional Market Insights
|
Region |
Share (2025) |
Key Growth Drivers |
|
Asia Pacific |
94.9% |
China's scale production, Vietnam/Japan farming, government aquaculture programs, and urban seafood demand |
|
North America |
2.4% |
Premium shellfish demand, DTC expansion, NOAA reef restoration, East/West Coast terroir markets |
|
Europe |
1.5% |
France's artisanal oyster culture, EU sustainability regulation, and premium gastronomy demand |
|
Latin America |
0.7% |
Chilean aquaculture development, growing domestic seafood consumption, and export potential |
|
Middle East & Africa |
0.5% |
UAE/Qatar hospitality sector demand, Morocco/Egypt coastal aquaculture development |
Asia Pacific commands a 94.9% global volume share in 2025, an extraordinary level of regional concentration anchored by China. Chinese production is concentrated in Fujian, Guangdong, Shandong, and Guangxi provinces using suspended longline and raft culture systems. Japan (Hiroshima, Miyagi, and Iwate prefectures) and South Korea (Gyeongnam province) add significant regional volume with quality premium positioning for the domestic and export premium market.
North America at 2.4% represents a high-value, premium-oriented market with strong DTC channel growth and ASC-certified producer expansion. Europe, at 1.5%, is dominated by France's annual production, shaped by Label Rouge and IGP geographic protections and deep integration with fine-dining gastronomy.
Competitive Landscape
|
Company Name |
Key Brand / Products |
Market Position |
Core Strength |
|
Huitres Favier Earl |
Oysters Fines de Claires/ Oysters Fines de Claires Label Rouge ( red seal ) |
Emerging |
Marennes-Oléron artisanal production, French gastronomy |
|
Hog Island Oyster Company |
Hog Island Sweetwater, |
Leader |
DTC pioneer, ASC sustainability, West Coast premium brand |
|
France Naissain |
Nursery oyster seed/ Pre-grown oysters/ Half-Farming Oysters |
Challenger |
Hatchery seed supply, selective breeding, European market |
|
Mere Point Oyster Company |
Mere Point Oysters |
Emerging |
Maine terroir, premium Northeast US restaurant supply |
|
Taylor Shellfish Farms |
Kumamoto, Olympia, Totten Inlet Virginica and more |
Leader |
Largest US farmed shellfish producer; first US bivalve farm to achieve ASC certification; tide-to-table vertical integration with Pacific Rim export reach. |
|
Yumbah |
Sydney Rock Oysters |
Challenger |
Australia's largest vertically integrated Sydney Rock Oyster producer; controls rare, non-replicable growing leases; exports to SE Asia, China & Singapore |
|
Murder Point Oysters |
Murder Point Oysters |
Emerging |
Gulf Coast's breakout brand |
The global oyster competitive landscape is characterised by a large number of small-to-medium artisanal and semi-commercial operators, with no single company commanding a dominant global market share. The market's fragmented structure reflects the geographic specificity of oyster growing regions, regulatory constraints on aquaculture lease areas, and the importance of provenance in premium product positioning. Leading players differentiate through terroir-based branding, sustainability certifications, and DTC channel development.
Key Company Profiles
Hog Island Oyster Company
Hog Island Oyster Company, founded in 1983 and based in Marshall, California, is a West Coast oyster farming pioneer operating in Tomales Bay under Aquaculture Stewardship Council (ASC) certification. The company is widely credited with pioneering the farm-to-table oyster experience in the United States.
- Product: Hog Island Sweetwater, Tomales Miyagi, Atlantic Oysters; DTC online store, on-farm restaurant, farmers’ market channels.
- Recent Developments: In August 2024, Hog Island Oyster introduced its Petaluma local pick-up policy.
- Strategic Focus: Hog Island’s strategy centres on sustainability innovation, educational aquaculture tourism at its Tomales Bay farm, West Coast premium foodservice partnerships, and DTC brand expansion, capitalising on the growing premium home dining trend.
Huitres Favier Earl
Huîtres Favier EARL is a family-owned oyster producer based in the Marennes-Oléron basin—France’s largest oyster-growing region—renowned for traditional “claire” finishing techniques that enhance flavor and texture. The company operates across oyster farming, maturation, and direct sales, positioning itself within the premium French oyster segment.
- Product Portfolio: Fine de Claire and Spéciale de Claire oysters; direct farm sales, online store, regional market distribution, and export channels.
- Recent Developments: In January 2017, Huitres Favier Earl became the first farm in France to achieve ASC certification. The French oyster producer received a cluster certification for its La Tremblade and Paimpol units.
- Strategic Focus: Technology-enabled transparency as a premium pricing driver, Chesapeake Bay habitat restoration alignment, and expansion of premium foodservice channel accounts in East Coast fine-dining and hotel restaurant segments.
France Naissain
France Naissain is a specialist oyster hatchery and seed production company operating in France's primary oyster-growing regions, supplying naissain (seed oysters) to commercial farmers across France and export markets. The company plays a foundational role in the European oyster supply chain as a genetics and hatchery technology leader.
- Product & Platform Portfolio: Nursery oyster seed/ Pre-grown oysters/ Half-Farming Oysters.
- Recent Developments: In 2022, France Naissain invested in a new production site in Bouzigues (34) and established the company Conch'Med.
- Strategic Focus: Disease-resistant genetics development as the primary differentiator, expanding triploid production capacity to reduce seasonal availability constraints, and building export seed supply relationships with emerging aquaculture markets in Ireland, Spain, and North Africa.
Market Concentration Analysis
The global oyster market displays low-to-moderate concentration at the global level, with no single company accounting for more than 2-3% of global revenue. This fragmentation is most pronounced in the Asia Pacific, where China's production is distributed across hundreds of thousands of family-operated and small cooperative farms, making consolidated market share tracking methodologically complex. Outside China, concentration is somewhat higher within individual national markets.
Consolidation trends are emerging selectively. In the US, larger regional producers are expanding through lease area acquisitions and brand portfolio development. In France, cooperative structures are growing in scale to achieve collective certification and marketing efficiencies. In the processed and frozen sub-segment, a smaller number of food manufacturers and trading companies command disproportionate influence through volume purchasing power and retail shelf access.
Investment & Growth Opportunities
Fastest-Growing Segments
Value-added oyster products are the fastest-growing and highest-margin segment. Formats such as smoked, marinated, and premium canned oysters are gaining traction in specialty retail and e-commerce, supported by longer shelf life and premium positioning. Direct-to-consumer (DTC) fresh oyster delivery—enabled by cold-chain logistics—has expanded beyond the U.S. into Europe and East Asia, broadening access to premium consumers and supporting double-digit growth in niche channels.
Emerging Market Expansion
Southeast Asia—particularly Vietnam, Indonesia, the Philippines, and Thailand—represents the most significant near-term growth region, driven by aquaculture investment and rising middle-class seafood consumption. The Middle East, led by the United Arab Emirates, is emerging as a premium import market, supported by high-end hospitality demand and reliance on live oyster airfreight imports from Europe and Australia.
Venture & Private Investment Trends
Investment is concentrated in aquaculture technology, including recirculating aquaculture systems (RAS), environmental monitoring, and selective breeding. Public funding support—particularly through programs led by NOAA Sea Grant and the USDA Aquaculture Initiative—has cumulatively exceeded ~$200 million since 2010, accelerating innovation in shellfish farming. Private equity and venture capital activity is increasing in branded premium seafood and DTC models, reflecting investor interest in scalable, differentiated seafood platforms.
Future Market Outlook (2026-2034)
The global oyster market forecast projects steady volume expansion from 7.61 Million Tons in 2025 to 9.00 Million Tons by 2034 at a CAGR of 1.88%. While the growth rate is measured relative to higher-CAGR seafood categories, the trajectory reflects a structurally stable, premium-positioned market with durable demand fundamentals and improving supply-side productivity driven by aquaculture technology investments.
Three structural trends will shape the oyster market through 2034. First, Asia Pacific aquaculture scaling—led by China’s shift toward higher-value formats (live export, premium fresh, half-shell frozen)—will lift overall market margins. Second, DTC and e-commerce channels will expand beyond the U.S. into Europe and East Asia, widening the premium consumer base. Third, sustainability certifications (e.g., ASC, Label Rouge) will become essential for access to major retail and foodservice channels by 2028–2030.
Climate risk remains the key headwind. Ocean acidification, harmful algal blooms, and temperature stress will increase production volatility, requiring ongoing investment in hatchery innovation, site diversification, and selective breeding of resilient oyster strains.
Research Methodology
Primary Research
Primary research included interviews with oyster industry stakeholders—farmers, hatcheries, distributors, retailers, and foodservice buyers—across Asia Pacific, North America, and Europe, validating market size, segmentation, value chain, and competitive dynamics.
Secondary Research
Secondary sources include the FAO Fisheries & Aquaculture Department (FISHSTAT+ database), NOAA Fisheries aquaculture data, EU STECF aquaculture production statistics, Aquaculture Stewardship Council certification reports, national seafood industry association publications, company annual reports, and trade publications including SeafoodSource, Hatchery International, and Seafood News. UN Comtrade and Eurostat Comext import/export trade databases supplemented primary research inputs.
Forecasting Models
Market size estimations and growth projections were derived using a combination of bottom-up and top-down forecasting approaches, incorporating production volume data, price trend analysis, end-user demand modelling, and macroeconomic variables including GDP growth rates, urbanization indices, and per-capita seafood expenditure patterns. Scenario analysis (base, optimistic, and conservative cases) was applied to account for climate risk uncertainty and supply disruption scenarios.
Oyster Market Report Scope:
| Report Features | Details |
|---|---|
| Base Year of the Analysis | 2025 |
| Historical Period | 2020-2025 |
| Forecast Period | 2026-2034 |
| Units | Million USD, Million Tons |
| Scope of the Report |
Exploration of Historical Trends and Market Outlook, Industry Catalysts and Challenges, Segment-Wise Historical and Future Market Assessment:
|
| Oyster Types Covered | Cupped Oyster, Pacific Cupped Oyster, American Cupped Oyster, Penguin Wing Oyster, Others |
| End Users Covered |
|
| Packaging Forms Covered | Fresh, Frozen, Canned, Others |
| Regions Covered | Asia Pacific, North America, Europe, Latin America, Middle East and Africa |
| Countries Covered | China, Indonesia, India, Vietnam, Japan, Bangladesh, United States, Canada, France, Ireland, Netherlands, United Kingdom, Spain, Russia, Chile, Mexico, Brazil, Egypt, Morocco, Nigeria |
| Companies Covered | Huitres Favier Earl, Hog Island Oyster Company, France Naissain, Mere Point Oyster Company, Taylor Shellfish Farms, Yumbah, Murder Point Oysters, etc. |
| Customization Scope | 10% Free Customization |
| Post-Sale Analyst Support | 10-12 Weeks |
| Delivery Format | PDF and Excel through Email (We can also provide the editable version of the report in PPT/Word format on special request) |
Key Benefits for Stakeholders:
- IMARC’s report offers a comprehensive quantitative analysis of various market segments, historical and current market trends, market forecasts, and dynamics of the oyster market from 2020-2034.
- The oyster market research report provides the latest information on the market drivers, challenges, and opportunities in the global market.
- The study maps the leading, as well as the fastest-growing, regional markets. It further enables stakeholders to identify the key country-level markets within each region.
- Porter's five forces analysis assist stakeholders in assessing the impact of new entrants, competitive rivalry, supplier power, buyer power, and the threat of substitution. It helps stakeholders to analyze the level of competition within the oyster industry and its attractiveness.
- Competitive landscape allows stakeholders to understand their competitive environment and provides an insight into the current positions of key players in the market.
Frequently Asked Questions About the Oyster Market Report
The global oyster market was volumed at 7.61 Million Tons in 2025, driven by rising sustainable seafood demand, aquaculture scaling in the Asia Pacific, and expanding premium retail and foodservice channels globally.
The market is projected to reach 9.00 Million Tons by 2034, growing at a CAGR of 1.88% during 2026-2034, supported by DTC channel expansion, value-added product development, and sustained Asia Pacific production growth.
Fresh oysters dominate with a 70.0% share in 2025, driven by superior consumer preference for live, chilled shellfish and well-developed cold-chain logistics across major producing nations in the Asia Pacific and Europe.
Retail leads with a 64.7% share in 2025, supported by supermarket fresh seafood counter expansion, specialty shellfish retailers, and the growing DTC online oyster delivery channel in North America and Europe.
Asia Pacific leads with an extraordinary 94.9% revenue share in 2025, driven by China's role as the world's largest oyster producer, alongside significant contributions from Japan, South Korea, and Vietnam.
Key drivers include rising demand for sustainable seafood, health awareness around zinc and omega-3-rich shellfish, aquaculture technology improvements, expansion of premium retail channels, and DTC e-commerce growth.
Value-added and processed formats - smoked, marinated, and premium canned products - are the fastest-growing sub-segment, commanding 25-50% price premiums and growing strongly in specialty retail and e-commerce.
Key companies include Huitres Favier Earl, Hog Island Oyster Company, France Naissain, Mere Point Oyster Company, Taylor Shellfish Farms, Yumbah, and Murder Point Oysters.
Sustainability is a primary growth driver: oysters require no feed inputs and improve water quality. ASC certification, reef restoration programs, and sustainable packaging are increasingly mandated by major retail and foodservice buyers.
DTC express delivery platforms enable premium producers to bypass wholesalers, achieving USD 40-80 per dozen revenue versus wholesale pricing, broadening geographic consumer reach and brand-building opportunities significantly.
Need more help?
- Speak to our experienced analysts for insights on the current market scenarios.
- Include additional segments and countries to customize the report as per your requirement.
- Gain an unparalleled competitive advantage in your domain by understanding how to utilize the report and positively impacting your operations and revenue.
- For further assistance, please connect with our analysts.
 Request Customization
 Speak to an Analyst
 Request Brochure
 Inquire Before Buying
Benefits of Customization
- Personalize this research
- Triangulate with your data
- Get data as per your format and definition
- Gain a deeper dive into a specific application, geography, customer, or competitor
- Any level of personalization
Get in Touch With Us
UNITED STATES
Phone: +1-201-971-6302
INDIA
Phone: +91-120-433-0800
UNITED KINGDOM
Phone: +44-753-714-6104
Email: [email protected]
Client Testimonials


.webp)


